
What Does a Supply Chain Analyst Do? Skills, Tools and the Portfolio That Gets You Hired
What a supply chain analyst does in a normal week, the four kinds of question the job answers, the tools that matter, and the three-project portfolio that gets you hired.
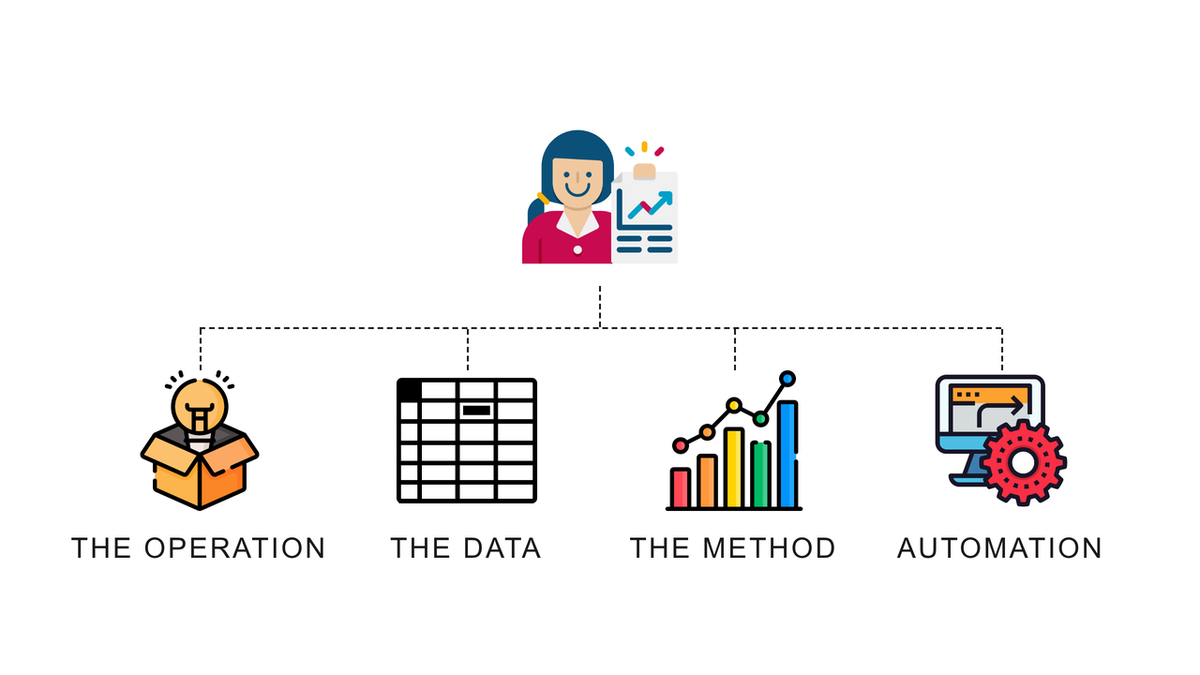
A supply chain analyst turns the data an operation already produces into decisions the operation can act on: how much to order, where to store it, which route to run, why the shipment was late.
The job title is one of the fastest growing in the field, and the job description behind it is one of the vaguest, which is why I get the same message in my inbox most weeks.
"I want to become a supply chain analyst, and I do not know what the job actually is or what to learn first."
I have spent ten years on both sides of that question, first as a supply chain engineer running warehouse and transport operations in Asia and Europe, then hiring and training analysts for the analytics products I build.
In this article, I will describe what a supply chain analyst does in a normal week, the four kinds of question the job answers, the tools that matter, and the portfolio that gets you hired.
The scenario: one week at a retailer's distribution centre
Take a supply chain analyst at a fashion retailer, sitting between the warehouse, the transport team and the planners.
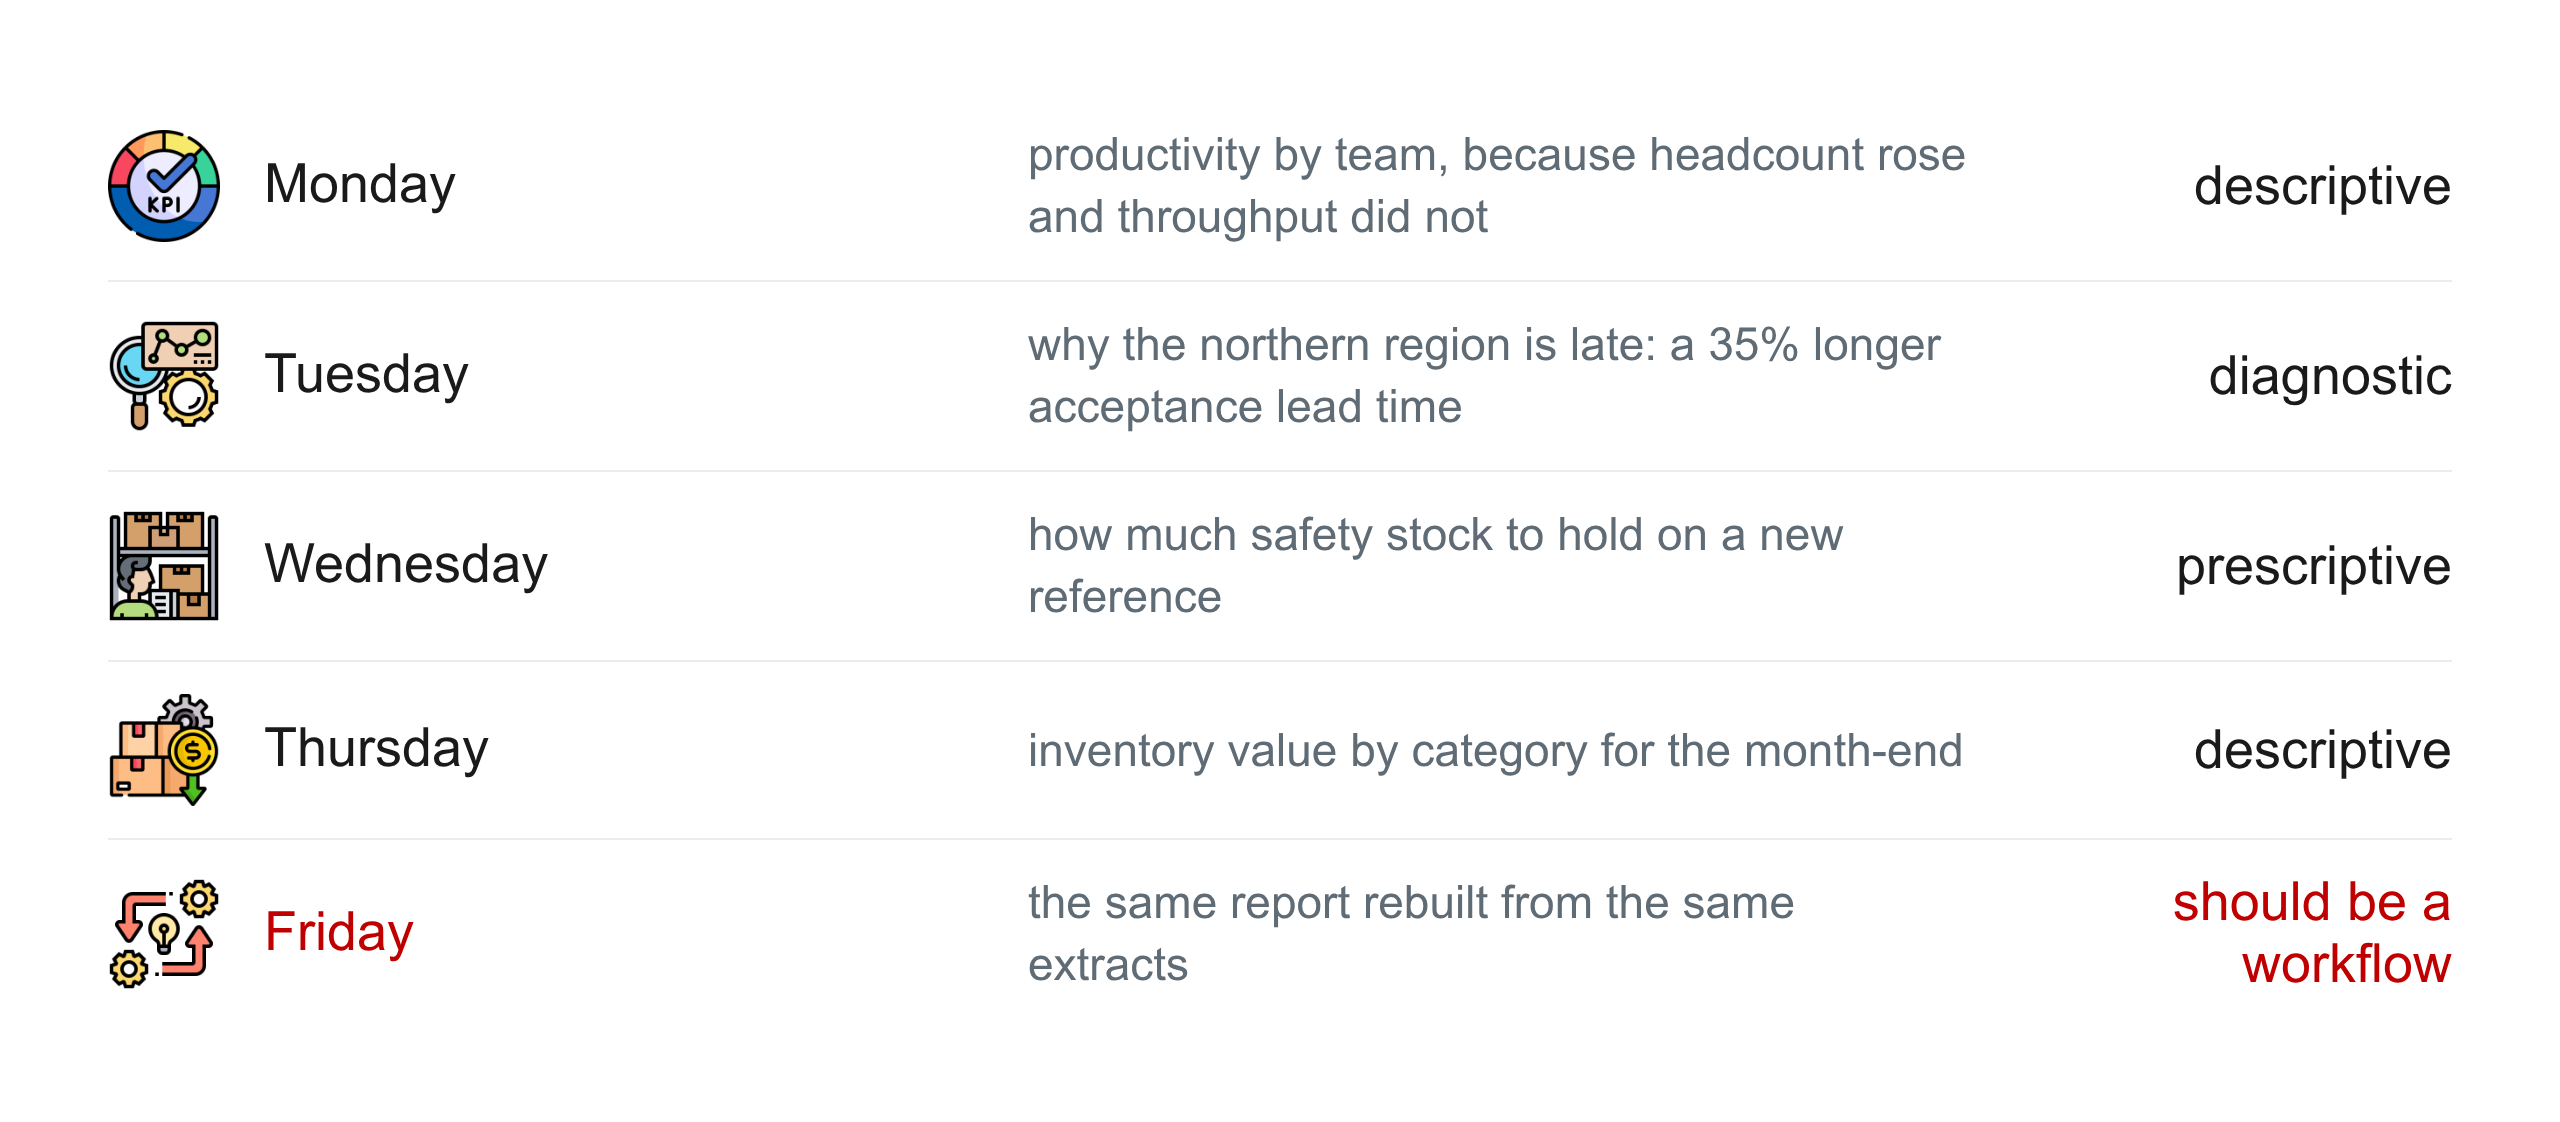
On Monday the warehouse manager wants last week's productivity by team, because the operator count went up and the throughput did not.
On Tuesday transport asks why deliveries to the northern region are late more often than the southern one, and the answer turns out to be a 35% longer acceptance lead time at the northern hub.
On Wednesday the planners want to know how much safety stock to hold on a new reference, and on Thursday finance wants the inventory value by category for the month-end.
On Friday the analyst rebuilds the same report from the same extracts, because nobody automated it yet.
Every one of those requests is a different type of question, and recognising the type is most of the job.
The four kinds of question the job answers
Supply chain analytics is usually taught as four types of tool, and each type is really a question written out in a formal way.
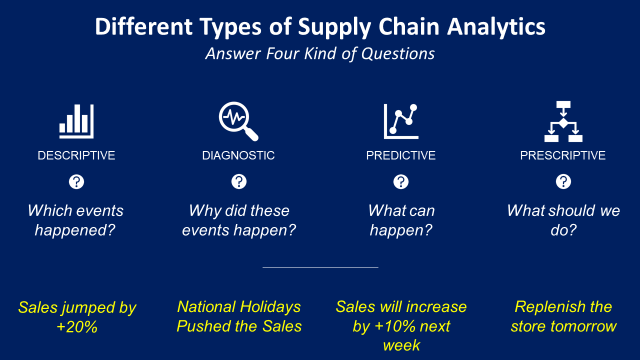
What happened is descriptive: the productivity report, the shipment status, the inventory value, delivered as an operational dashboard or a control tower.
Why it happened is diagnostic: tracing the late deliveries back through the timestamps to the hub that caused them, which is where logistic performance management lives.
What will happen is predictive: the demand forecast the planners order against, and the feature engineering behind it.
What to do about it is prescriptive: the safety stock, the reorder point, the route, the plan, which is optimisation and the part of the job that changes a number on the P&L.
A job asking you to reduce inventory cost is asking for the last two. A course that taught you to draw a chart has given you the first.
Most analysts spend their first years on the first two types, and the ones who move up are the ones who learn to recognise when a request is really the third or the fourth.
The tools, in the order they matter
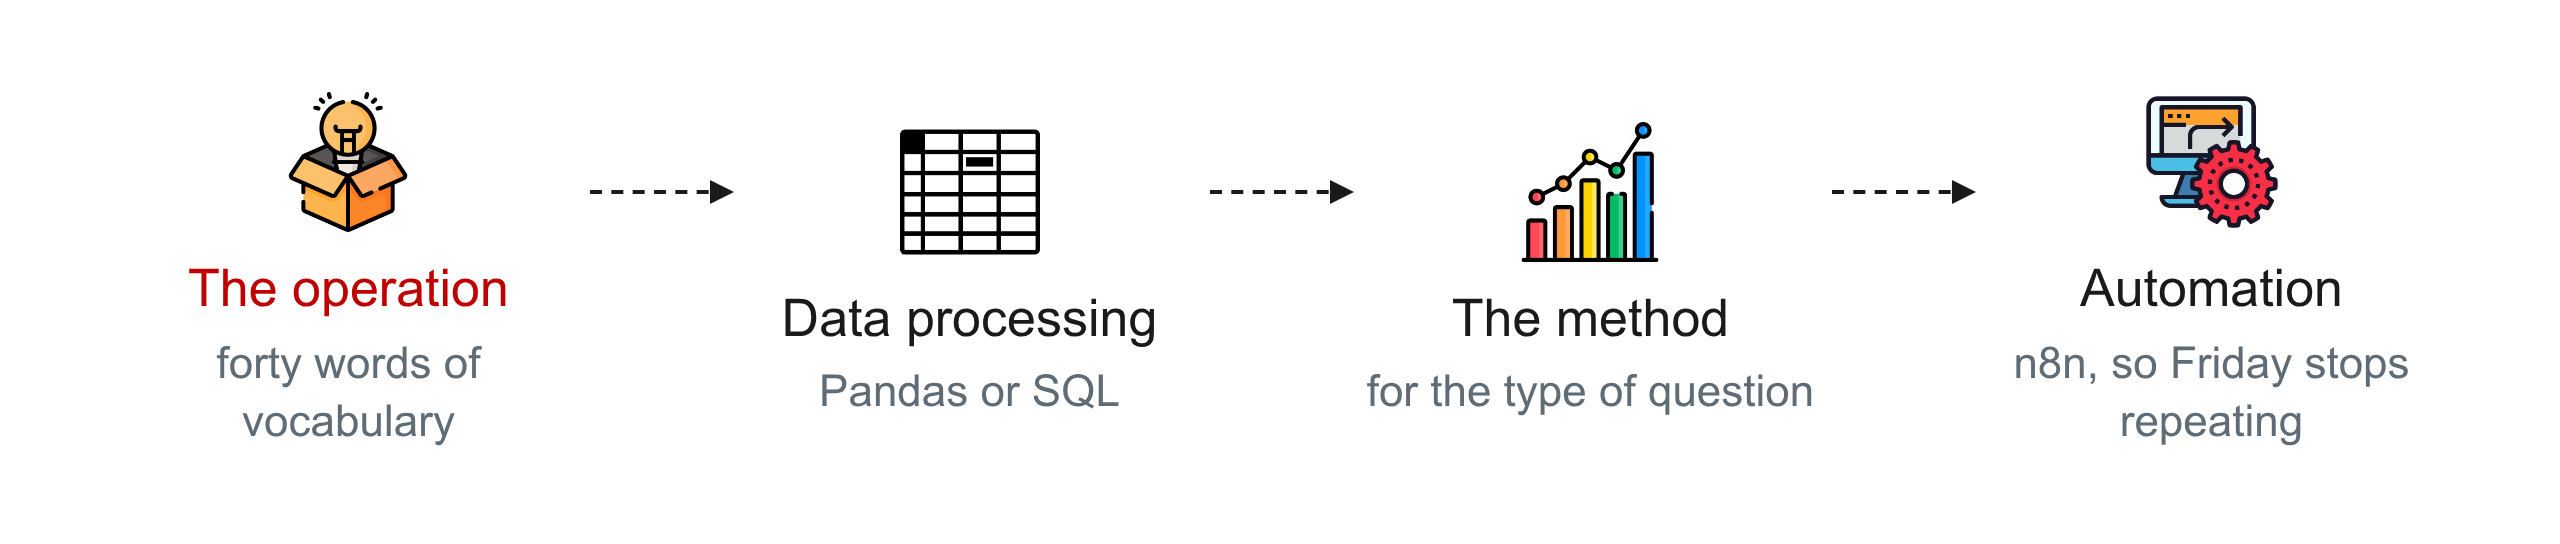
First, the operation
The tool nobody lists is the vocabulary of the operation, and it is the one that decides whether the analysis is worth anything.
You cannot spot that the review period is the lever if you do not know what a review period is.
About forty words cover most of it: handling unit, order line, wave picking, putaway, cross-docking, review period, coverage, OTIF, full and less than truck load, minimum order quantity.
I condensed ten years of operations into a playlist of short explainer videos for exactly this reason, and warehouse operations explained is the written version of the warehouse half.
Second, data processing
Every type of question above starts by joining timestamps from several systems into one table, and that is Python with Pandas or SQL.
Excel is where most operations keep their data, so automating the spreadsheet you already use is usually the first thing a new analyst is asked for and the fastest way to be noticed.
Third, the method for the type
Descriptive work needs a visualisation tool, Power BI or Tableau or a Python dashboard, and the four smart visualisations cover most of what an operation asks for.
Diagnostic work needs statistics, and a Chi-squared test is how you check that a productivity difference is real rather than noise.
Predictive work needs machine learning, and prescriptive work needs operations research, a solver such as PuLP or OR-Tools and the linear programming that most supply chain optimisation reduces to.
Fourth, and increasingly, automation
The Friday report that gets rebuilt by hand is the one that should have been a workflow, and in 2026 that means n8n rather than a script on somebody's laptop.
I have watched more than a hundred supply chain professionals learn to automate their weekly reporting with n8n, and the ones who did stopped being a queue for the rest of the team.
The portfolio that gets you hired
Hiring managers want to know whether you can walk into an operation, work out what is genuinely wrong, and defend your answer to somebody who has run that warehouse for fifteen years.
A Kaggle notebook does not show that, and a portfolio of three projects that each start from an operational question does.
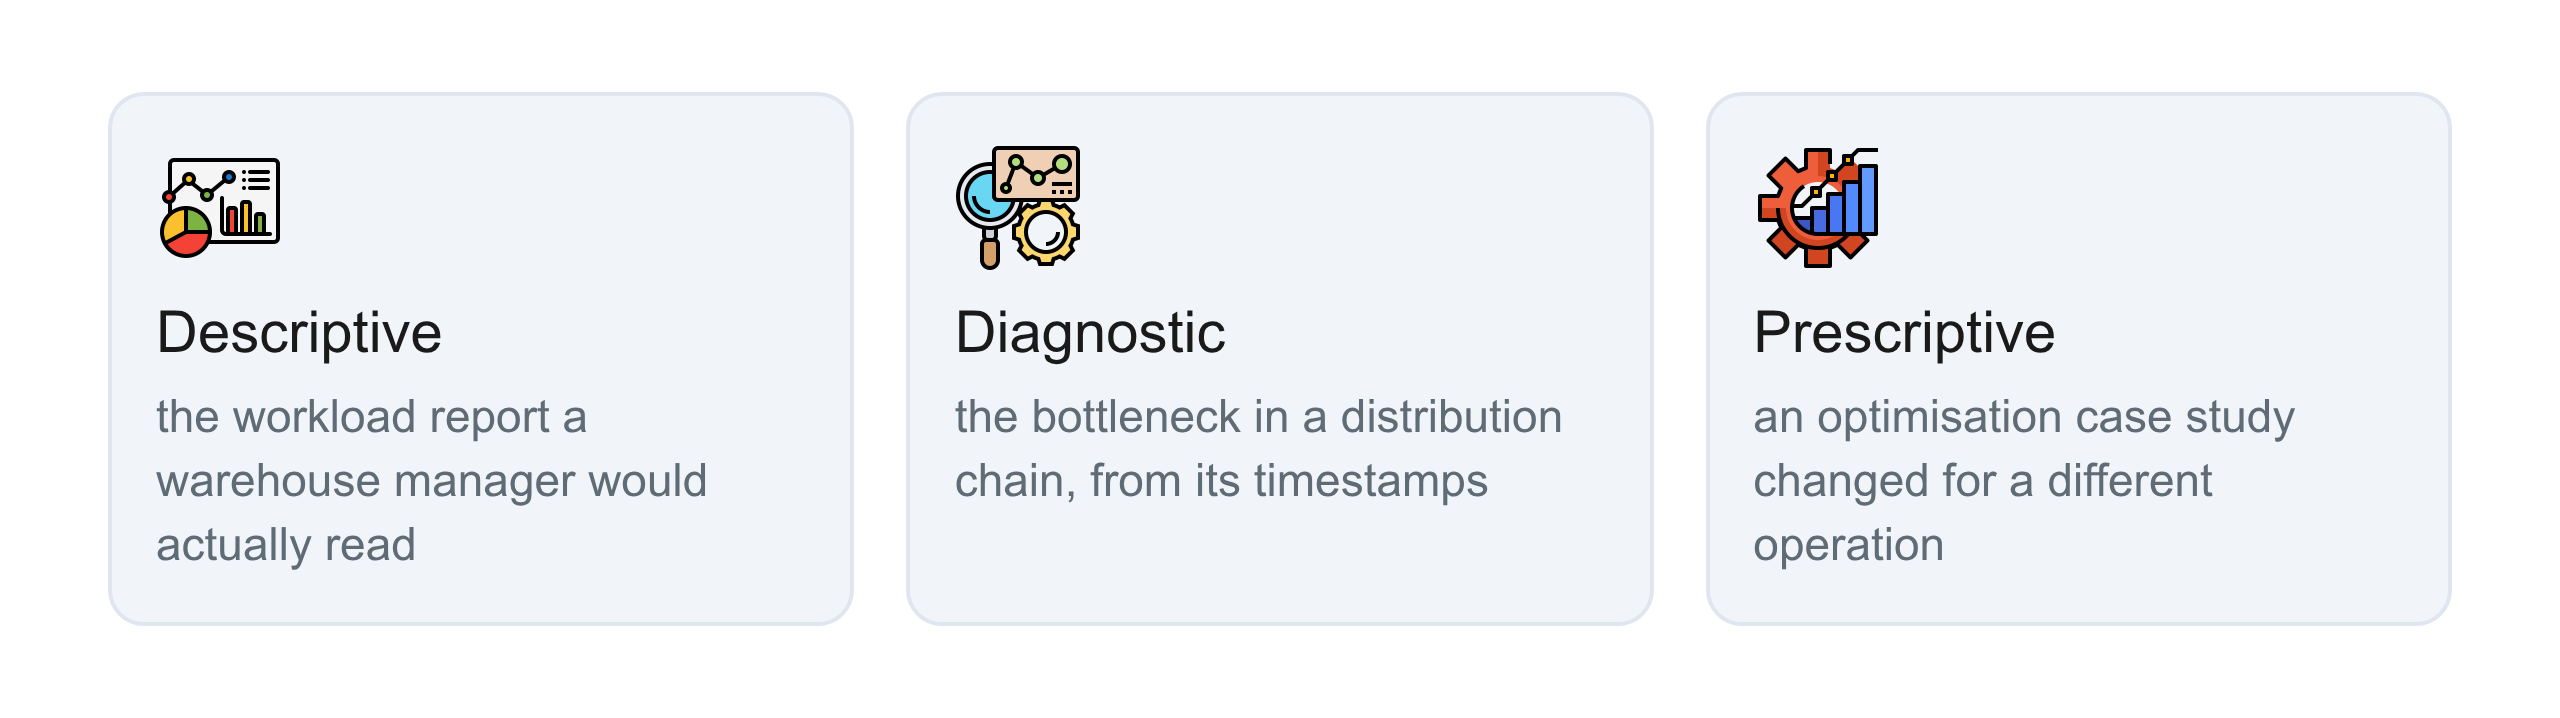
Project one, descriptive: take a public dataset of orders or shipments and build the workload report a warehouse manager would actually read, with the KPIs named in the operation's own words.
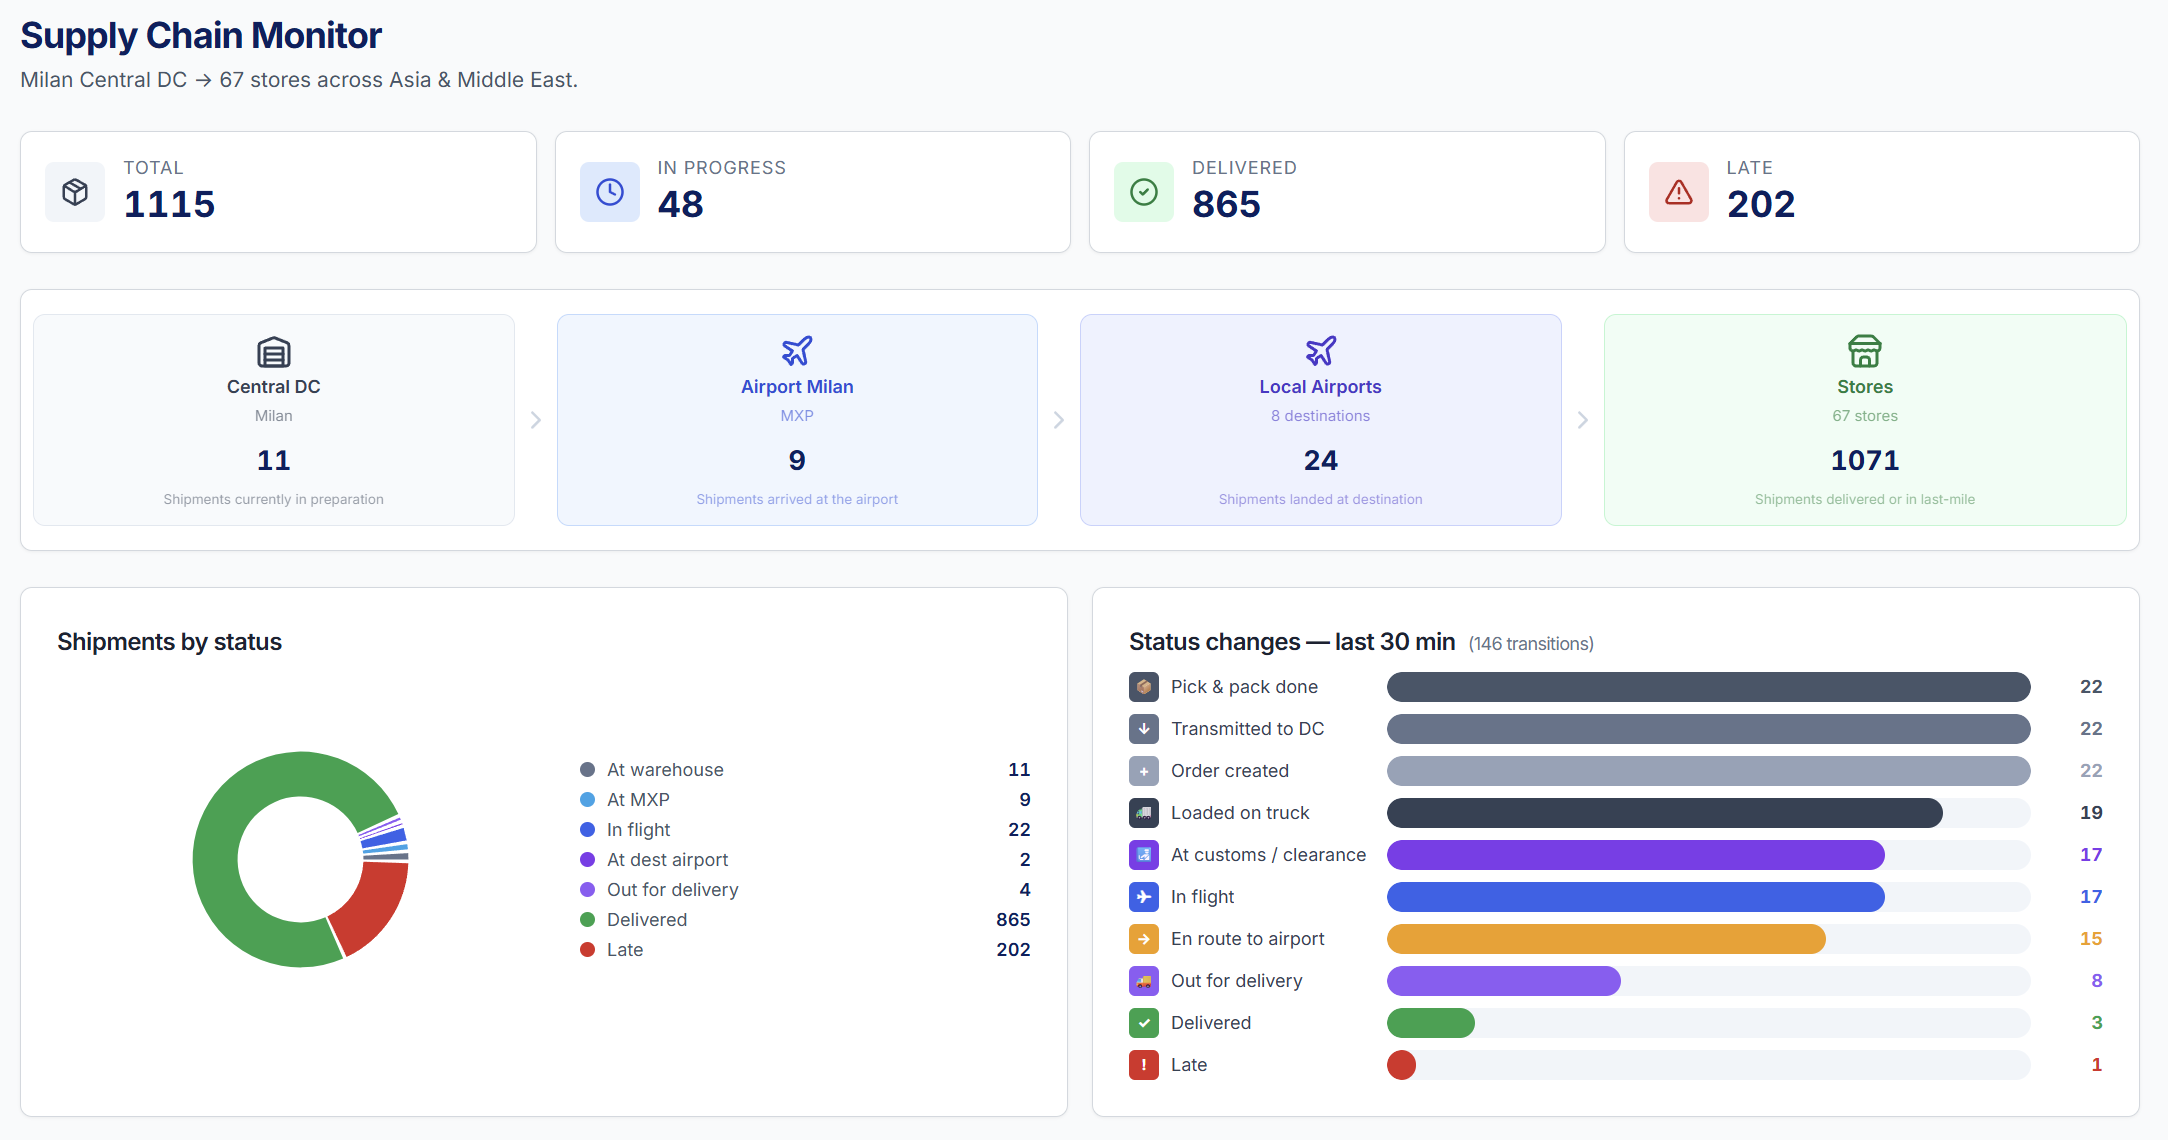
Project two, diagnostic: find the bottleneck in a distribution chain from its timestamps, the way the control tower case study does, and write the one sentence a logistics director could act on.
Project three, prescriptive: take one of the optimisation case studies, the ABC and Pareto analysis is the easiest to start with, and change something because the operation is different, not because the technique is impressive.
Your change has to follow from the problem you framed, not from the technique you wanted to show off.
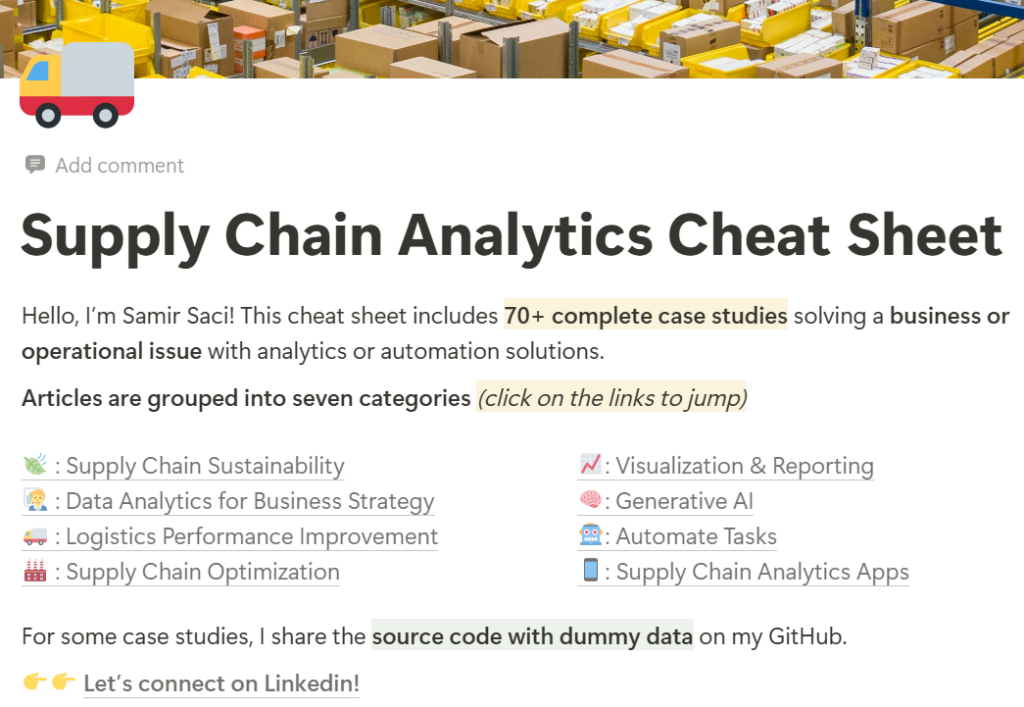
The portfolio guide walks through this with the cheat sheet, and every case study on this blog carries the source code on GitHub to start from.
Where the job goes from here
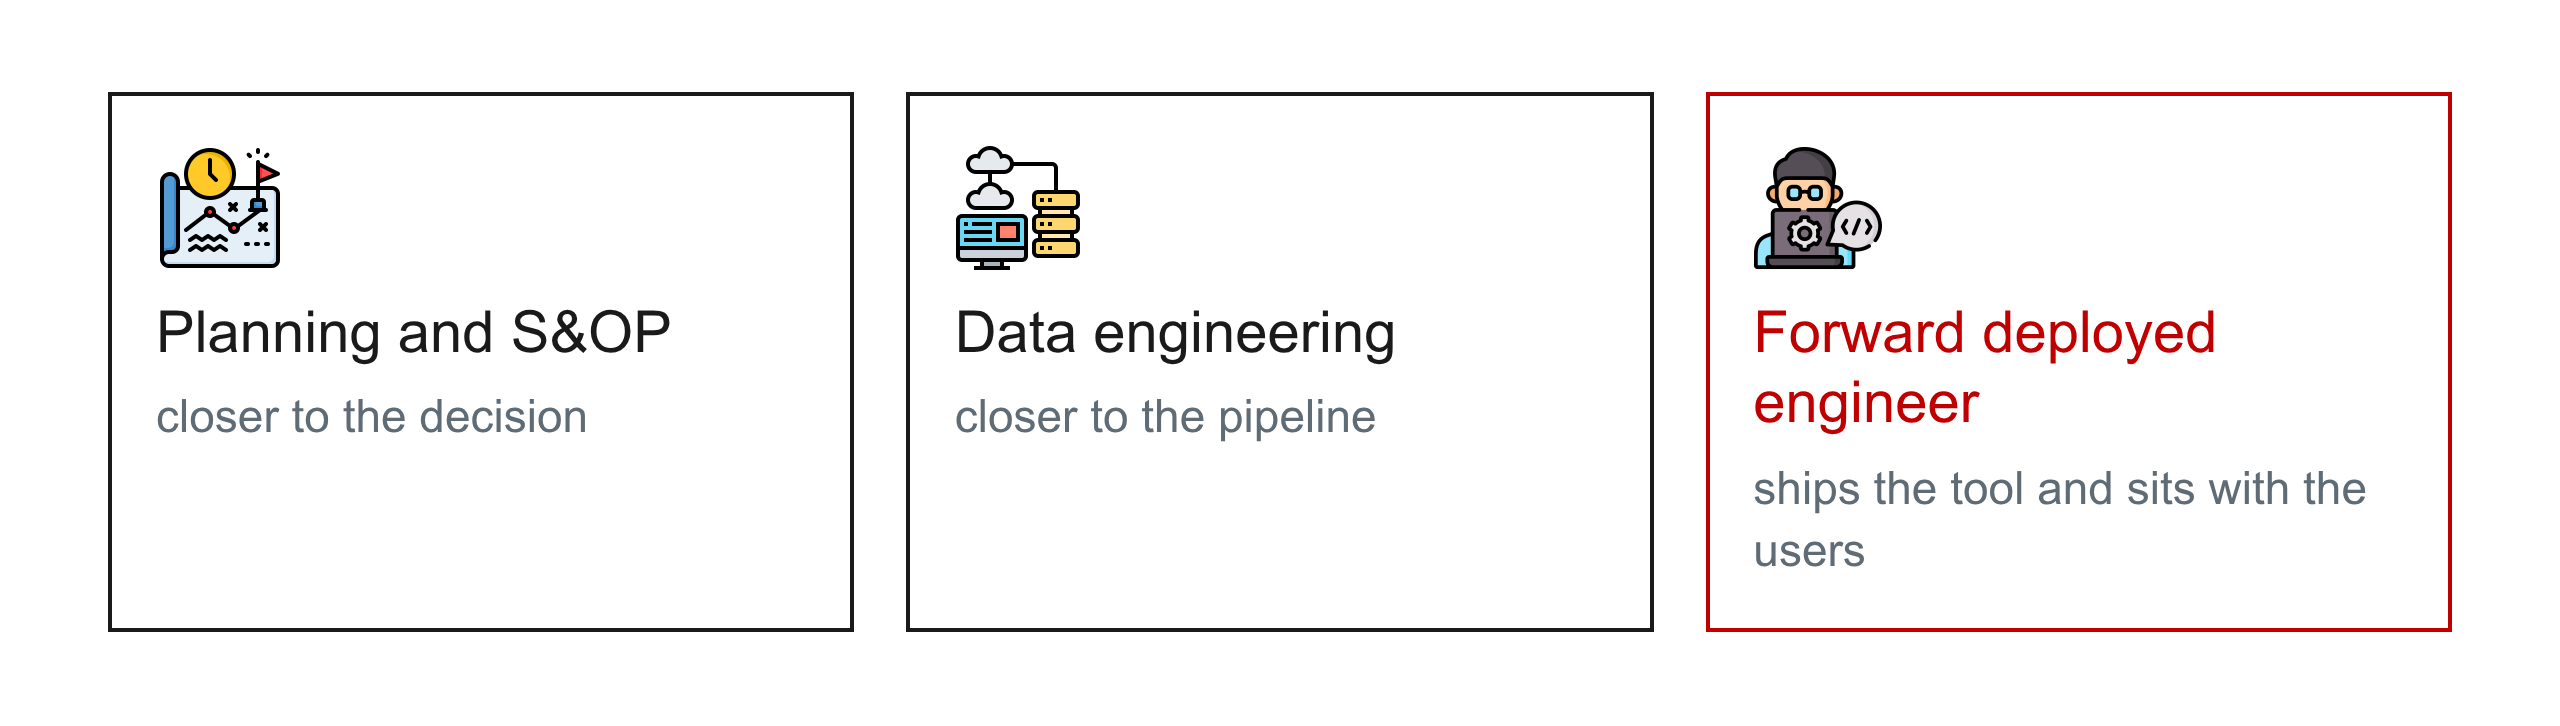
The analyst who can frame the question, join the data and defend the answer becomes the person the operation calls first, and from there the path splits.
Some go towards planning and S&OP, some towards data engineering, and a growing number towards the forward deployed engineer role, which is the analyst who also ships the tool and sits with the users until it is adopted.
I made the longer argument for why supply chain is the best domain for a data scientist elsewhere, and the short version is that the problems are unsolved, made of data, and attached to a number somebody cares about.
Conclusion
A supply chain analyst answers four kinds of question with an operation's own data, and the job is learned by recognising the type, joining the timestamps, and defending the answer to the person who runs the floor.
What we covered in this article
A week in the job, the four types of question and which two fill most weeks, the tools in the order they matter, the three-project portfolio, and where the role leads.
Where to go next
If you want to find your level before you build anything, the Supply Science App opens on a five-question assessment by career track and keeps your progress from there.
Related videos
The videos behind this article, already on the channel:
- How to start learning Supply Chain Analytics?
- I Built a Portfolio That Got Me Hired in Analytics
- 5 Smart Visualisations for Supply Chain Analytics (Source Code)
- Learn to Calculate OTIF and Service Level in 20 Minutes
- 10 min to Learn Claude Code as a Supply Chain Professional (Tutorial for Beginners)
The ones coming next, with the date each goes public:
- How To Find Your Business Bottleneck With Python, 16 September 2026
- How to Prove a Process Change Actually Worked (Kruskal-Wallis), 2 November 2026
- How to Test if Two Factors Are Really Linked (Chi-Squared), 18 November 2026
- 4 Charts That Get Your Supply Chain Analysis Read, 23 November 2026
About Me
Let's connect on LinkedIn and Twitter. I am a Supply Chain Engineer who is using data analytics to improve logistics operations and reduce costs.