Logistic Performance Management Using Data Analytics
Implement operational indicators to monitor and improve the performance of international distribution networks
A supply chain is a goal-oriented network of processes and stock points used to deliver goods and services to customers.
The performance of your network can be summarised in one sentence
Are you delivering your end customers on time in full?
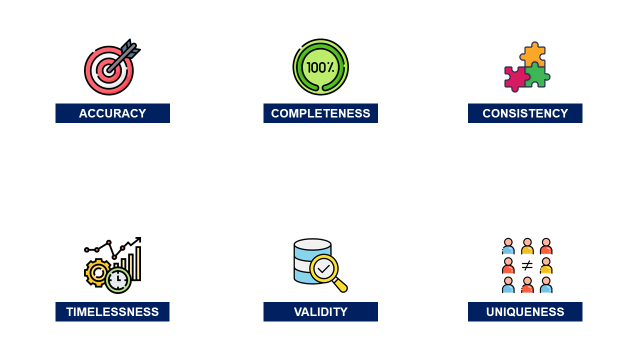
Behind this simple question lies a set of complex KPIs to monitor and understand your performance.
In this article, we will try to understand the minimum set of indicators and the methodology required to pilot complex logistic operations.
💌 New articles straight to your inbox for free: Newsletter
I. Example of a Simple Supply Chain Network
Production and delivery of garments for a fashion retailer
II. End-to-End Lead Times
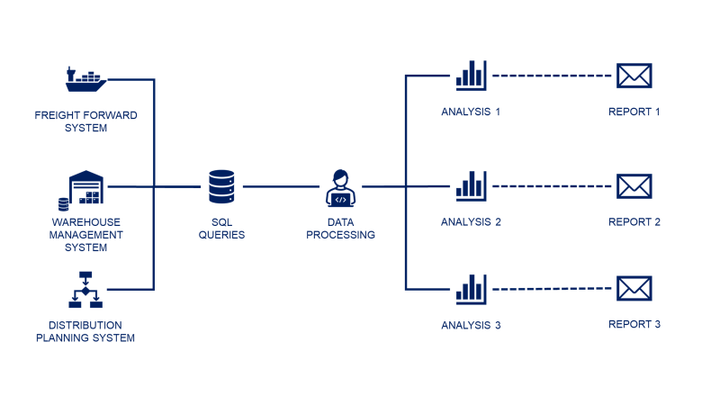
Lead time between the order creation and the store delivery1. Information flow
Each step of the process is tracked by different systems
2. End-to-End Visibility
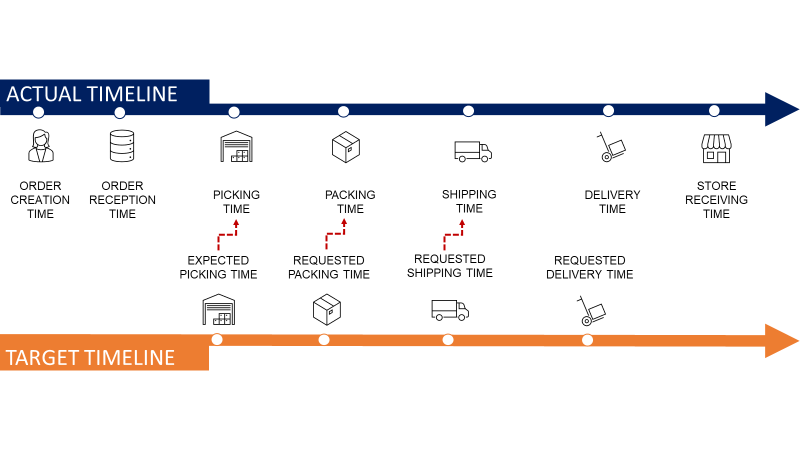
Record time stamps from order creation to shipment delivery
3. KPIs and Lead times
Actual versus targets lead times
IV. Conclusion
1. Root Cause Analysis
What can go wrong?
2. Next steps
Root cause analysis and improve the performance
Example of a Simple Supply Chain Network
Scenario
You are a logistics performance manager at an international clothing group that has stores all around the world.
The company is producing garments, bags and accessories in factories located in Asia.
Stores are delivered from local warehouses that are directly replenished by factories.
Stores Replenishment
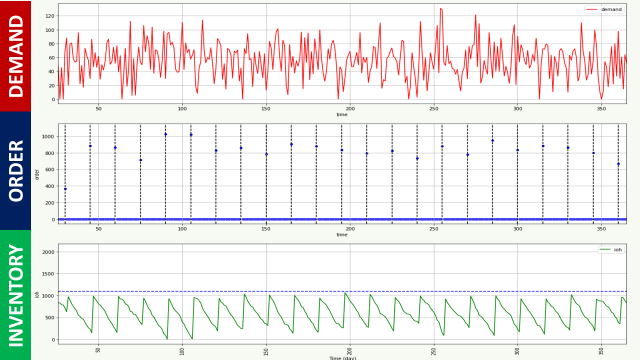
Distribution planners manage inventory in stores to meet demand.
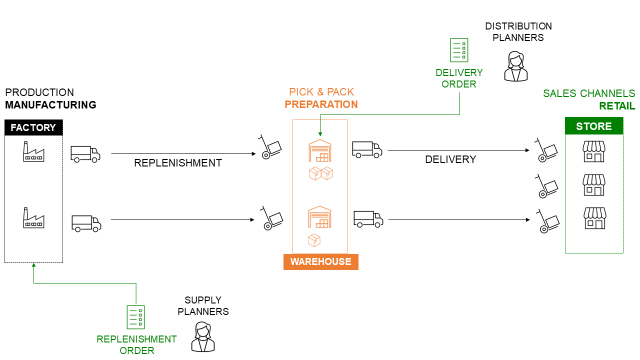
When the inventory level, for a specific reference, reaches the minimum level
- The distribution planner creates a store replenishment order in the ERP with the quantity for each item and a requested delivery date
- The order is transmitted to the warehouse management system
- Warehouse operational teams prepare the orders for shipment
- Transportation teams organise the pick-up at the warehouse
- Shipments are delivered and received at the stores
If you want to learn more about inventory management policies, have a look at the article below
Warehouse Replenishments
The same process is carried out at the warehouse level by Supply Planning teams to ensure a minimum inventory level for order preparation.
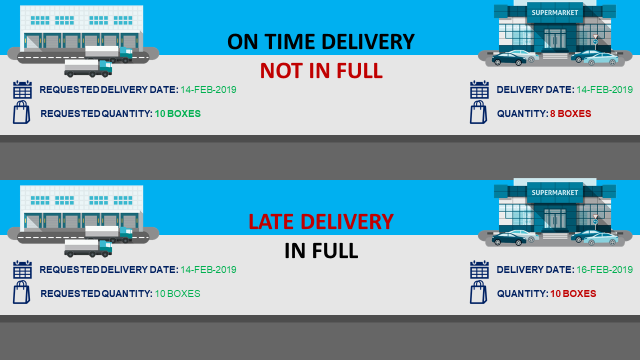
Overall Performance: On Time In Full (OTIF)
The overall process performance can be measured by the capacity of the network to deliver the stores on time and with the right quantity of items (in full).
As a logistics performance manager, your focus will be on improving this indicator that is driving the satisfaction of your internal customers (i.e. the stores).
End-to-End Analysis
However, this indicator alone cannot give you full visibility of what is happening in the chain.
Therefore, we will need to break it down and understand what is impacting the overall performance using data analytics.
End-to-End Distribution Process
Let us break down the different steps between order creation and shipment delivery.
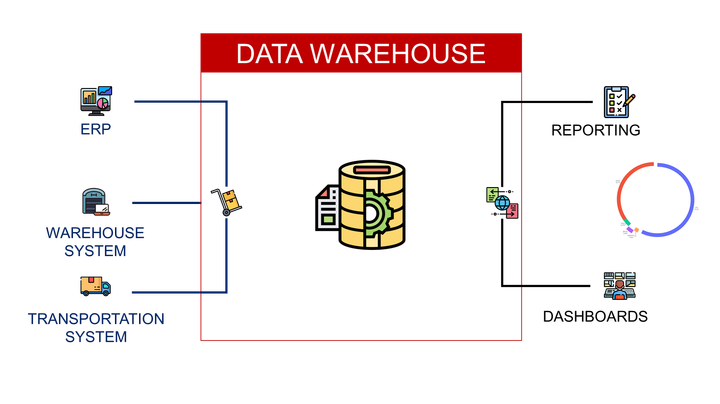
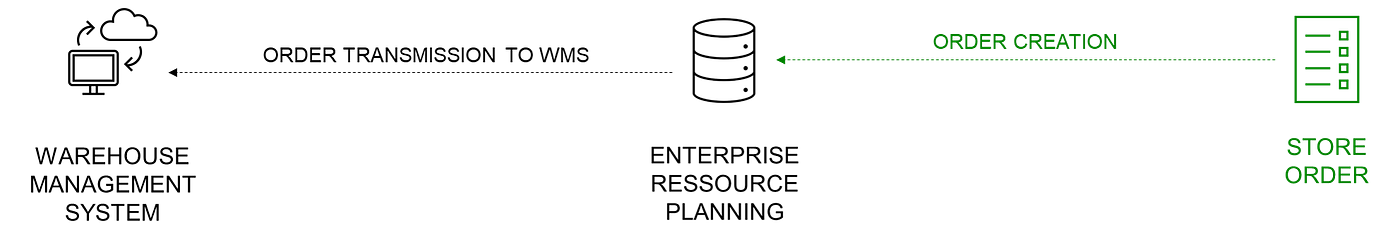
Information flow
In Supply Chain Analytics, everything starts with understanding the flow of information.
By connecting to the right systems, you’ll extract and process the right information.
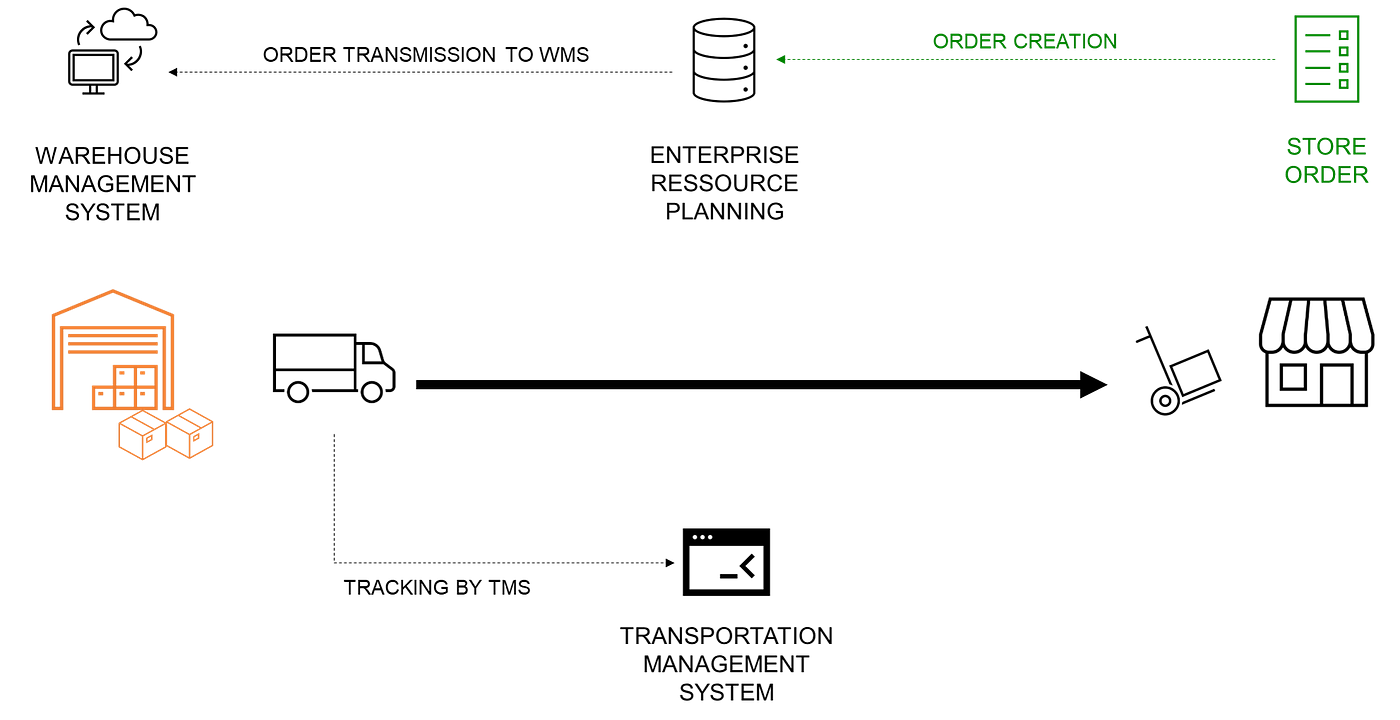
Scenario: Store Replenishment
The inventory levels of some references are below the minimum safety level in several stores.
- A distribution planner is creating a replenishment order in the ERP with quantities and requested delivery dates
- The order is transmitted to the WMS before the expected picking date
- Warehouse operational teams prepare and pack the orders
- A truck is assigned for pick-up at the warehouse
- Shipment information is transmitted to the TMS for tracking
- The goods are delivered to the store
- Items are received in the ERP by store teams
End-to-End Visibility
After connecting the different systems, you can get detailed visibility of each step between replenishment order creation and store delivery.
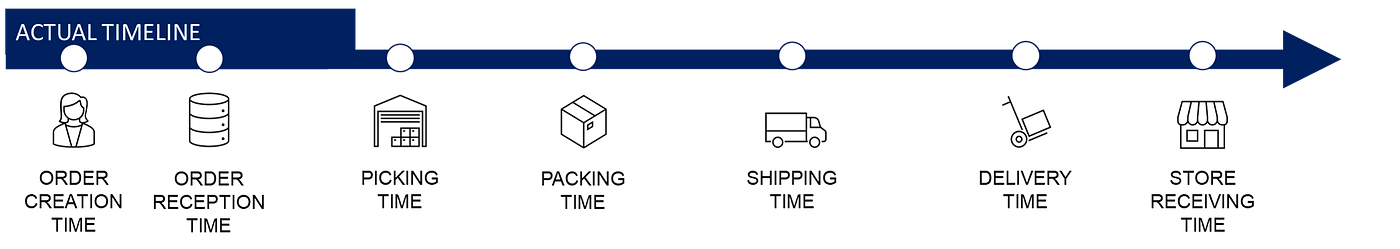
- Order reception time: timestamp when the order is received in the WMS and ready to be prepared in the warehouse
- Warehouse Operations: picking, packing and shipping are tracked by the WMS
- Transportation: tracking of the orders from shipping to delivery
- Store receiving: timestamp when store teams are receiving the shipments in the ERP
During the order creation, planners are adding a requested delivery date that can be used to calculate the targeted timing for each process.
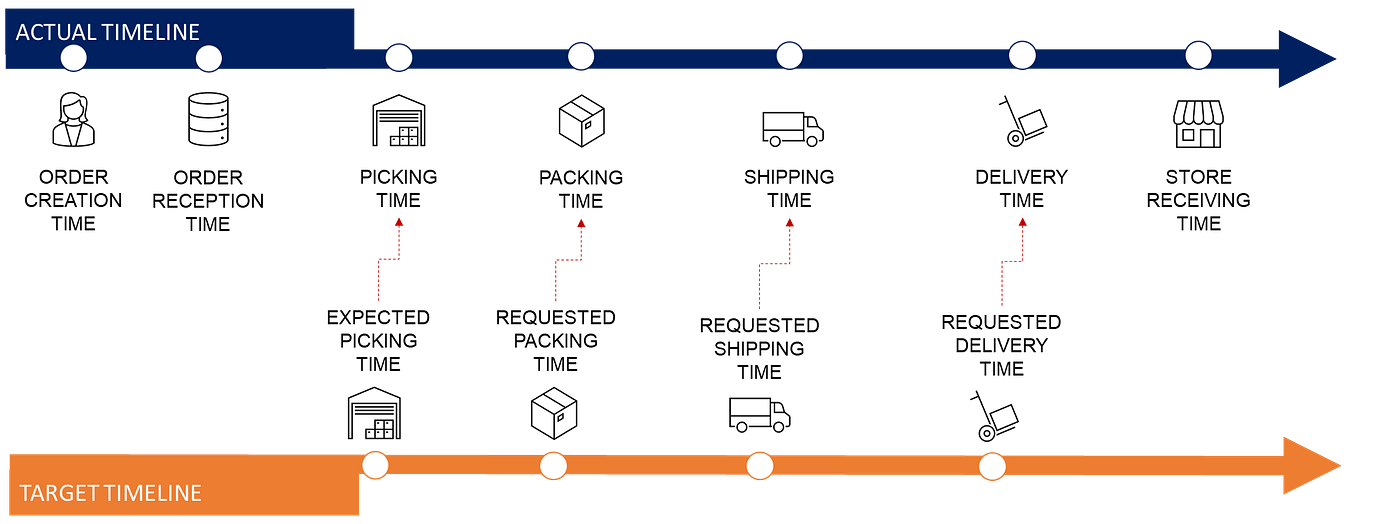
Thus, we can know at each step, if operations are behind the schedule and find potential bottlenecks.
Lead times
There is no point in looking only at the OTIF at delivery.
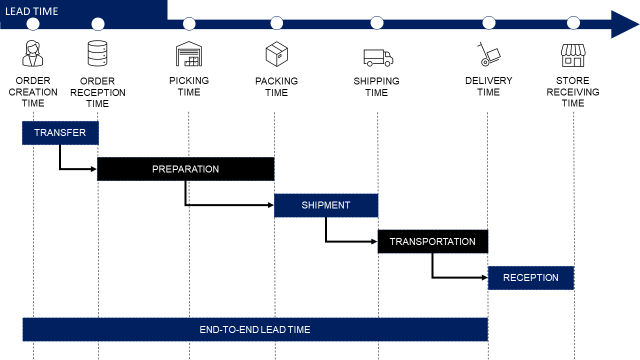
The segmentation by sub-process is mandatory to monitor the performance of each leg of the logistic network:
- Order transfer is impacted by infrastructure & software
- Order preparation is linked with the capacity and productivity of warehouse operations
- Pick-up scheduling lead time between the end of packing and shipping time
- Transportation from the warehouse to the store
Conclusion
Now that we have visibility on each step of the process, what can we do to improve the overall performance?
Root Cause Analysis
To improve overall performance, you need to identify the root cause(s) of late deliveries.
What can go wrong in the process?
IT Infrastructure & Softwares
It starts with the systems.
You may experience delays due to capacity issues or system failures.
If the order is not received by the WMS, your warehouse teams cannot proceed with preparation and shipment.
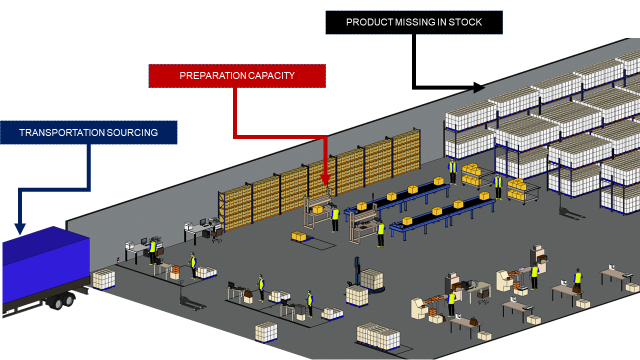
Warehouse Operations
In the warehouse, the lead time can be impacted by
- Stock-out: products missing, causing back orders and cancellations
- Capacity: resources shortage to absorb the workload (people, equipment)
- Transportation sourcing: You cannot find trucks to pick up packed orders
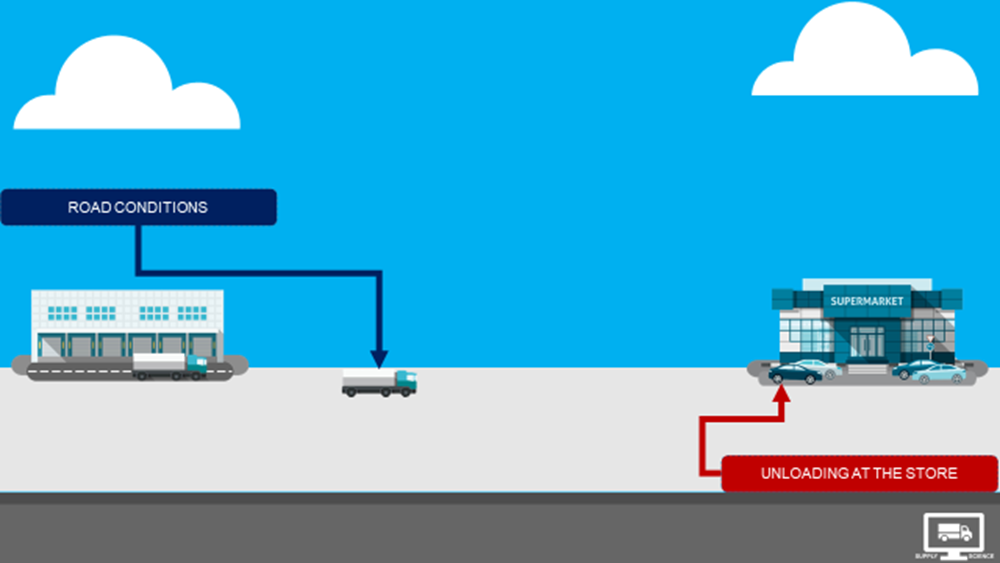
Transportation
After the truck leaves the warehouse, the lead time can be impacted by
- Road conditions or delays during transfers for multi-modal transportation
- Postponement of delivery due to availability constraints, such as a shortage of store staff to receive the goods, store closure, …
These are general examples that must be adapted to your specific situation.
Next Steps
Reaching this step is already challenging. Indeed, identifying all the root causes requires tremendous effort in coordination, analysis, and systems mapping.
The logistics teams need to work on mitigation plans to prevent these issues in the future.
Thus, you are able to build around this reporting tool a recurrent process for performance management with:
- Weekly or monthly analysis of the data
- Implementation and follow-up of continuous improvement plans
Data analytics tools will not provide the solutions, but they can help the operational teams to find the bottlenecks and failures in the process.
About Me
Let’s connect on LinkedIn and Twitter. I am a Supply Chain Engineer who is using data analytics to improve logistics operations and reduce costs.
If you’re looking for tailored consulting solutions to optimize your supply chain and meet sustainability goals, feel free to contact me.