Supply Chain Process Optimization Using Linear Programming
Understand how linear programming can be the most powerful tool for a supply chain continuous improvement engineer.
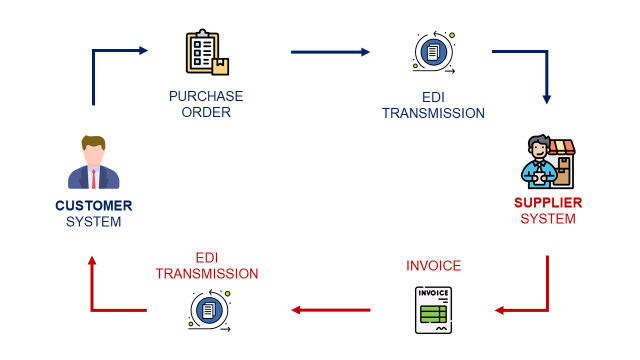
A supply chain is a goal-oriented network of processes and stock points used to deliver goods and services to customers.
After more than six years of experience designing and optimising Supply Chain processes, I noticed a pattern in the type of problems to solve.
They follow a similar structure that aims to maximize (or minimize) an objective function by influencing key parameters while respecting some constraints.
In this article, we will understand how linear programming fits these types of problems with examples that can be implemented quickly.
💌 New articles straight to your inbox for free: Newsletter
I. Introduction to Linear Programming
Mathematical techniques used to get an optimum solution to a problem
II. Requirements & Formulation of LP Problems
Requirements & Formulation
Conditions to apply the Linear Programming methodology
Implementation using Python
Python libraries for LP implementation
III. Methodology
Step 1: Understand the problem
Step 2: Build the model
Step 3: Solving using Python
Conclusion
III. Implement these solutions
Provide Insights
Deploy on the cloud
Share the tool using executable files (.exe)
Introduction to Linear Programming (LP)
Objective
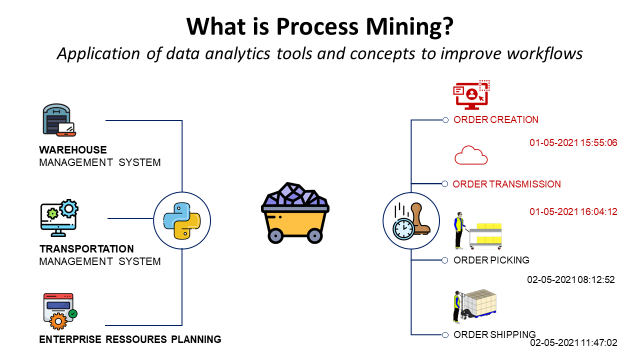
Supply Chain Analytics helps operations make informed and data-driven decisions to improve service levels and reduce costs.
In Operations Research, Linear Programming (LP) is one of the mathematical techniques used to get an optimal solution to a given operational problem, accounting for resource scarcity and external and internal constraints.
I have shared in previous articles some case studies of linear programming for process optimisation
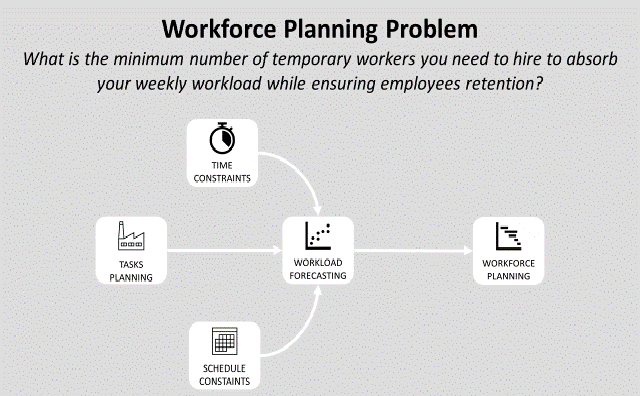
- Optimize Workforce Planning using Linear Programming with Python
- Supply Planning using Linear Programming with Python
In this article, I will explain the methodology I used to address these operational issues using linear programming, with a real operational case study.
If you prefer watching, there is a video version of this article.
Requirements & Formulation of LP Problems
Requirements
To apply Linear Programming for process optimisation, fluctuates these requirements have to be met:
- Problem statement: define the objective in clear mathematical terms
- Decision variables: quantitative input variables impacting the objective
- Constraints: quantitative and measurable conditions
- Objective function: the relationship between the objective and the input variables has to be linear
Formulation
- Decision variables: variables that can be numeric or boolean
- Objective function: a linear function of the variables that we want to minimise or maximise
- Formulate the constraints: a set of equations combining the different decision variables
Methodology
In the case study presented below, we will introduce the methodology using the problem of warehouse fleet management.
My objective is to give you a detailed recipe that can be replicated for other problems.
Step 1: Understand the problem
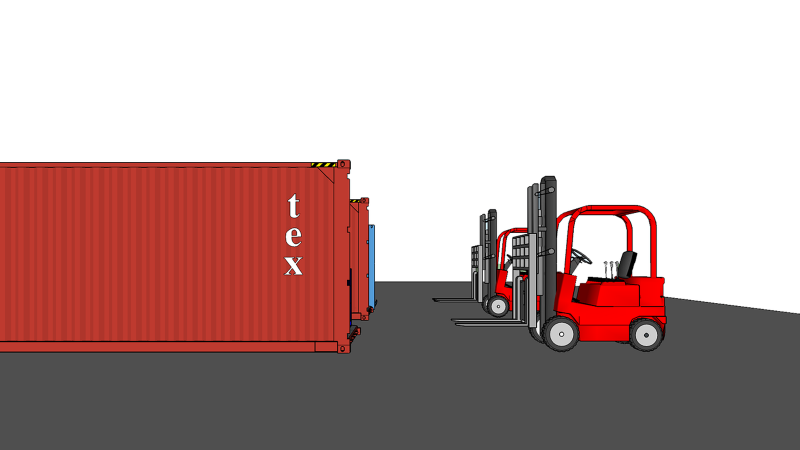
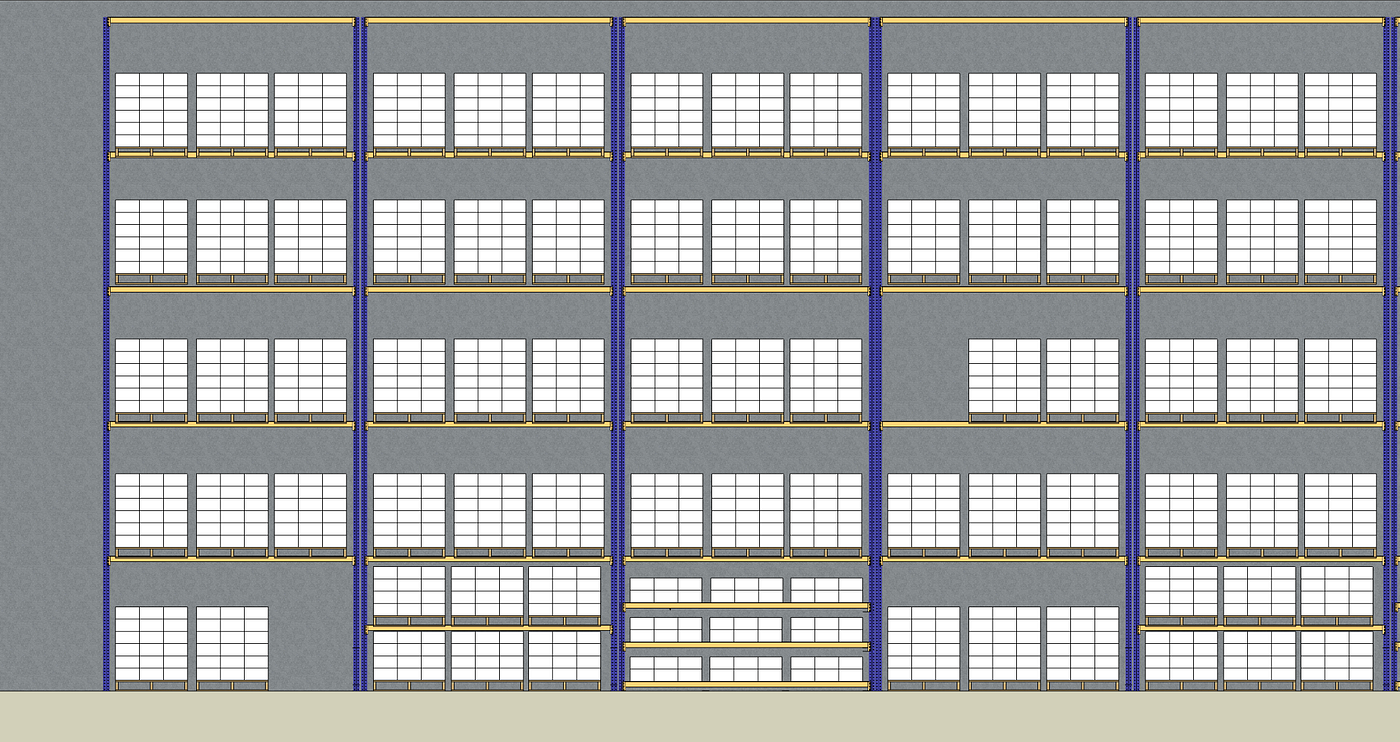
The operations manager of a multi-user warehouse is requesting your support to optimise the management of its fleet of reach trucks.
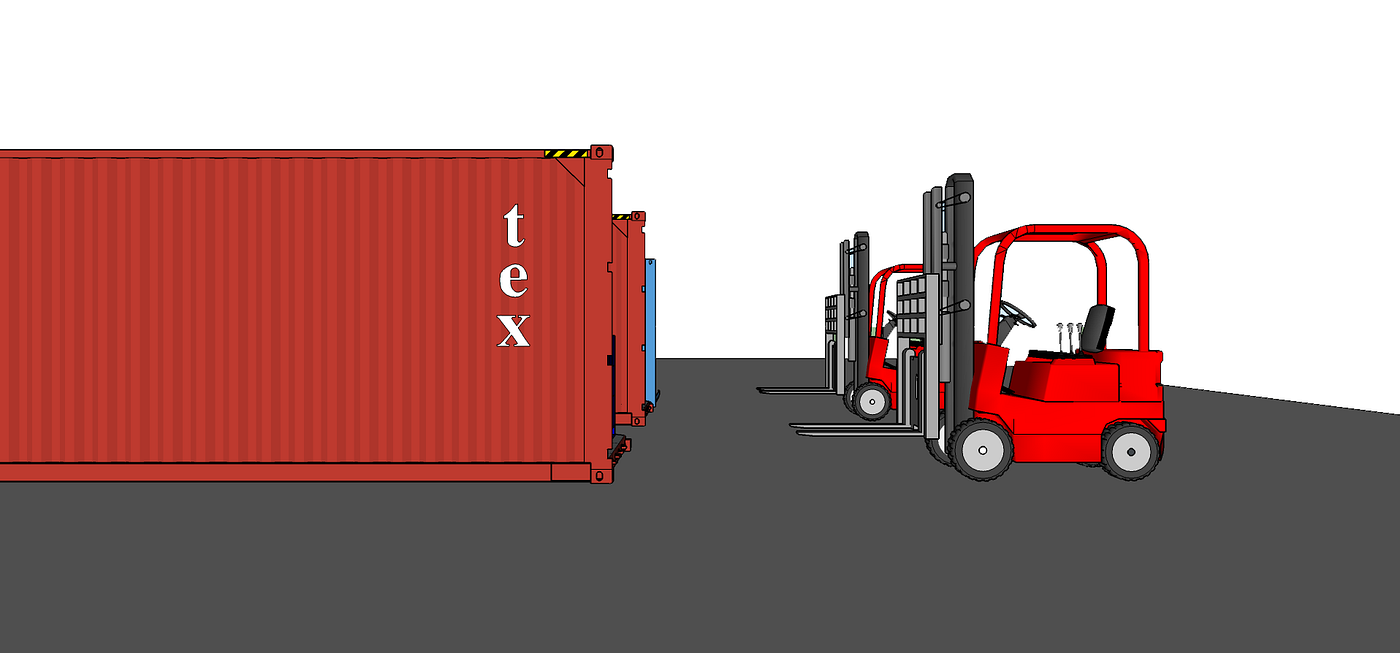
Reach trucks are material handling equipment used in warehouses for multiple applications, such as:
- Truck or container Loading/Unloading
- Pallet transfer inside the warehouse
- Put away: put pallets on racks
- Replenishment: transfer from storage locations to ground locations
Demand
After aligning with the different team leaders, he compiled forecasts of demand for the next five weeks.
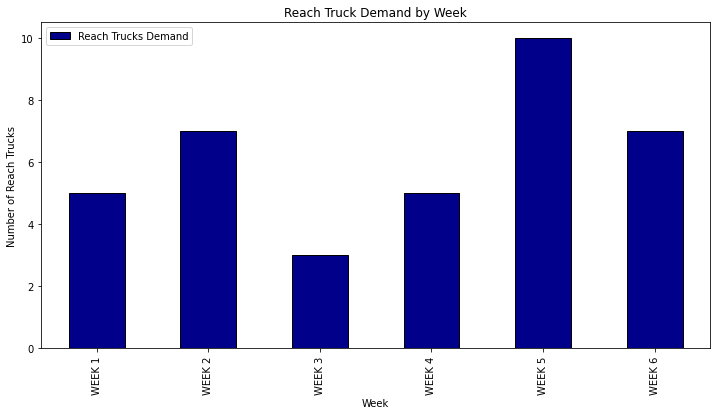
The demand fluctuates from one week to another. Because of budget constraints, you cannot rent 10 trucks for six weeks.
Supply
This type of equipment is usually leased to have more flexibility. You have the choice between several types of trucks:
- Type 1 — Long-term lease trucks: these trucks need to be leased for six weeks at a price of 225 euros/week
- Type 2 — Short-term, lease trucks: these trucks can be leased for one week at a price of 395 euros/week
- Type 3 — Shared trucks: long-term lease trucks shared with another warehouse, only available WEEK 2, WEEK 4 and WEEK 6 at a price of 205 euros/week
- Type 4— Special price: these trucks can be leased for the last three weeks at a discounted price of 200 euros/week, with a maximum order quantity of 2 trucks
These conditions are realistic. Indeed, leasing companies are adapting their offers to reduce the costs for the logistics companies.
At this stage make sure that you have gathered all the information needed to frame the problem.
After data collection and processing, spend some time presenting your vision to the key stakeholders. It’s a good practice to get confirmation that your understanding is correct.
Step 2: Build the model
Problem Statement
The operations manager asked for your support to answer the following question.
How many reach trucks should I rent, for each type, to cover the needs for the next six weeks?
Decision variables
They will be integers because you can only rent full trucks.
types = [Type 1, Type 2, Type 3, Type 4]
Decision variables (integer)
t[1]: number of type 1 trucks
t[2]: number of type 2 trucks rented for the week 1
t[3]: number of type 2 trucks rented for the week 2
t[4]: number of type 2 trucks rented for the week 3
t[5]: number of type 2 trucks rented for the week 4
t[6]: number of type 2 trucks rented for the week 5
t[7]: number of type 2 trucks rented for the week 6
t[8]: number of type 3 trucks
t[9]: number of type 4 trucks
Translate the conditions into mathematical equations
Constraints are not always straightforward.
Therefore, you need to adapt them to fit the LP framework.
Because Type 2 trucks can be rented at any time, we will need to create six variables for the six weeks.
Demand Constraints
The first constraint is at least related to the demand. Each week, you need to ensure that you have enough trucks.
Let me use the example of the first week to explain the process
- We need at least fiveShort-term trucks
- Type 1 trucks can be rented: include t[1] in the equation
- Type 2 trucks can be rented: include t[2] in the equation
- Type 3 trucks cannot be rented: do not include t[8] in the equation
- Type 4 trucks cannot be rented: do not include t[9] in the equation
The final equation after translation of the conditions is: t[1] + t[2] >= 5
(Week 1): t[1] + t[2] >= 5
(Week 2): t[1] + t[3] + t[8] >= 7
(Week 3): t[1] + t[4] >= 3
(Week 4): t[1] + t[5] + t[8] + t[9] >= 5
(Week 5): t[1] + t[6] + t[9] >= 10
(Week 6): t[1] + t[7] + t[8] + t[9] >= 7
Additional constraints
We have a limited supply of Type 4 trucks
Rental price per type
(Type 4): t[4]<=2
Avoid conflicting conditions
At this stage, you need to ensure that the conditions do not conflict.
Objective Function
This is the total rental cost for the six weeks of operations.
Basically, the sum of the number of reach trucks per type multiplied by the unit rental price.
(Type 1): P1 = t[1] * 225 * 6
(Type 2): P2 = Sum ( t[i] * 395, i = 2 ... 7)
(Type 3): P3 = t[8] * 205 * 3
(Type 4): P4 = t[9] * 200 * 3
(Objective): z = P1 + P2 + P3 + P4
Check the linearity
If you intend to use linear programming tools, ensure that this function is linear.
Summarise the LP problem
Given the constraints
(Week 1): t[1] + t[2] >= 5
(Week 2): t[1] + t[3] + t[8] >= 7
(Week 3): t[1] + t[4] >= 3
(Week 4): t[1] + t[5] + t[8] + t[9] >= 5
(Week 5): t[1] + t[6] + t[9] >= 10
(Week 6): t[1] + t[7] + t[8] + t[9] >= 7
(Type 4): t[4]<=2
Present the problem
Use this mathematical presentation of the problem to confirm with operational teams that you understood their request.
Step 3: Solving using Python
The implementation is pretty straightforward using the PuLP library, a Python modelling framework for Linear (LP) and Integer Programming (IP) problems.
You can find in this article a detailed example of implementation
Conclusion
The most important part is the problem statement.
Make sure to gather all necessary information and double-check with operational teams that your understanding of the problem is correct.
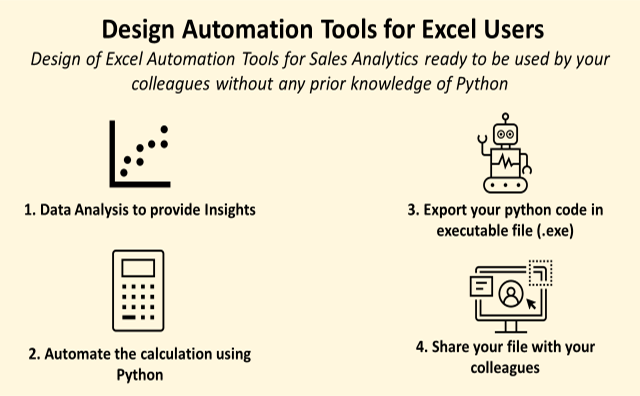
You can embed the script in an executable file that extracts data from an Excel file.
Thus, other colleagues can use your model without installing Python on their computers.
Find an example in this article
About Me
Let’s connect on LinkedIn and Twitter. I am a Supply Chain Engineer who is using data analytics to improve logistics operations and reduce costs.
If you’re looking for tailored consulting solutions to optimise your supply chain and meet sustainability goals, feel free to contact me.