Build Excel Automation Tools with Python
Design of Excel Automation Tools for Sales Analytics ready to be used by your colleagues without any prior knowledge of Python
How many articles have you read stating that “Excel is Dead, long live Python”, “Python is the new Excel” or “Excel became obsolete”?
But when you look around you, in your team or other departments, you can hardly find other colleagues using Python.
And when you mention it, it is seen as a black box that people can’t trust because “it’s too complicated”, “we can’t see formulas” or “I cannot run it on my computer”.
A first step to promoting it would be to give them the possibility of running your scripts on their computers without prior knowledge of Python.
💌 New articles straight to your inbox for free: Newsletter
If you prefer watching, have a look at the video version of this article.
Scenario
You are working as Data Scientist for a major retail company and your colleagues from the Supply Chain team request your support to analyze sales data.
For this example, we will take a dataset from the Kaggle challenge: Store Item Demand Forecasting Challenge.
Data Set
- Transactions from 2013–01–01 to 2017–12–31
- 913,000 Sales Transactions
- 50 unique SKU
- 10 Stores
Objective: Your colleagues would like to build a pivot table of monthly sales by item for each store.
Issue: With nearly 1 million records, your colleagues are reaching the limits of Excel. Therefore, they ask for the support of the Data Scientist to find a magic solution.
Solution
We will design a Python script to perform data processing, create the pivot table and export the results in an Excel file.
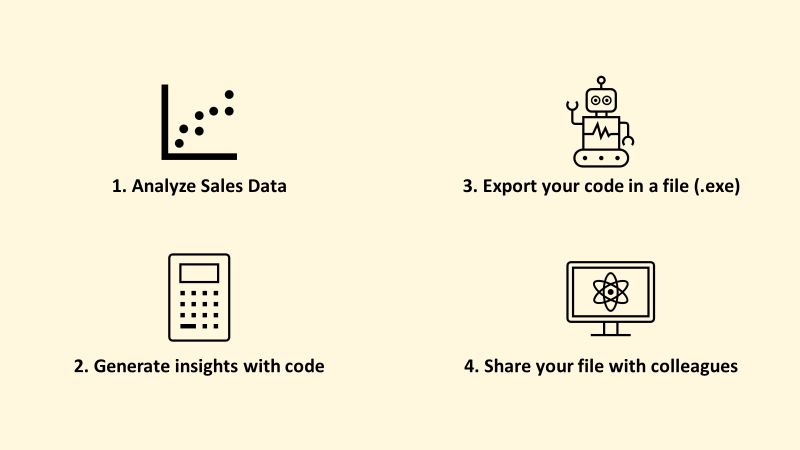
Your script is performing the following tasks:
- Import initial raw data from Kaggle Challenge (sales_data.csv)
- Date Formatting
- Pivot Table of Sales by Month for each pair Store, Item
- Sorting records by Store and Item
- Saving the final report in an Excel file
Share this script using an executable file (.exe)
Objective: Create an executable (.exe) that will run your script and can be used without having Python installed on your computer.
New Python Library in your toolbox: Pyinstaller
PyInstaller bundles a Python application and all its dependencies into a single package. The user can run the packaged app without installing a Python interpreter or any modules.
Step 1: Install Pyinstaller
Step 2: Save your Python script in the current directory
Save it in the same directory where you have put your sales records initial file (sales_data.csv). Name your file: “pivot.py”
Step 3: Create your executable file using PyInstaller
Enter the following command in your command prompt
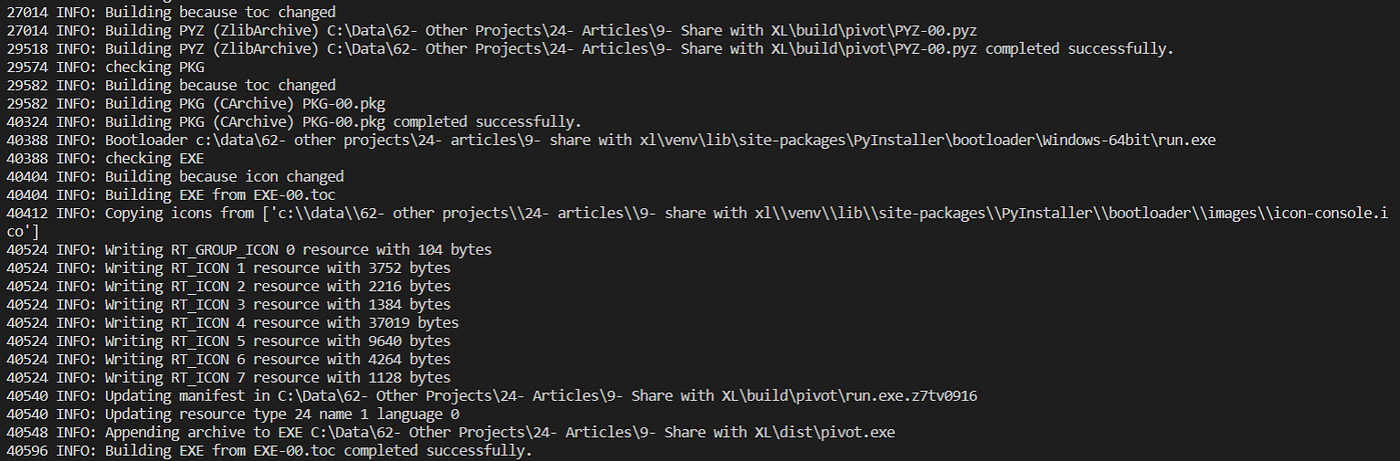
When the process is completed you will see this message “Building EXE from EXE-00.toc completed successfully.” and your (.exe) fill will pop in a folder called “Build”.
Step 4: Use your executable file
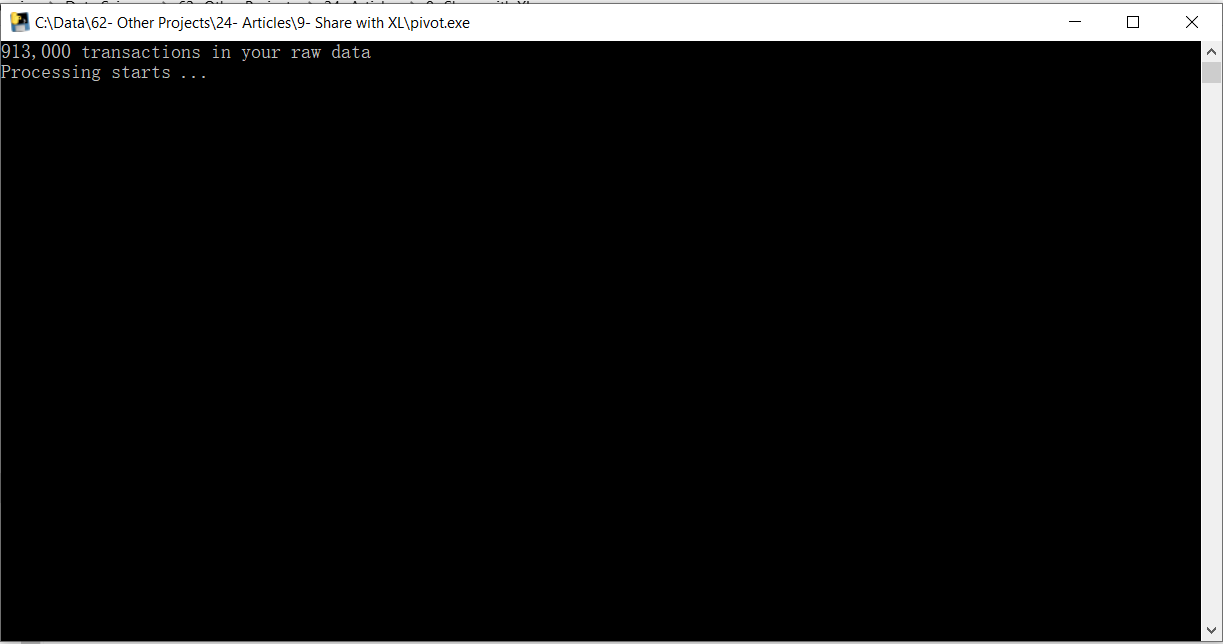
Ask your colleagues to cut and paste this (.exe) file into a folder containing the initial raw data, then click to start the script.
They can follow the process thanks to the "print messages" put at each step of the script.
Result: At the end of the process, they can find your sales report (sales_report.xlsx) saved in your folder.
Conclusion
You have now a tool to share your work with other colleagues and build tools that will impact your company’s productivity and support people to automate boring tasks.
This can be coupled with cool visualisation using seaborn, connections to external APIs to fetch data, a machine learning model to predict future sales, or anything else that could add value to your calculations.
About Me
Let’s connect on LinkedIn and Twitter, I am a Supply Chain Engineer that is using data analytics to improve logistics operations and reduce costs.
If you’re looking for tailored consulting solutions to optimize your supply chain and meet sustainability goals, please contact me.