Projects
Discover projects that I deployed to solve operational or business issues using data science, workflow automation, or generative AI.
The best way to provide value is to deploy products that can impact people and businesses.
Improve your skills with the Supply Science App
If you are lost among all the content available and want to improve your skills in Supply Chain Analytics, AI, or Business Planning.
We have created the Supply Science App with my brother for our audience on this blog and YouTube.
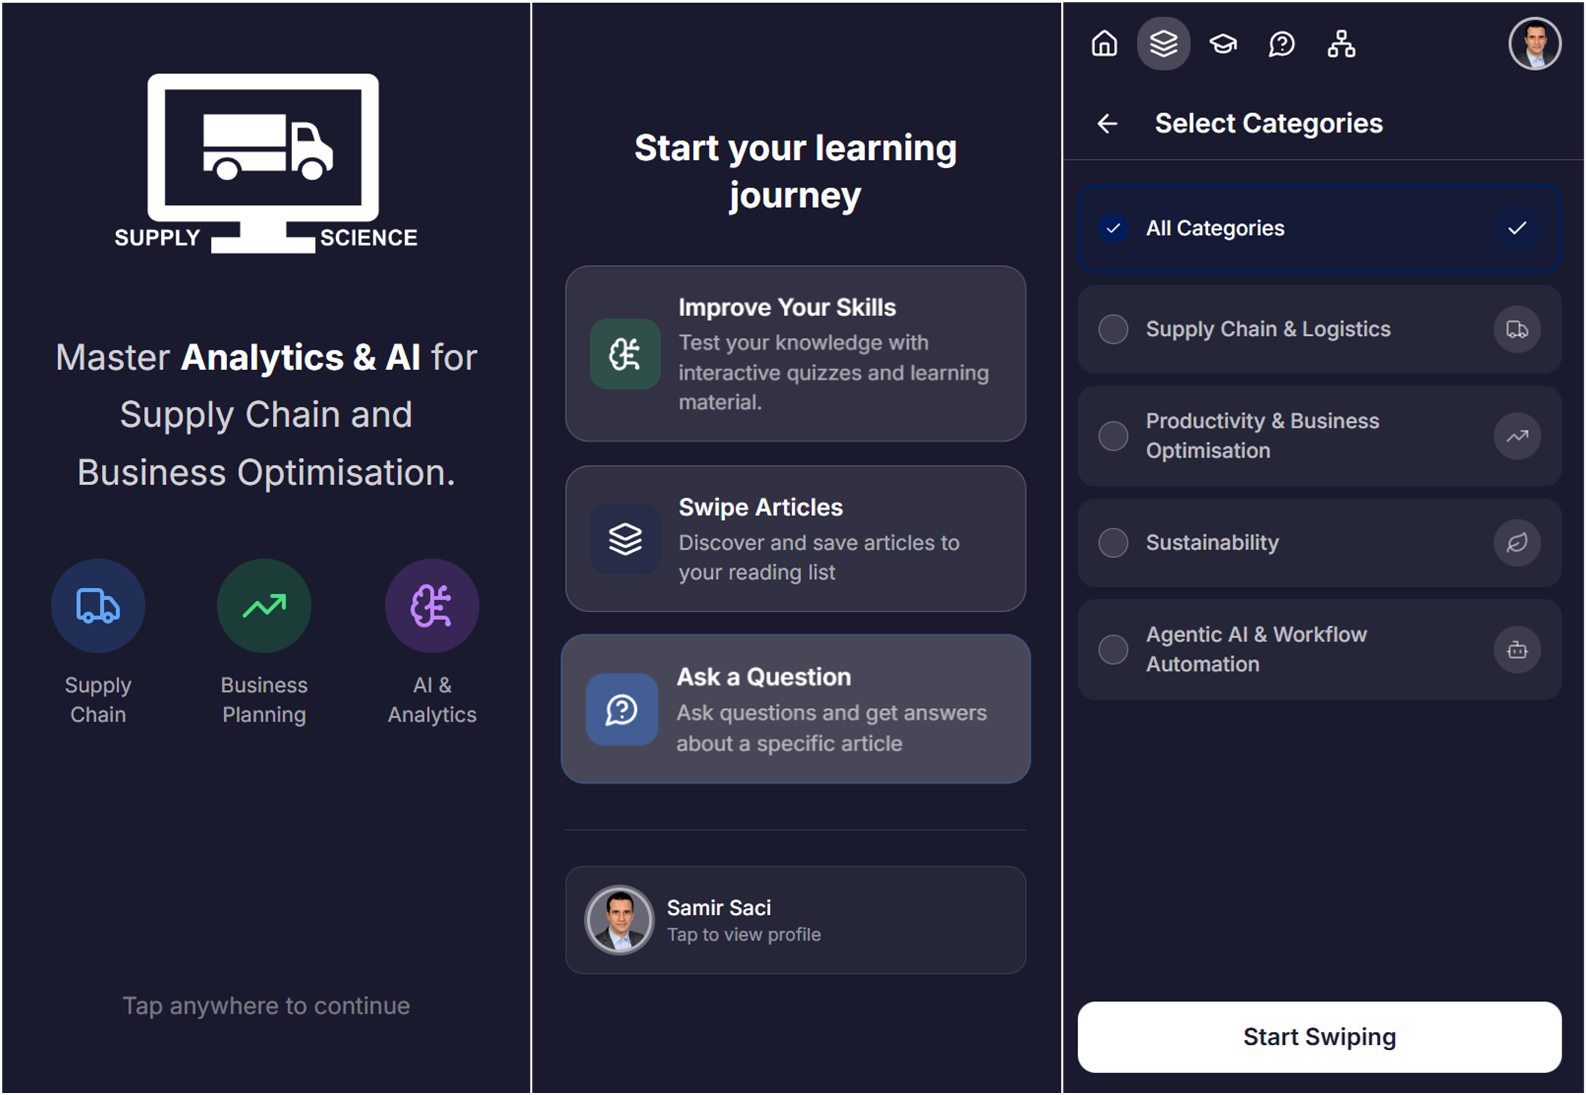
We centralise all the content available in the blog and my YouTube Channel, Supply Science, in a single app where you can:
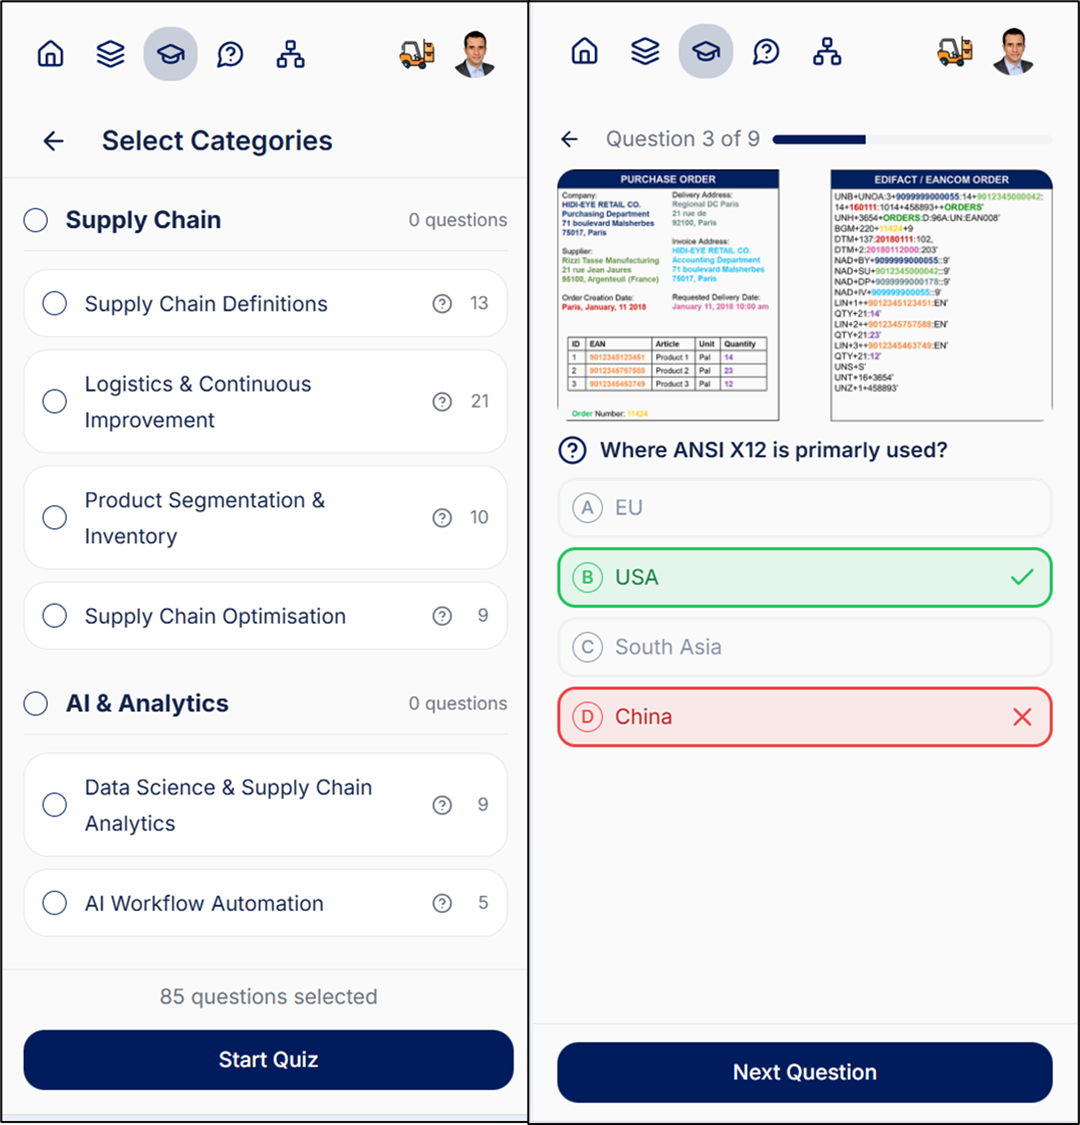
- Improve Your Skills with quizzes and a learning path adapted to the topic you are interested in
- Ask a Question about any article published here
- Join a Discord Community we just opened
You can access it for free, you just need to sign in with your GMAIL or Linkedin account.
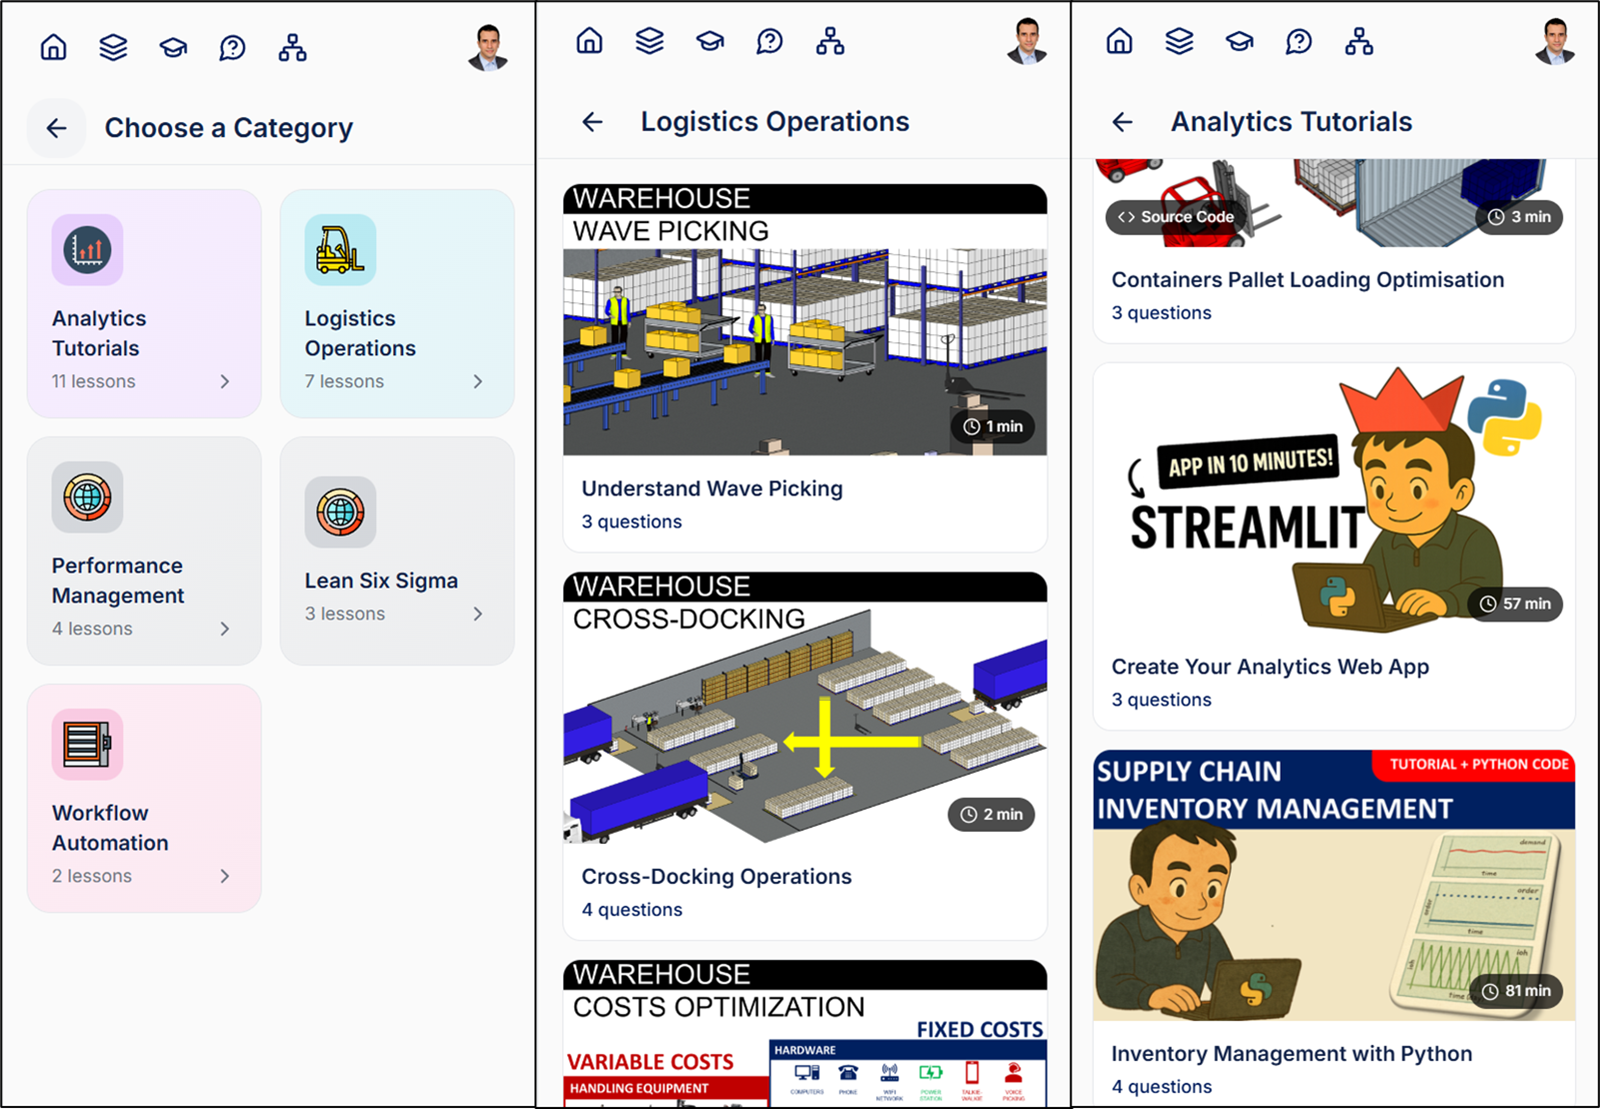
Let's imagine you want to learn about Data Science & Analytics, you will have:
- More than 11 lessons (I will add more) to practise with actual case studies
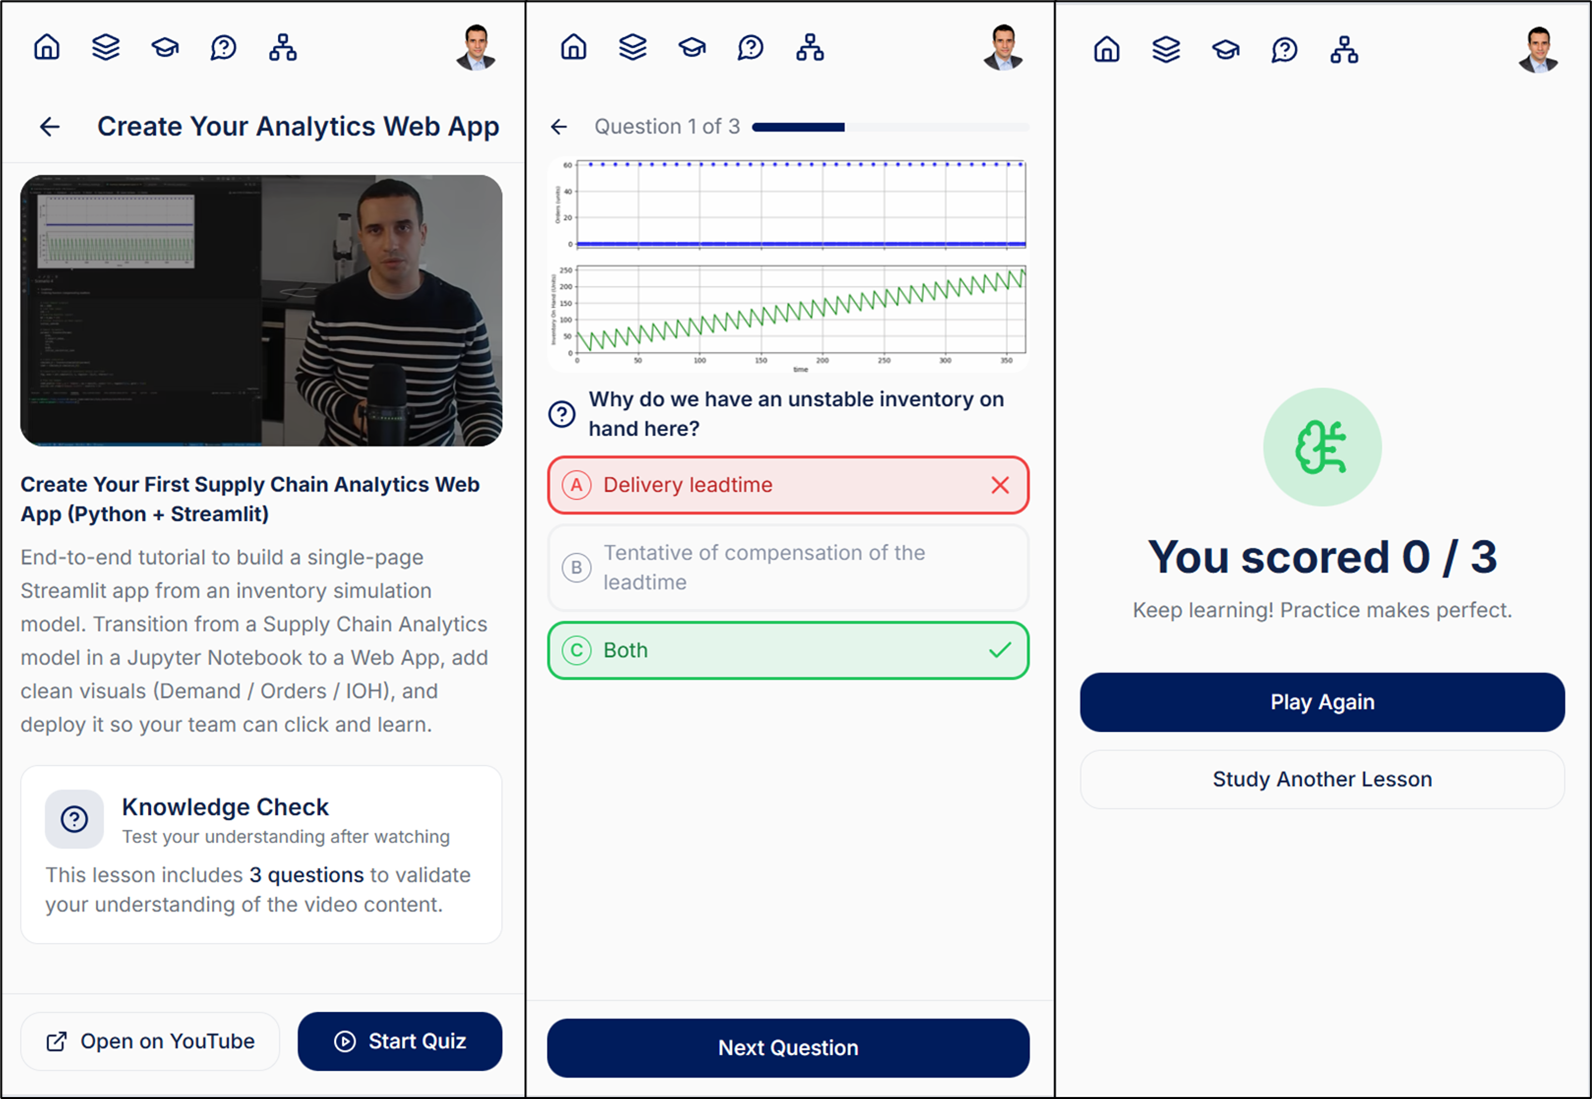
- A quiz for each lesson to test your knowledge
At the end of the quiz, you get your score.
How to start?
I propose that you test your skills with our Fundamentals Quiz.
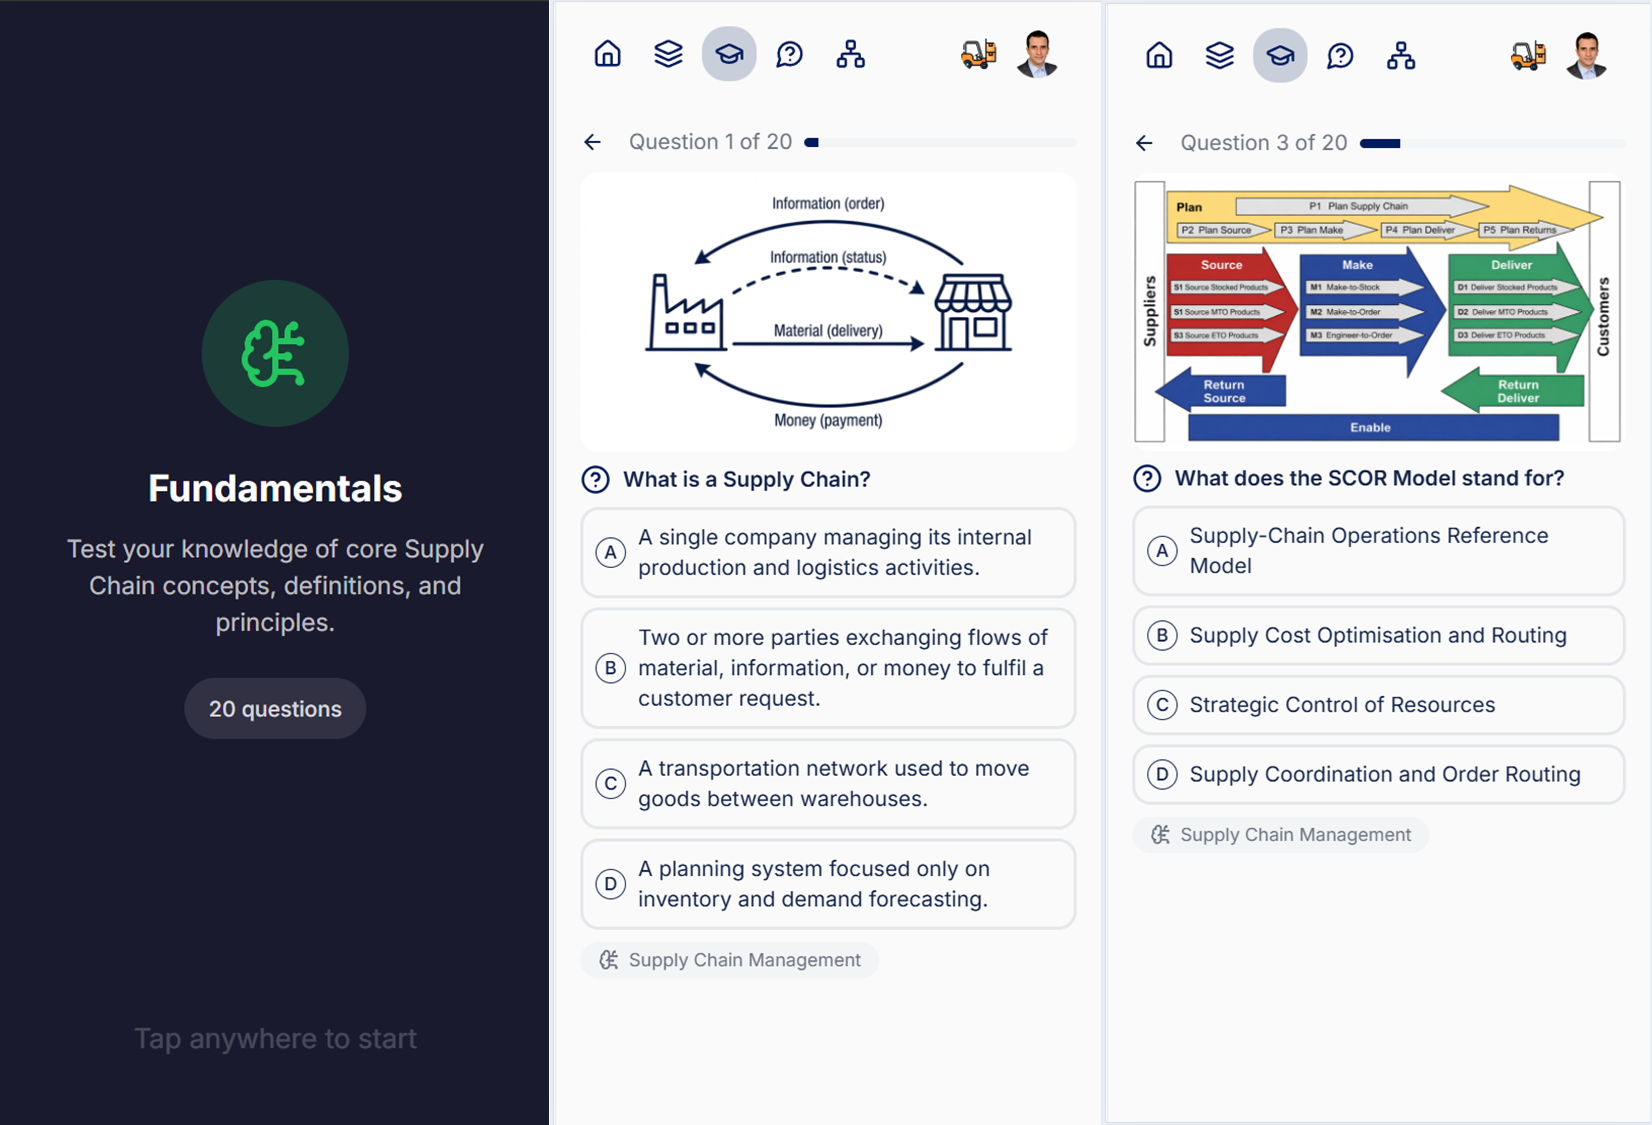
These are 20 questions I drew from various sources in the supply chain literature and from my experience working in logistics and supply chain departments.
- Try it now: Fundamentals Quiz
After finishing this one, you can access 10+ to test your knowledge on multiple topics.
What else?
A last feature is for the readers who may have questions about a specific topic.
Because there is no comment section here, readers DM me on LinkedIn or Twitter to question me about a specific topic.
As I receive many messages, I do not always have the time to find your message.
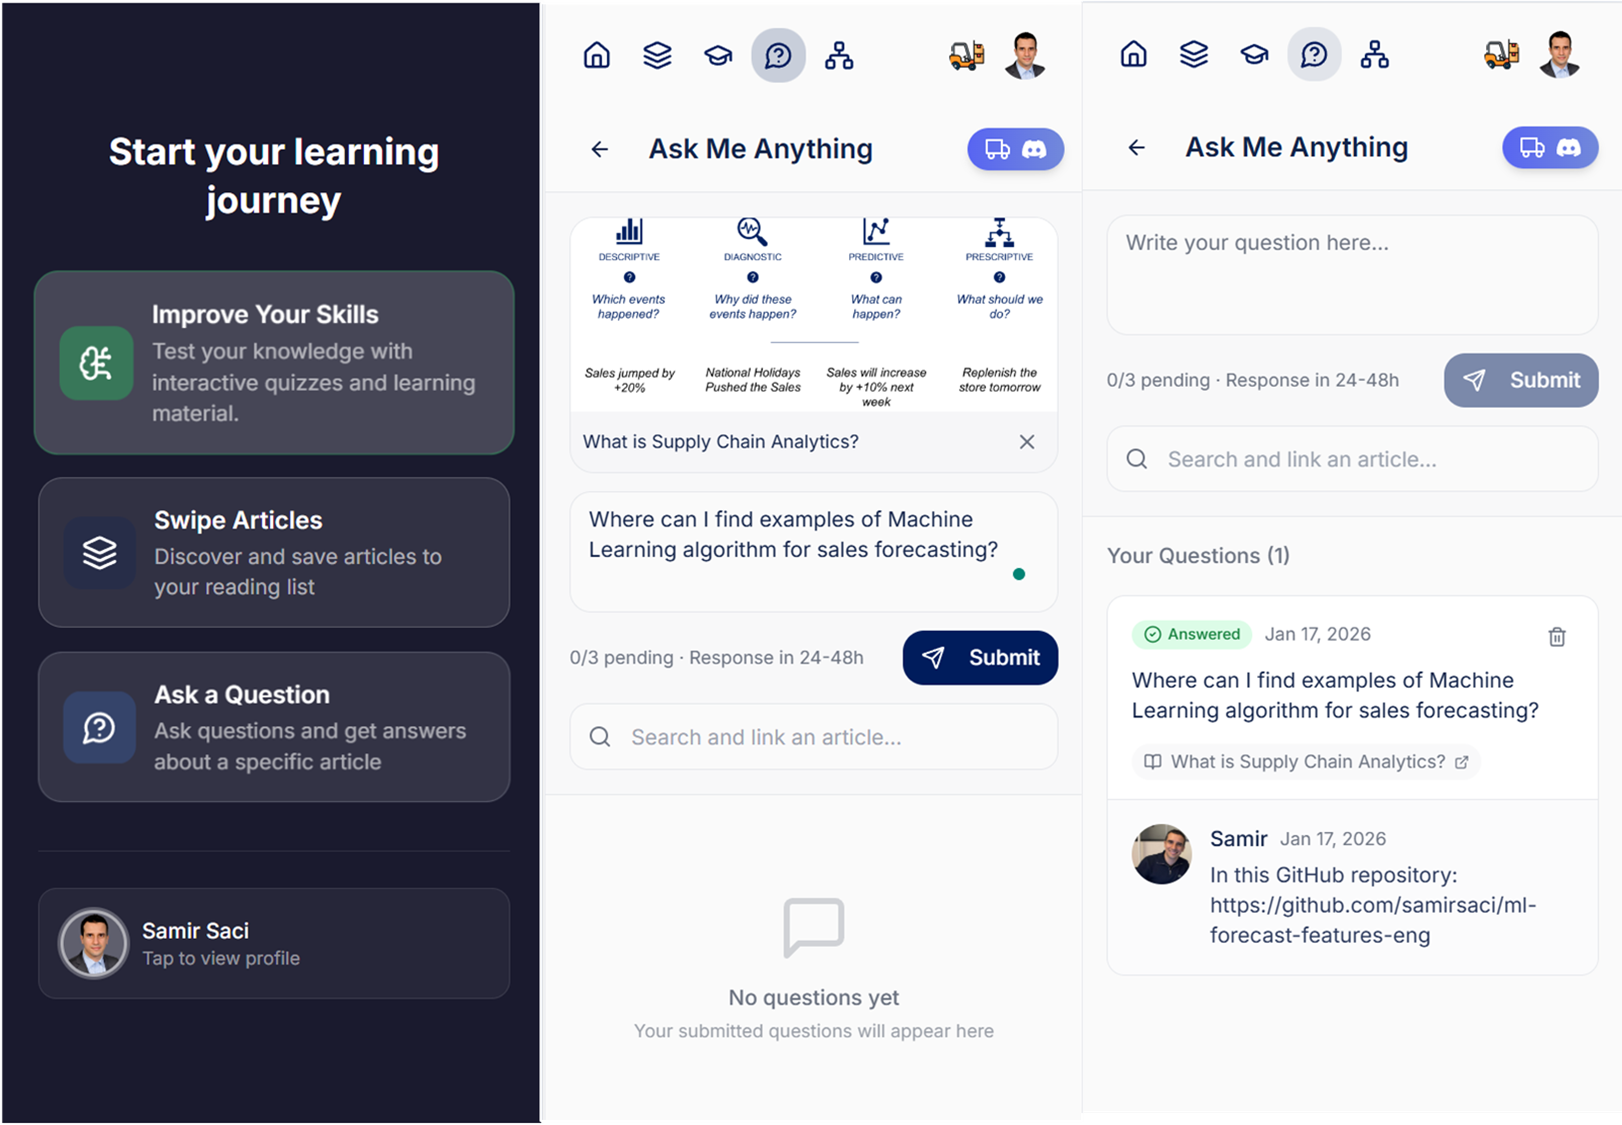
With this feature, I will receive a notification on my Discord server, which you can join via the icon on the top right, and I will try to answer.
See you there!
Try the Supply Chain Optimisation Apps!
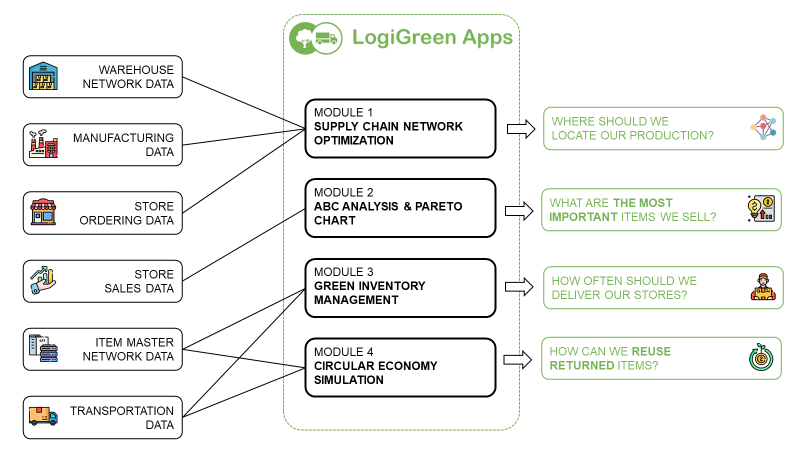
This is a super app with multiple modules.
Most of them are linked to case studies presented in this blog.
They are grouped by category
You can try the modules using our demo version:
This is a good occasion for you to test the solutions introduced in the articles with your own parameters and scenarios.
What about
Discover the AI Apps for the Operational Teams
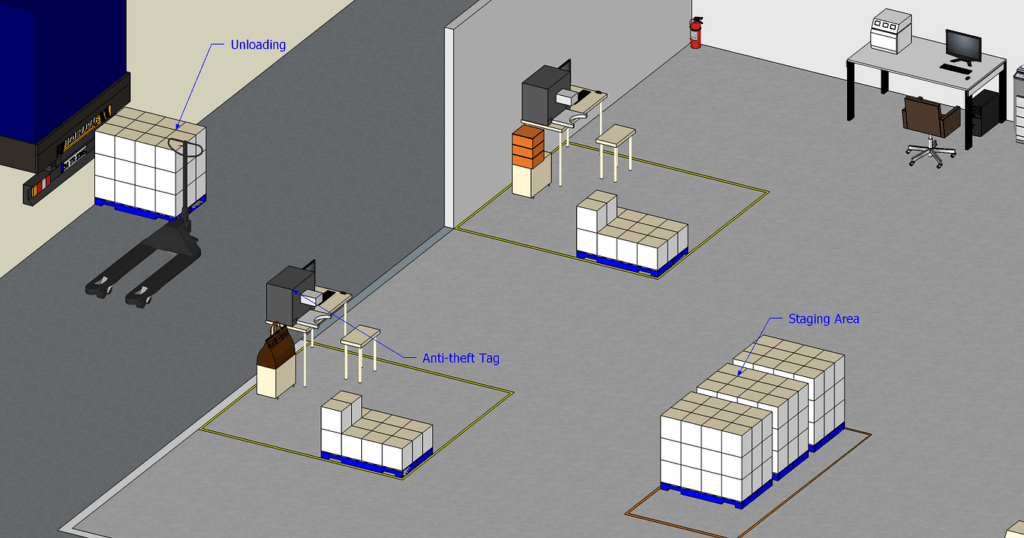
Unlike the Supply Chain Optimisation Apps, these are a set of solutions to solve local issues with AI-powered digitalisation of processes.
LogiGreen AI Apps is a suite of lightweight, mobile-first tools designed to solve everyday operational problems in logistics and supply chain management.
Made by continuous improvement engineers to support operational teams.
The idea is to fill the gaps where enterprise software falls short:
- Digitalisation of manual processes: cycle count, order preparation, repacking
- Automate reporting for operators: Proof of Delivery, Damage Report
These tools leverage multimodal AI models with voice recognition, image analysis, and natural language processing in a single app designed for operators in warehouses, factories, and trucks.
Warehouse Damage Reports Generated with AI
In a warehouse, receiving damaged goods can quickly become a nightmare.
Because receiving can become a bottleneck for your distribution team, inbound operations teams are under significant pressure.
When they receive damaged goods, the whole machine has to stop to follow a specific process:
- Damages have to be reported with detailed information
- Operators need to attach pictures of the damaged goods
For operators that have high productivity targets (boxes received per hour), this administrative charge can quickly become unmanageable.
With the app, it can be done in less than 30 seconds:
- The operator starts by uploading the picture of the damaged pallet.
- The operator scans the bar code and clicks on
Generate Report - The app confirms the report generation
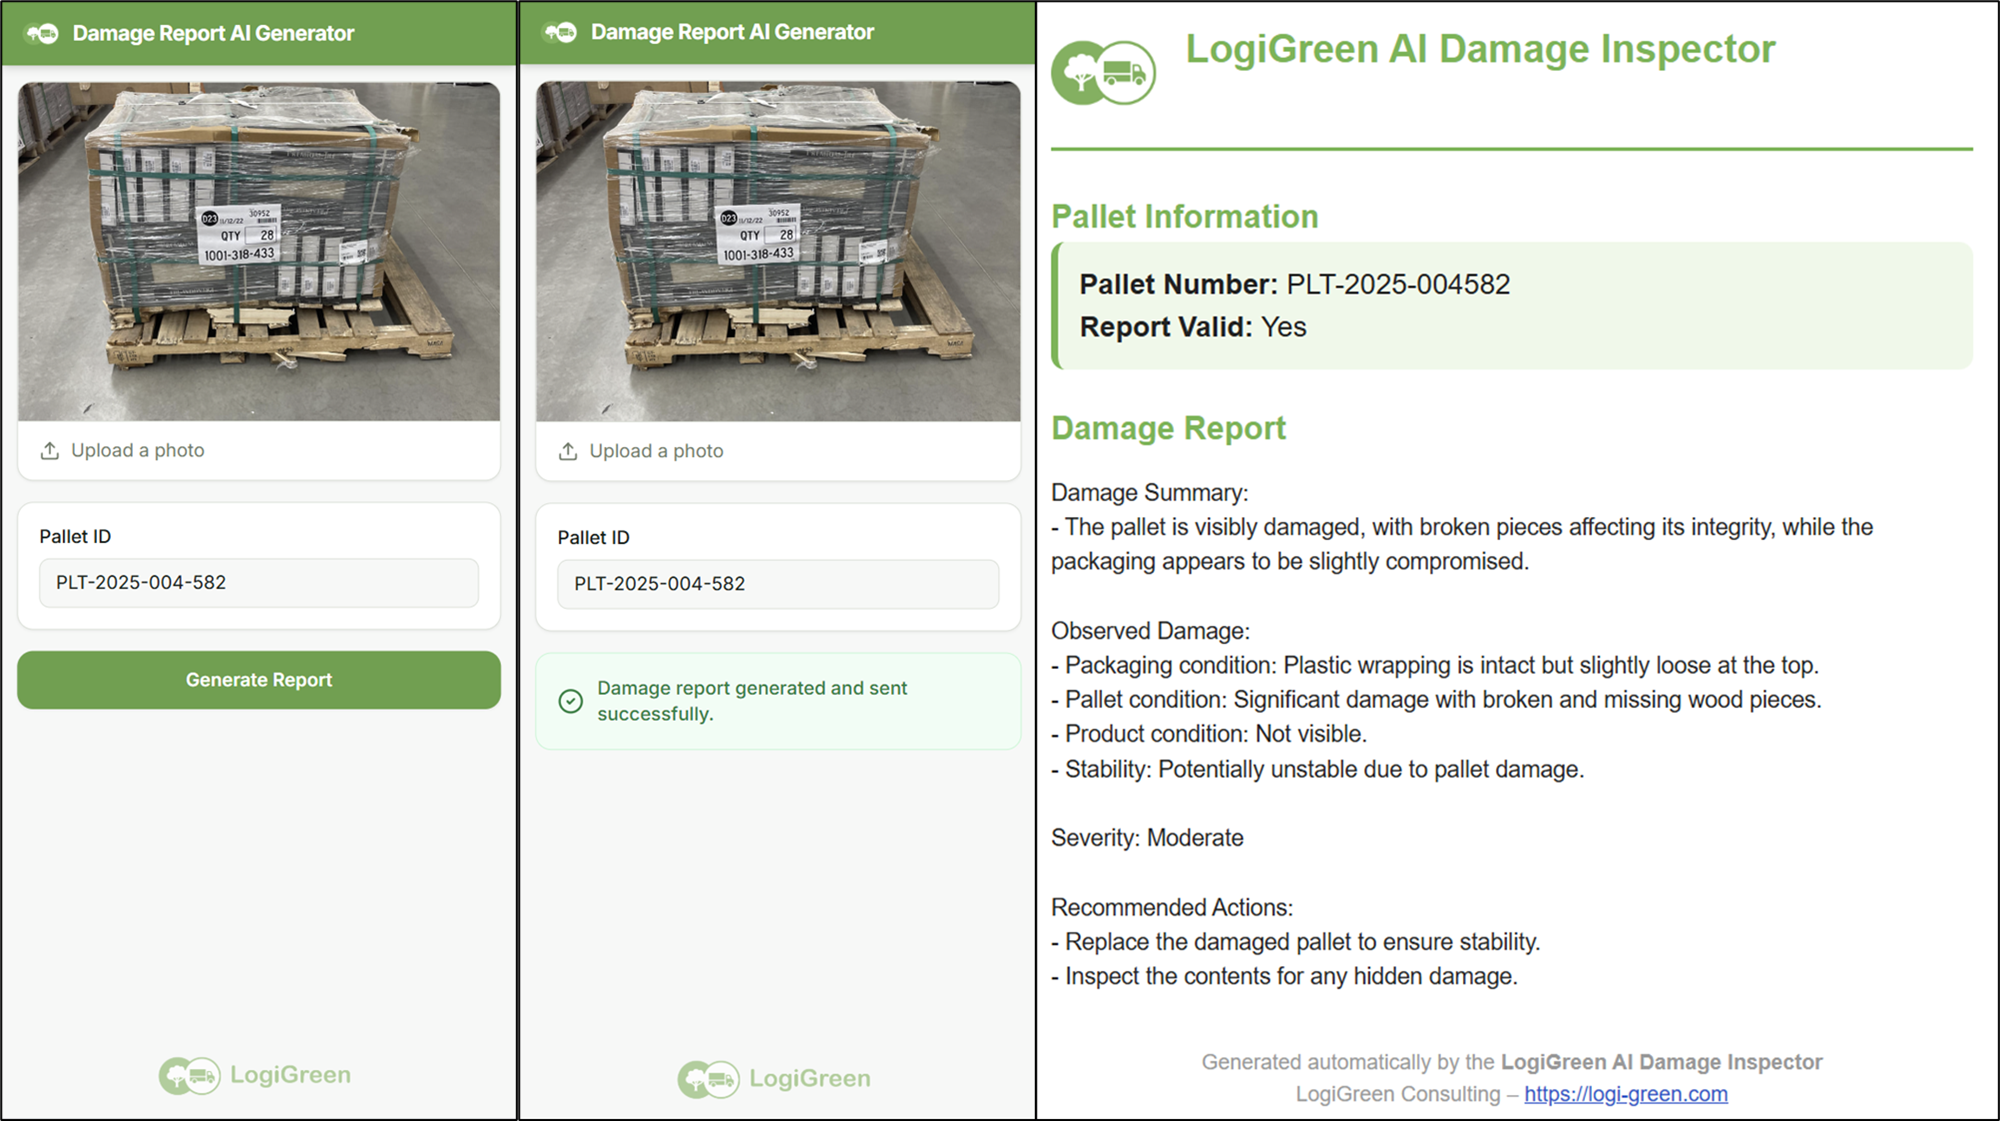
The quality team receives a comprehensive description of the damages with key information related to the damaged goods.
Vocalisation of Inventory Cycle Count
I saw many teams conducting inventory cycle counts using spreadsheets.
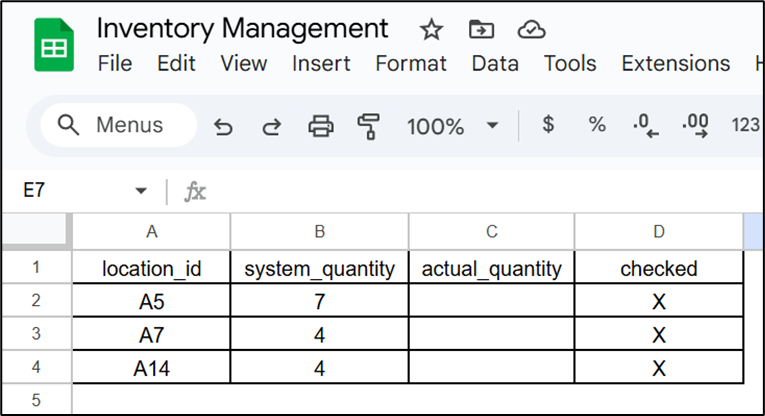
They print them, and counters go to each location to compare the system quantity with the actual one.
We can replace these printed sheets with the inventory cycle count app.
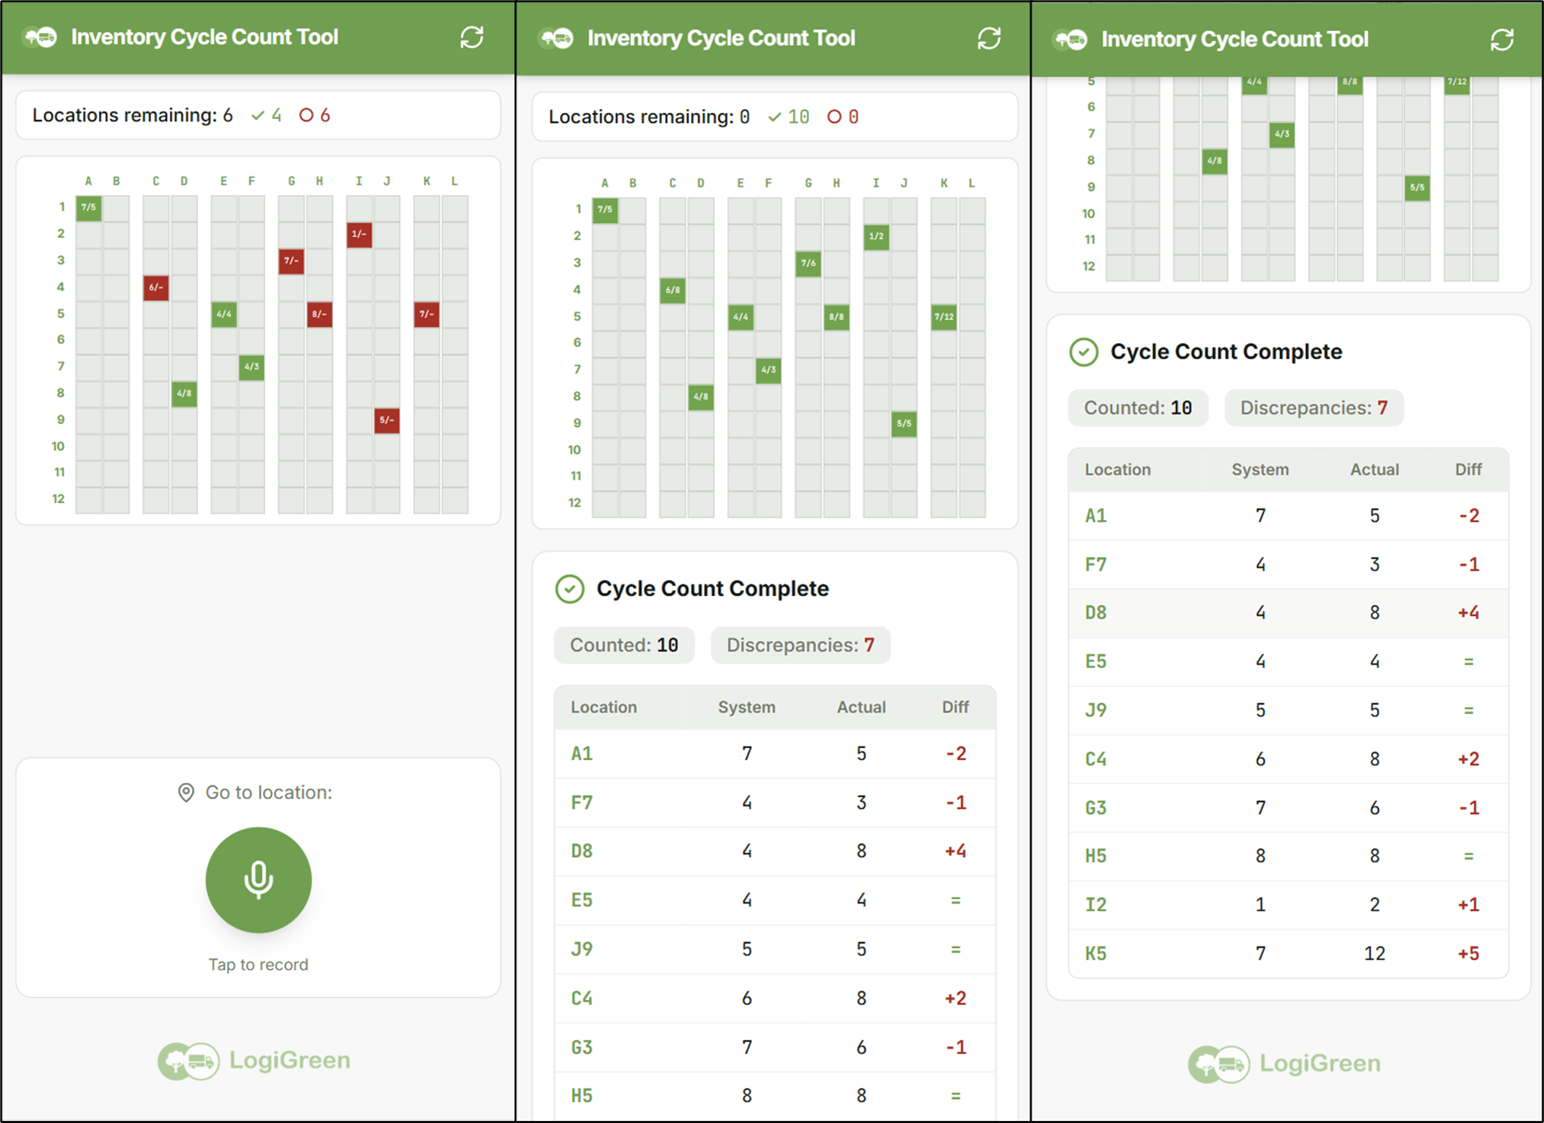
The app guides the operators across the warehouse to check the right locations and records the information (Example: "Location K5, 12 units) using the voice recognition connected to the audio input.
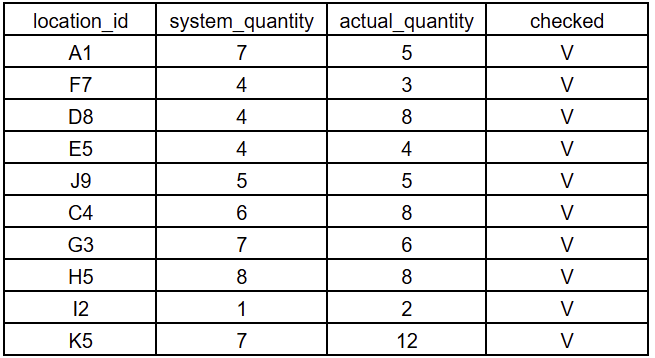
The operator does not need to print anything; the input is done by voice.
Try it now!
Here is a demo version: Demo