📈 Interactive Visualization using D3.js
💬
Examples of visualization built using the javascript library D3.js
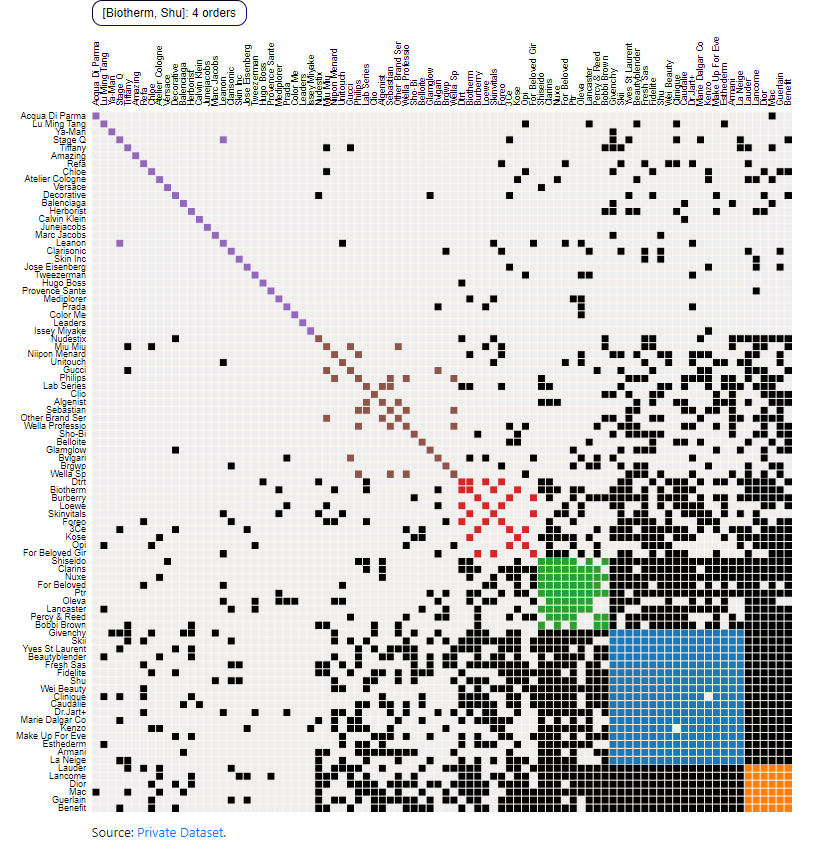
Luxury Brands E-Commerce Sales Matrix
💡
Smart visuals using matrix charts of cosmetics sales with color coding to understand customer behavior
📉 Access the Visual
You can access the visual here: link
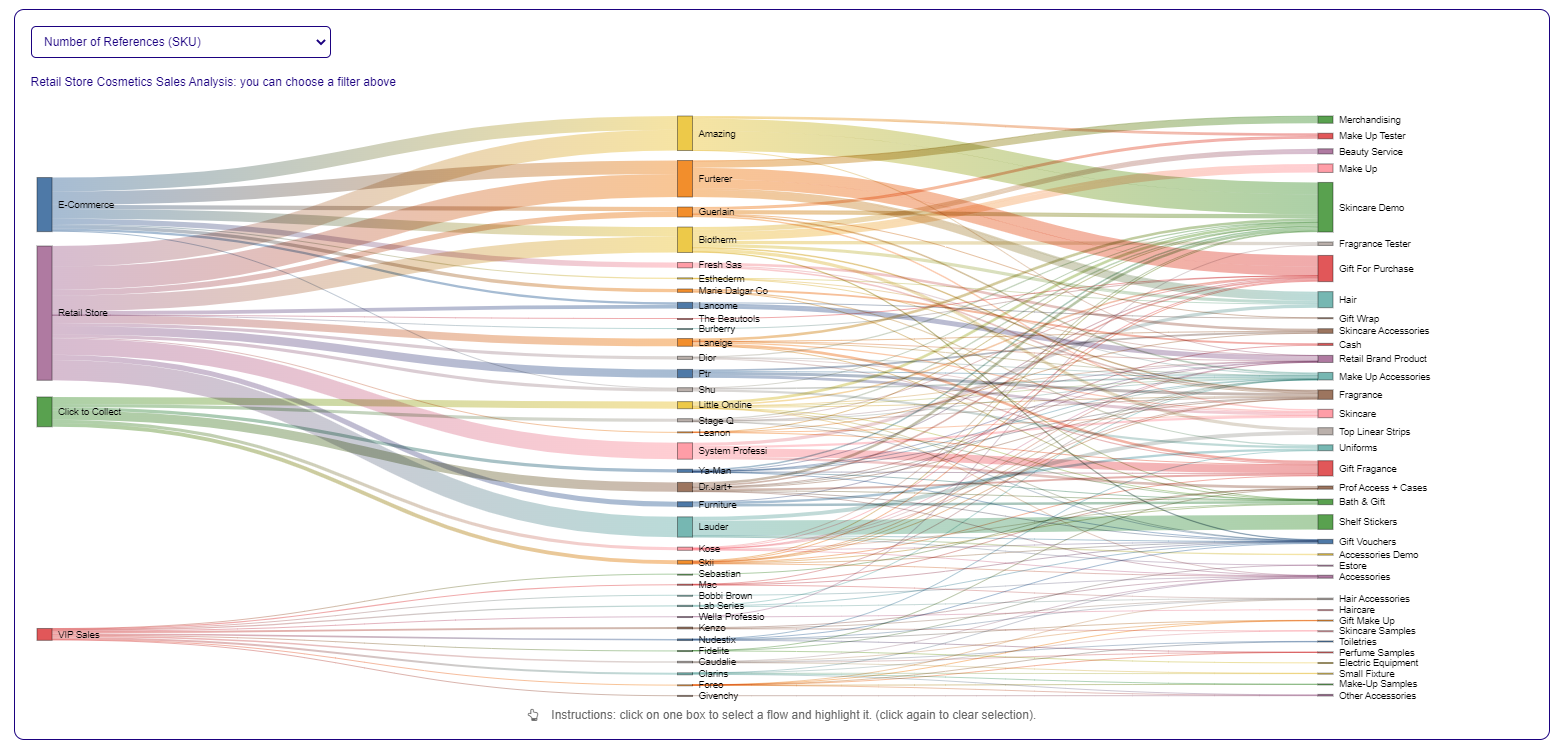
Cosmetics Product Sales Sankey Chart
💡
Analyze cosmetics sales using a responsive Sankey Chart by sales channel, brand or category
📉 Access the Visual
You can access the application here: link
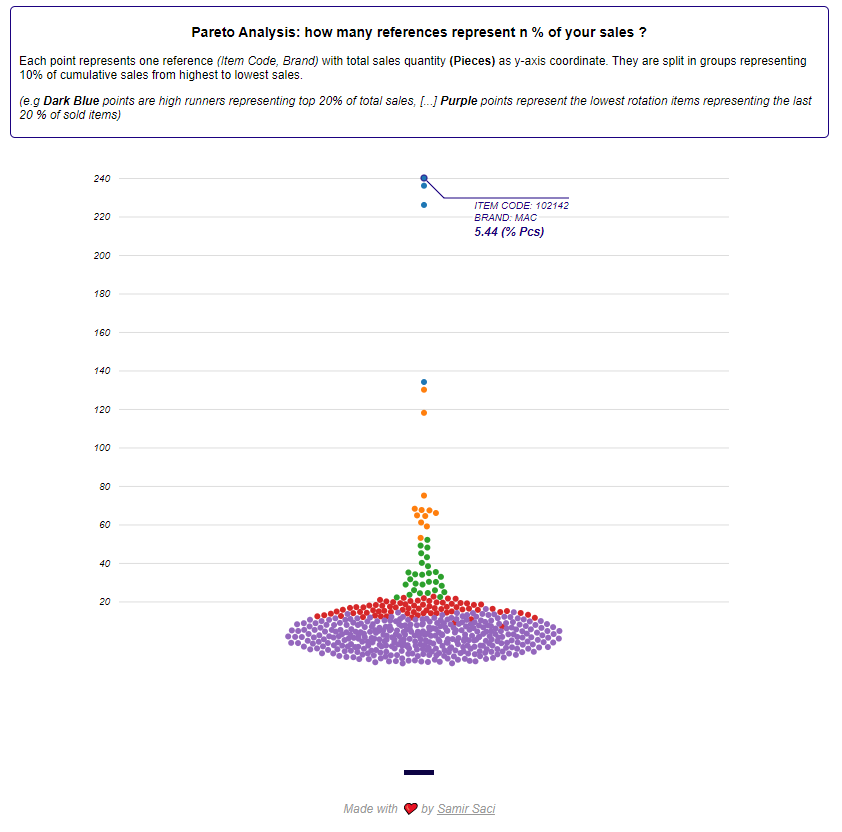
Violin Plot Chart for Pareto Analysis
💡
Pareto analysis of sales by item using violin plot and color mapping
📉 Access the Visual
You can access the visual here: link
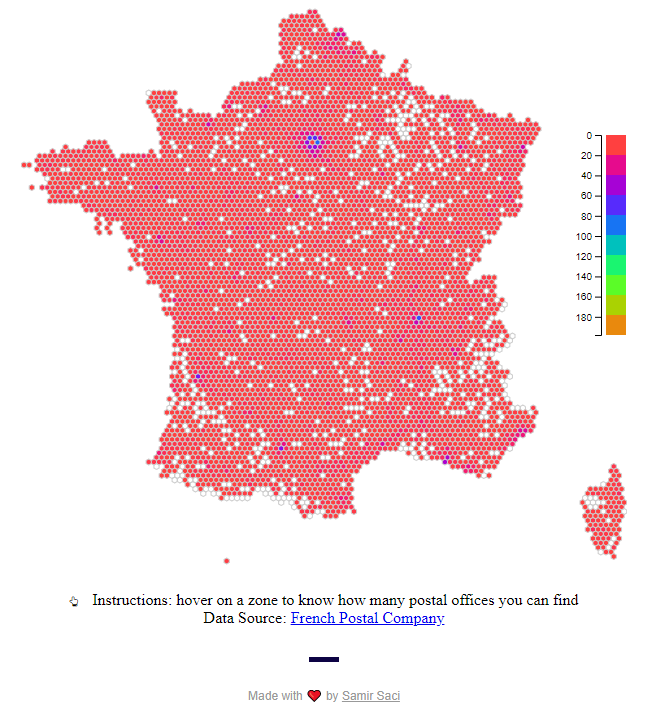
Post Offices in France
💡
France map divided in hexagons to measure the density of Post Offices per zone
📉 Access the Visual
You can access the visual here: link