
Automate Excel Reports with Python: The Four Patterns That Cover Most of the Work
Four patterns to automate the Excel reports an operations team rebuilds every week, from a double-click executable to a report that emails itself on Monday, with code for each.
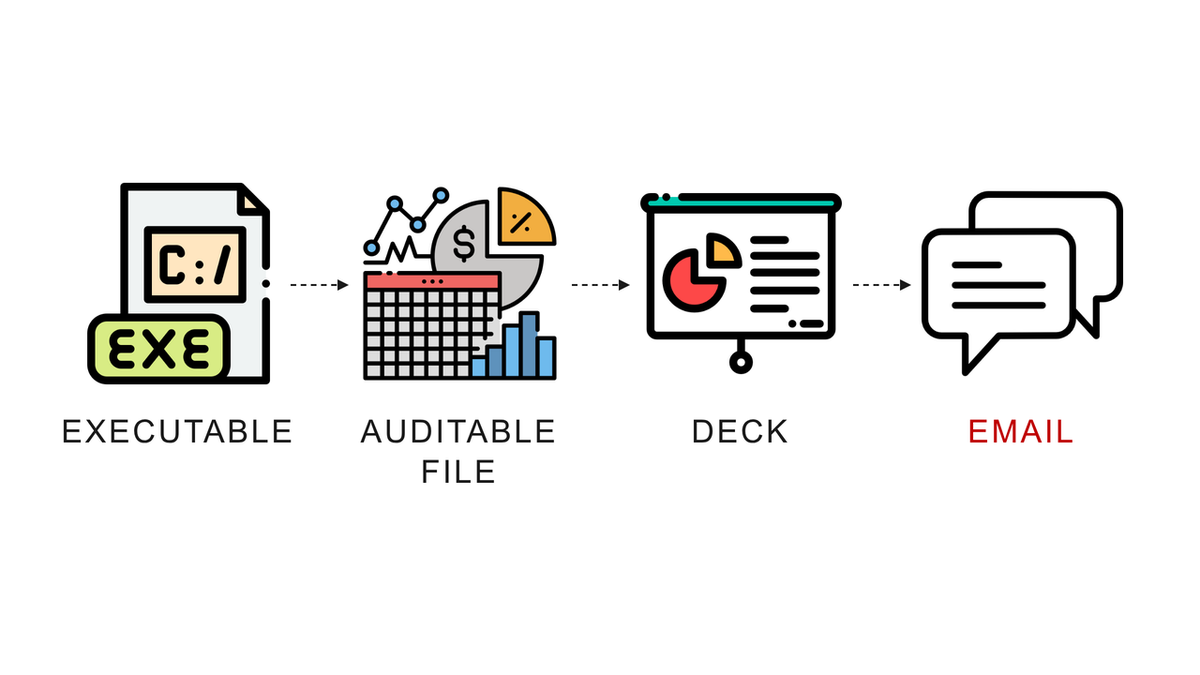
Most of the reporting in a supply chain operation is the same Excel file rebuilt by hand every week, from the same extracts, by the same person.
A warehouse workload report, a monthly sales pivot, a set of slides for the Monday meeting, a KPI email: each one is an extract from the warehouse system, a few transformations, a few charts, and a distribution list.
That work is repetitive by definition, which makes it the easiest thing in the operation to automate, and the fastest way for an analyst to be noticed.
I automated my first one in 2020 for a warehouse in Asia, and everything I have built since fits one of four patterns.
In this article, I will explain the four patterns for automating Excel reports with Python, when each one applies, and the case study with the code for each.
The scenario: a continuous improvement engineer's Friday
You are a continuous improvement engineer at a fashion retailer's distribution centre, responsible for performance reporting.
Every week you connect to the systems, extract the order lines from the warehouse management system, process them in Excel, and build the operational dashboards the managers read on Monday.
The dataset behind one of those reports is 913,000 sales transactions over five years, across 50 references and 10 stores, and your colleagues want a pivot of monthly sales per store and item.
With nearly a million rows, Excel is already at its limit, and the report takes most of a Friday.
Pattern 1: the script your colleagues can double-click
The first pattern replaces the manual processing with a Python script, and solves the problem of colleagues who do not have Python.
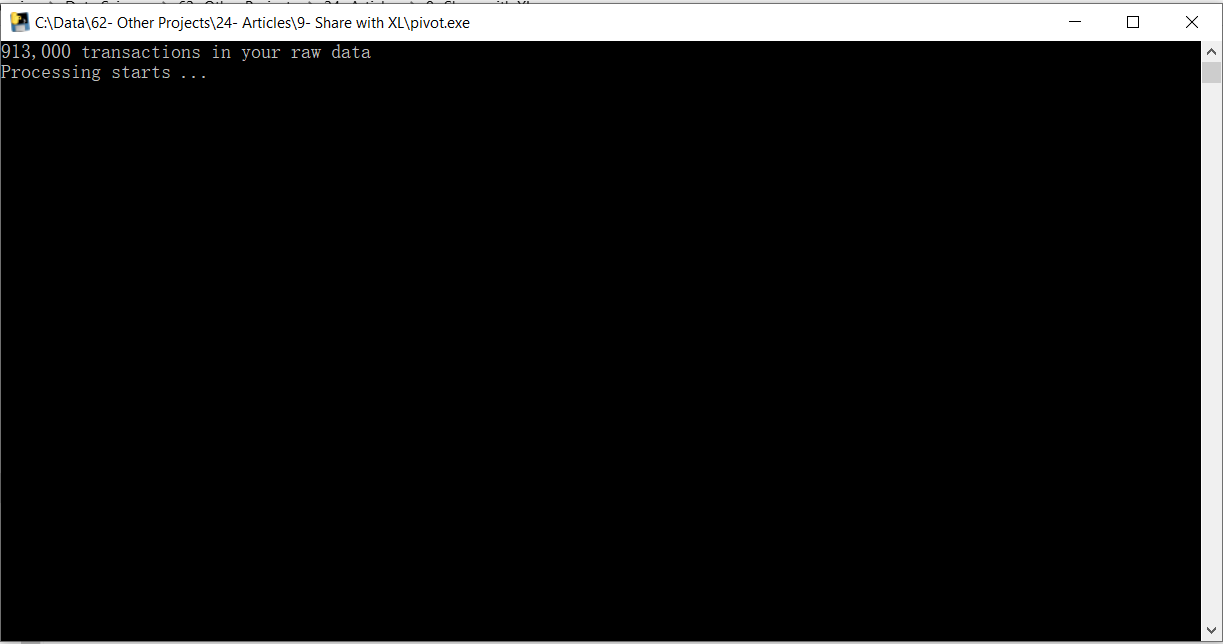
The script imports the raw file with pandas, builds the pivot of sales by month for each store and item, sorts the records, and writes the result to a new Excel file.
Then PyInstaller turns it into an executable, and the colleague copies the file into the folder with the raw data and double-clicks it.
When it applies: the input is a file, the output is a file, and the person who needs it has no Python.
The case study: build Excel automation tools with Python, with the script and the packaging steps.
Pattern 2: the report that keeps its formulas
The first pattern has a failure mode: a user with no programming skills receives a file of hard values, cannot see how a number was computed, and stops trusting it.
The second pattern writes the report with XlsxWriter so that the calculations live in the Excel cells as formulas, and the user can click a total and see the sum behind it.
Python still does the extraction and the layout, and Excel does the arithmetic the user can inspect, which is the user-friendly reporting approach I switched to after the first version was rejected in acceptance testing.
A report the user cannot audit is a report the user will rebuild by hand.
When it applies: the user opens the file in Excel and expects to work in it, not just read it.
Pattern 3: the slides for Monday morning
Half of the reports an operation produces are never opened as spreadsheets, they are opened as slides in a meeting.
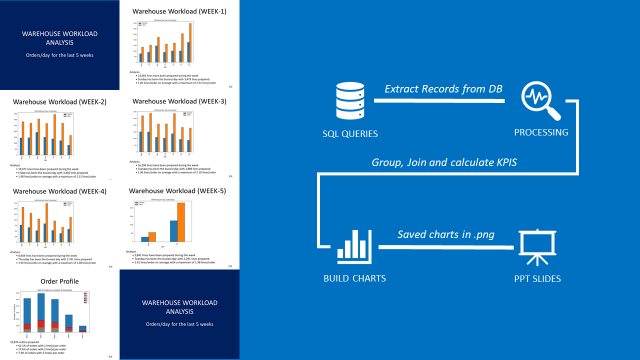
The third pattern skips Excel as the output: Python extracts the order lines, computes the lines per order and the daily volumes, draws the bar charts and the stacked bar plots, and writes them into a PowerPoint deck with python-pptx.
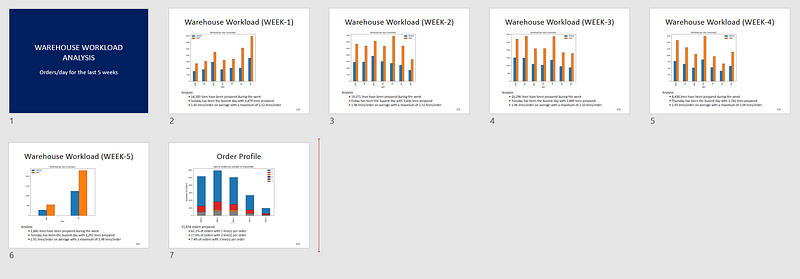
The PowerPoint automation case study produces a seven-slide deck from the warehouse extract, and it is still the most read tutorial on this blog six years later, because every operation has that Monday meeting.
When it applies: the report's real destination is a meeting, and the chart matters more than the table.
Pattern 4: the report that sends itself
The three patterns above still need somebody to run them.
The fourth removes that person: the script runs on a schedule, builds the report as an HTML email with the charts embedded, and sends it to the distribution list every Monday at nine.
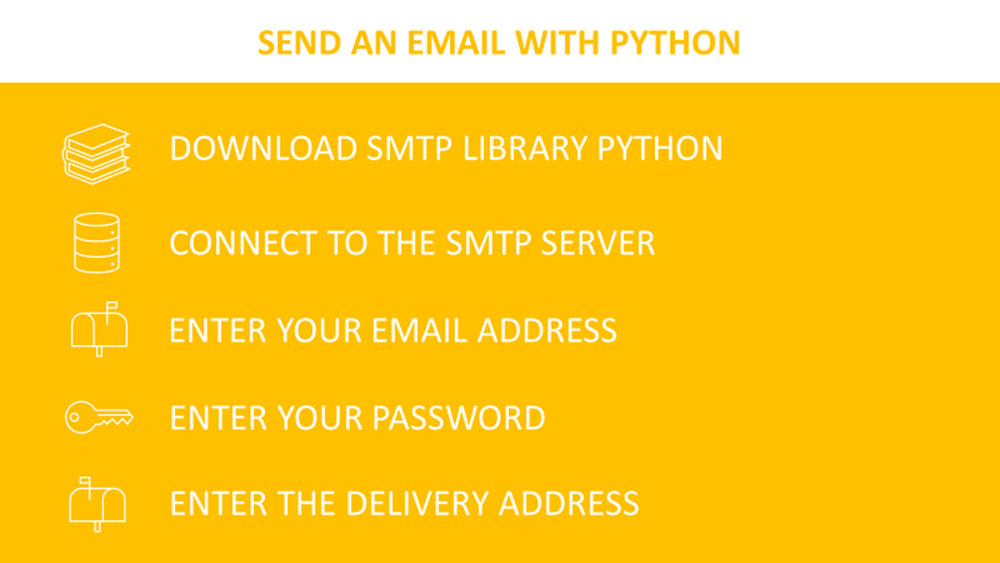
The operational reports by email case study covers the HTML template and the sending.
The scheduling is where n8n has replaced the cron job for most of the teams I work with, because the person maintaining it is rarely a developer.
When it applies: the report is the same every week and the readers are the same people.
The VBA question
Every one of the patterns above assumes Python, and a lot of operations teams do not have it and will not get it.
For those teams, VBA inside Excel does a surprising share of the same work: I have used it to back up an Outlook inbox and to automate the scenario analysis a quotation needed by Friday.
My honest advice is to automate the spreadsheet you already use before you touch Python, because the report your team trusts is the one that lives where they already work.
Which pattern to start with
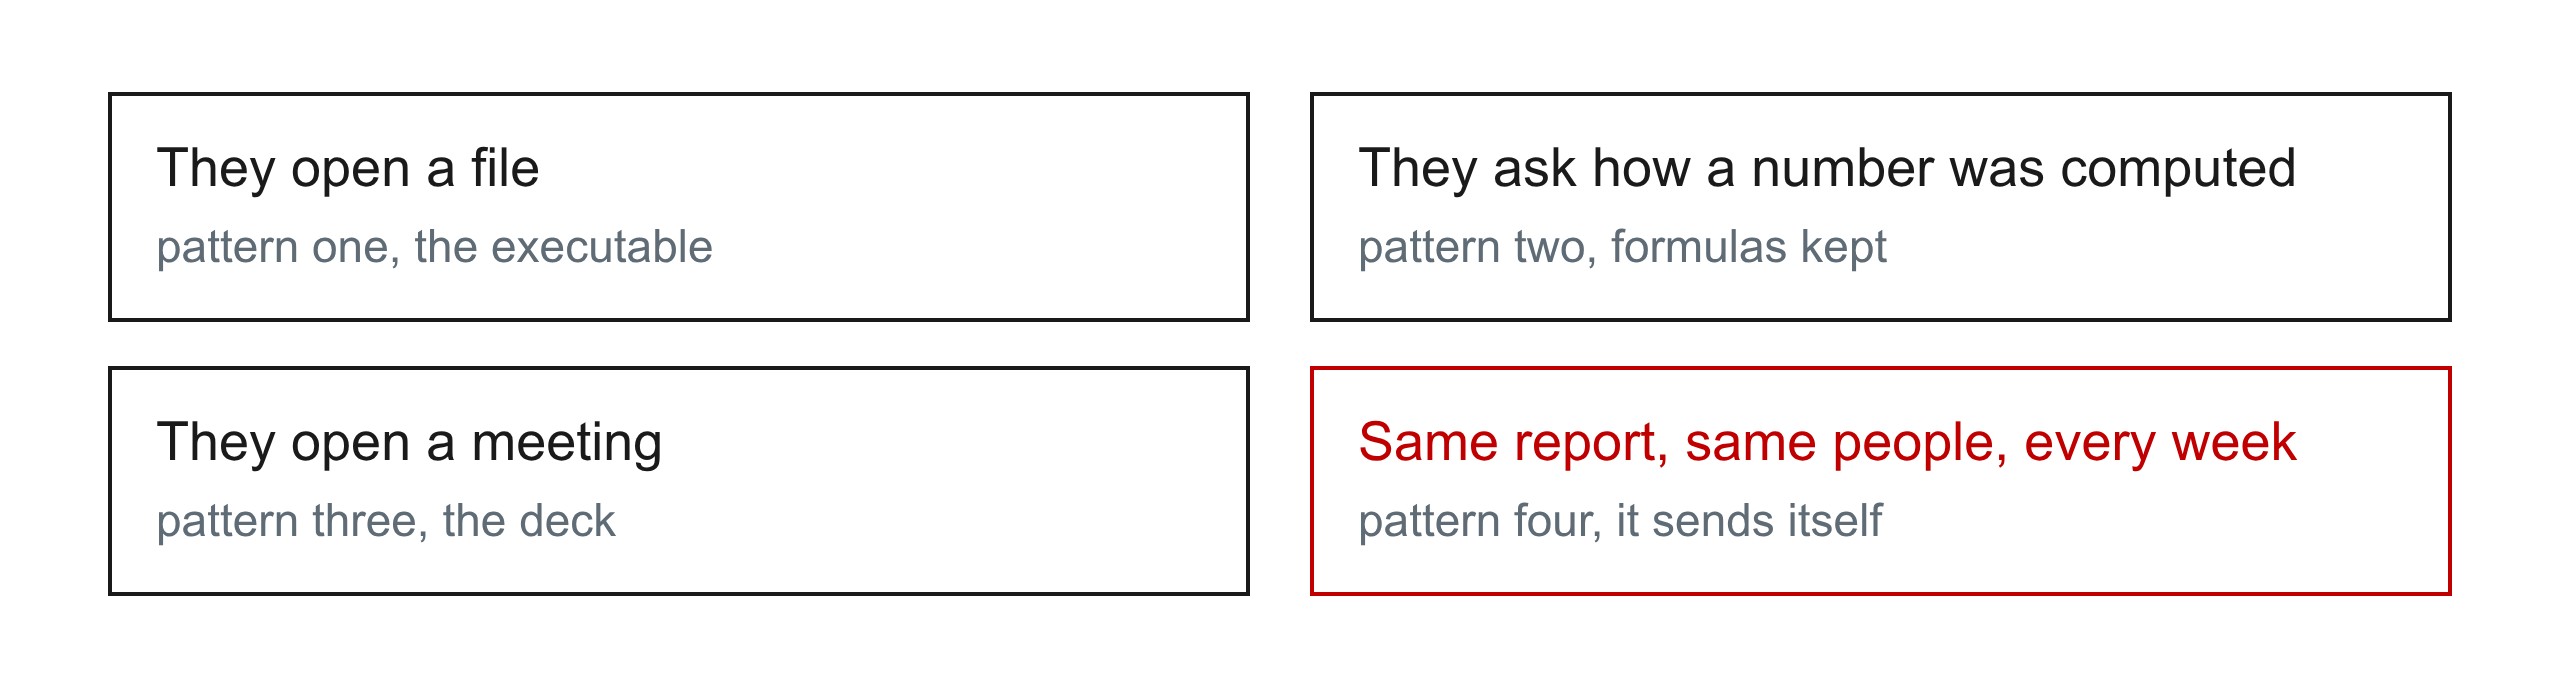
Start with the report that costs the most hours, and pick the pattern by who opens the result.
If they open a file, pattern one, and pattern two the moment they ask how a number was computed.
If they open a meeting, pattern three, and if the same report goes to the same people every week, pattern four, which is the only one that gives the Friday back entirely.
The question is never which library. It is who opens the result, and what they do with it.
Conclusion
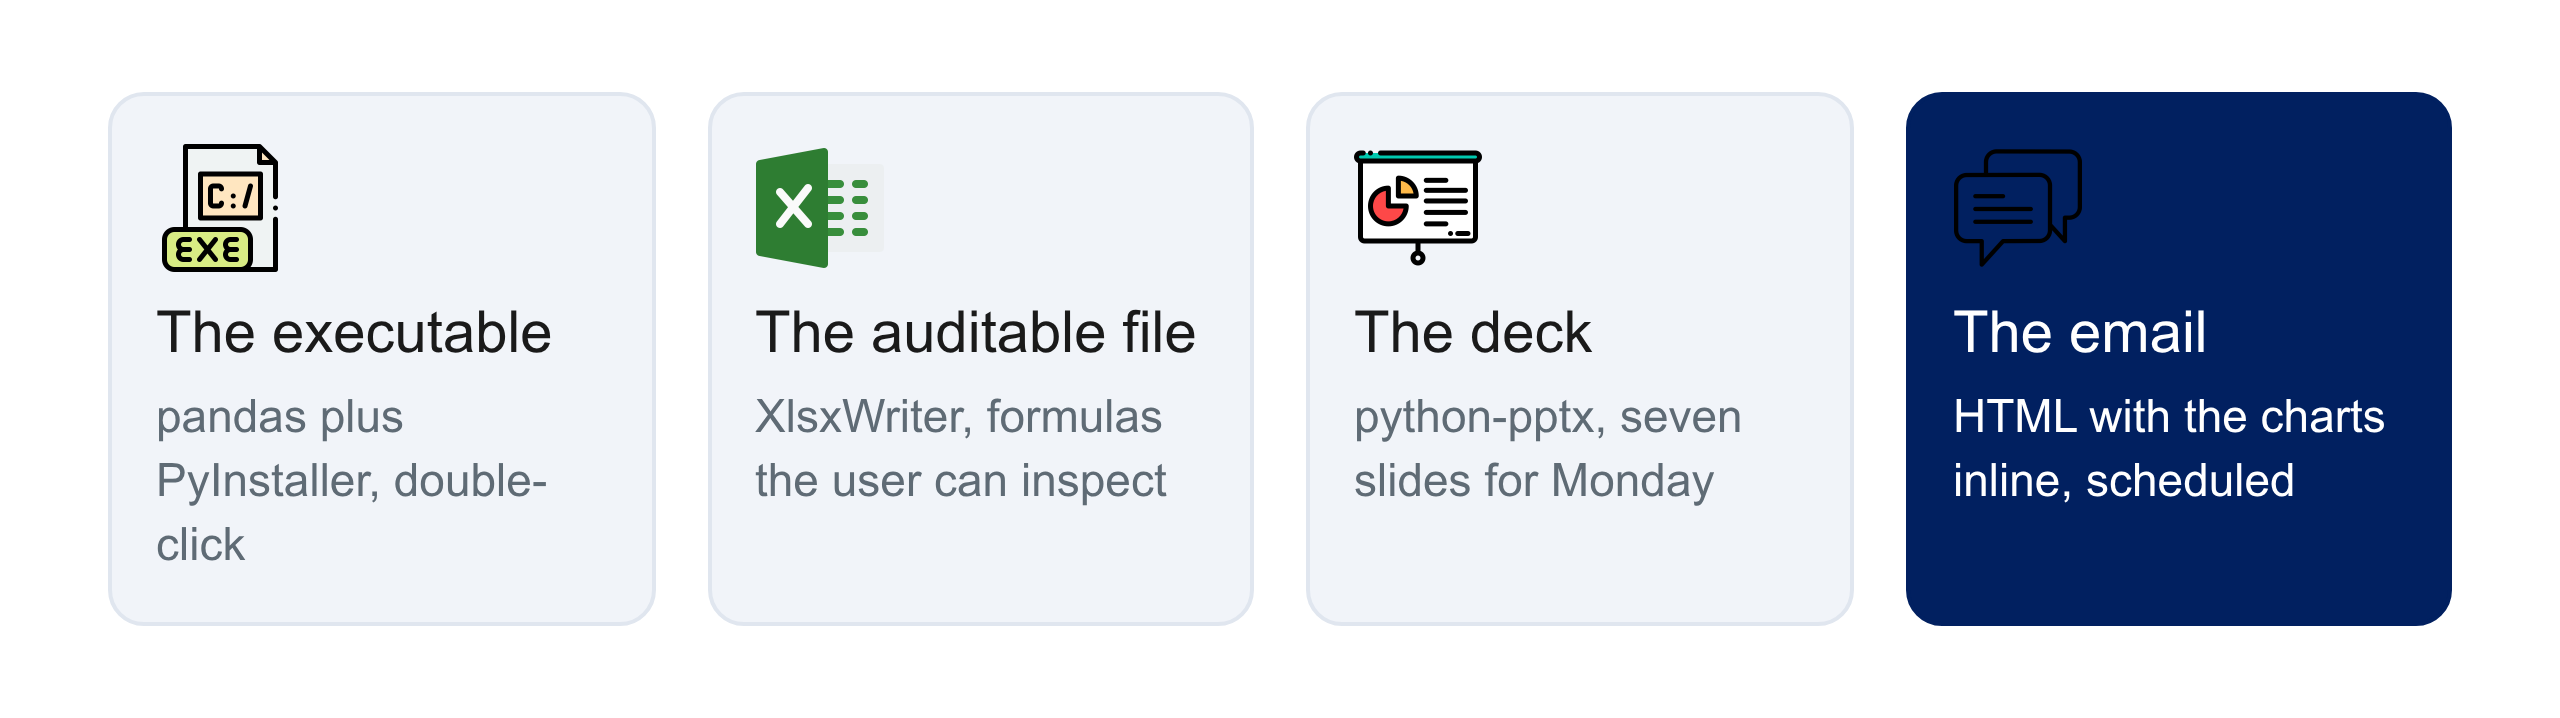
Automating Excel reports with Python is four patterns, chosen by the destination of the report rather than by the tool: a file, an auditable file, a deck, or an inbox.
What we covered in this article
The double-click executable, the XlsxWriter report that keeps its formulas, the PowerPoint deck, the scheduled HTML email, and the VBA route for teams without Python.
Where to go next
The extracts every pattern starts from come out of the warehouse management system, and what a WMS is explains where those timestamps come from.
Once the report is automated, the next question is what it should show, and logistic performance management covers the KPIs an operation is actually judged on.
Related videos
The videos behind this article, already on the channel:
- Turn Your Inventory Analysis Into a Tool Your Team Can Use
- Learn Supply Chain Workflow Automation with n8n (Full Tutorial)
- Your n8n Workflow Died 5 Hours Ago: Nobody Told You
- I Built a Supply Chain Dashboard in Minutes with Claude Cowork - No Code Required
- Automate Supply Chain Sustainability Reporting with Python (Source Code)
The ones coming next, with the date each goes public:
- Connect Your Python Analytics API to Email with n8n (No Code), 26 October 2026
- 4 Charts That Get Your Supply Chain Analysis Read, 23 November 2026
- Automate Your Weekly Supply Chain Report Without AI, 9 December 2026
- A Simple Dashboard of Warehouse Productivity, 24 February 2027
About Me
Let's connect on LinkedIn and Twitter. I am a Supply Chain Engineer who is using data analytics to improve logistics operations and reduce costs.