Automate Operational Reports Distribution in HTML Emails using Python
Automate the distribution of supply chain operational reports with visuals in HTML emails using python.

Automate the distribution of supply chain operational reports with visuals built in HTML emails with Python
Article originally published on: Medium.
Scenario
You are a continuous improvement engineer in the distribution centre of a fashion retail company in charge of performance reporting.
On a weekly basis, you connect to the systems, extract data and perform analysis to build operational dashboards.
You send via email to your management weekly reports with operational indicators.
This process is time-consuming because you do it manually with Excel.
Objective
In this article, we will build a fully automated solution to share a one-page operational report in an HTML email using Python.
💌 New articles straight in your inbox for free: Newsletter
Problem Statement
Scenario
You are a continuous improvement manager in an international clothing group that has stores all around the world.
The company is producing garments, bags and accessories in factories located in Asia.
Stores are delivered from local warehouses that are directly replenished by factories.

Performance Management
On a regular basis, you have to share warehouse operational indicators with your management.
This is a manual process in which you need to
- Extract data from the Warehouse Management System (WMS)
- Process data and built visuals with Excel
- Send a short report by email with the visuals and comments
Objective
To be efficient, you would like to automate this process using Python.
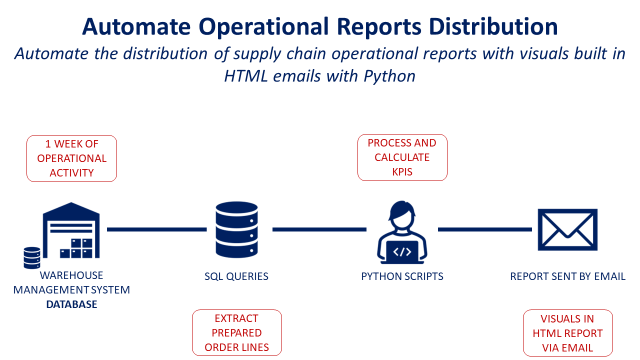
Your solution will be a simple python script, deployed on the cloud, that will automatically perform these four steps:
- Extract prepared order lines of last week from the WMS SQL database
- Process the data and compute KPIs with key insights
- Automatically send an HTML email with visuals and comments

Results
The final report will look like the image below:
- The title will be adapted to the current week
- A bar plot visual will be included
- A comment area will provide insights based on the visual

The full process will be automated so the reports can be sent on time without your support.
If you are looking for examples of application for operational management, have a look at this short video

Solution
You can find the source code with dummy data here: Github
Let us explore all the steps to generate your final report.

Data Extraction
As you won’t have access to my WMS databases, I have shared a CSV file with dummy data.
But your solution will be connected to your WMS
- Create your SQL Query to extract shipment records
- Use pandas.read_sql_query to do the query
- Results will be a pandas data frame
Data Processing
An important indicator is the number of lines per order, your processing task will add this column to your data frame.
Build Chart
You need a simple bar plot chart that shows the number of Lines and Orders prepared per day.

Save the image
In order to be embedded in your HTML page, you need to save it
Add insights
An added value of your report is to summarize the week of operations in three bullet points.
Therefore, you need to compute the right indicators that will bring visibility to your top management.
These insights will be included in your HTML file for the comment area.
Create the HTML report
In the repository, you can find a template of a very simple HTML page that will be used to create your email.

The structure is simple with
- A header with a logo in a png file
- A title with the current week updated
- Your visual using a png image
- A comment area with updated insights
- A footer where you can put information about the author
Include the images
To include the header and your visual in the HTML you’ll create MIMEImage objects with a content-id that will be put in the HTML code.
Add the insights
In the HTML code, I have put some markers where the insights will be written. The idea is to use the replace function to modify them and put the values returned by the python script.
Create and send the email
To send your email using python you can use the library smtplib.

You need to add the following information (example FYI)
- SMTP server, port: for instance ‘smtp.google.com’, 465
- Your email address and the delivery address
- Your mailbox password
And then you can send your HTML email with updated visuals and insights.
Conclusion & Next Steps
Conclusion
With this very simple example, you have a template to build your own reporting automation solution.
You can now,
- Add visuals or tables
- Bring more insights or enrich the text with conditions
Next Steps
This python script can be launched locally on your computer with one click.
However, as the initial objective is to fully automate the process, you can deploy this code on Heroku and schedule the launch every Monday at 9:00 am.
About Me
Let’s connect on Linkedin and Twitter, I am a Supply Chain Engineer that is using data analytics to improve logistics operations and reduce costs.
If you’re looking for tailored consulting solutions to optimize your supply chain and meet sustainability goals, feel free to contact me.


