What is Supply Chain Analytics?
Use data analytics with python to improve operational efficiency by enabling data-driven diagnostics and decisions at strategic and operational levels
A Supply Chain can be defined as a set of parties exchanging flows of material, information, or monetary resources to fulfil a customer request.
As information plays an important role, Supply chain Analytics has emerged as the methodologies and tools organizations use to get insights from data associated with all processes included in the value chain.
In this article, we will introduce the different types of Supply Chain Analytics and understand their impact on the efficiency of your end-to-end operations.
💌 New articles straight to your inbox for free: Newsletter
I. Scenario
Example of a Supply Chain for a Fashion Retailer
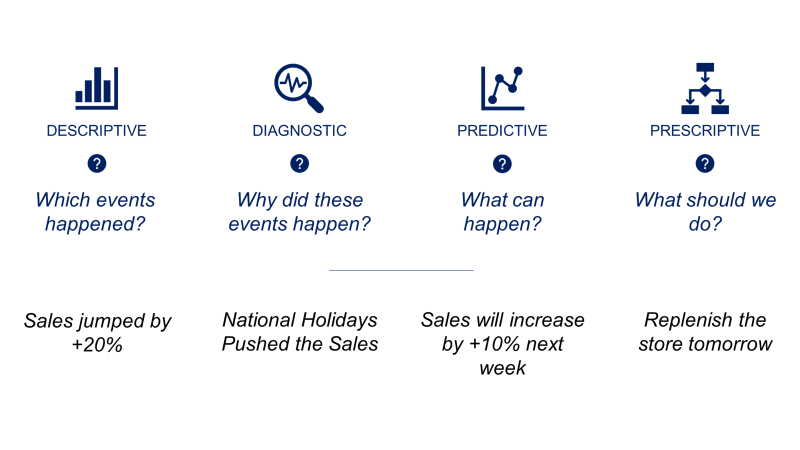
II. What are the different types of Supply Chain Analytics?
1. Descriptive analytics
2. Diagnostic analytics
3. Predictive analytics
4. Prescriptive analytics
III. Why is it so important?
IV. What skills do you need?
If you prefer, there is a video version of this article!
Supply Chain Analytics for Fashion Retail
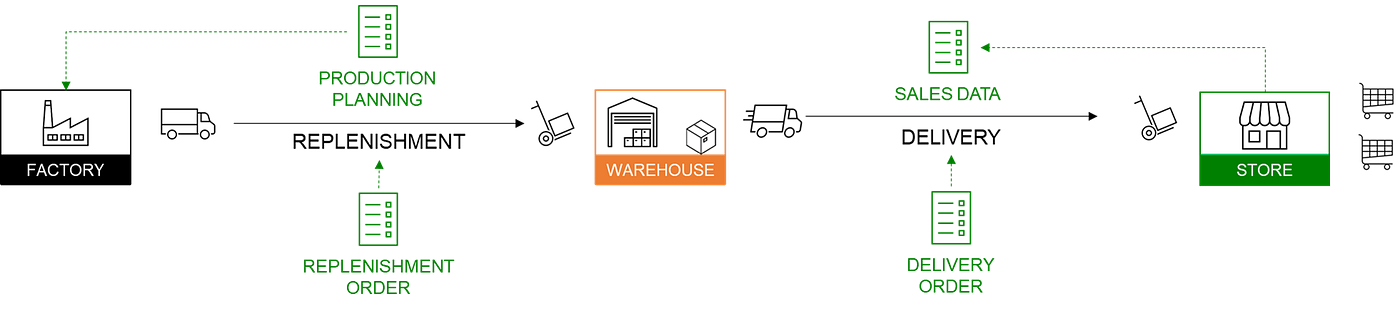
Supply Chain Network of a Fashion Retailer
Let us take the example of an international clothing group with stores around the world.
The company is producing garments, bags and accessories in factories located in Asia.

Stores are delivered from local warehouses replenished directly by factories.
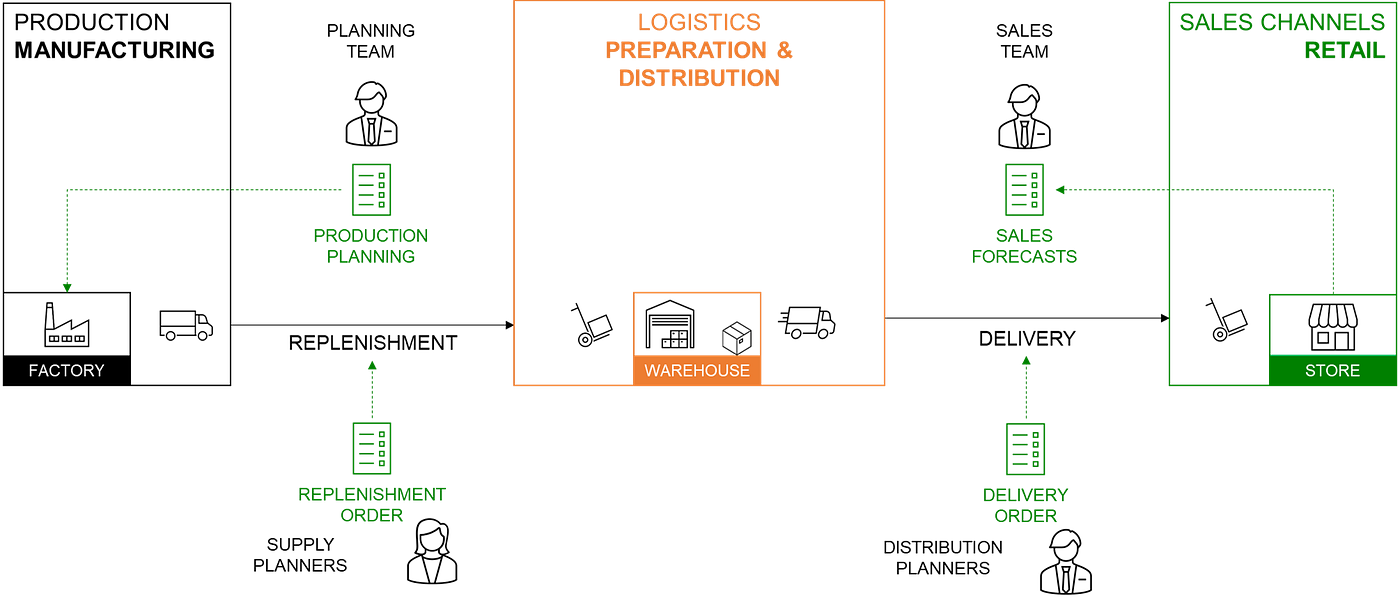
Flow of goods
- Warehouses are replenished with bulk from the factories
- Store orders are picked, packed and shipped from local warehouses
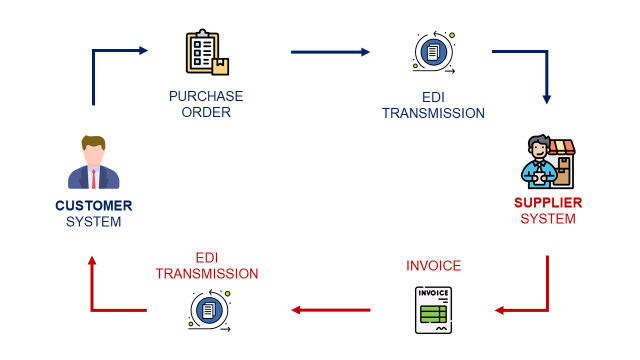
Flows of information
- Sales and merchandising teams collect sales data from the stores
- Planning teams provide demand forecasts and support the production schedule
- Supply planners send orders to the factories for warehouse replenishment
- Distribution planners create store replenishment orders for the local warehouses
Let us now explore which tools can be used to optimise the flow of goods using the available information.
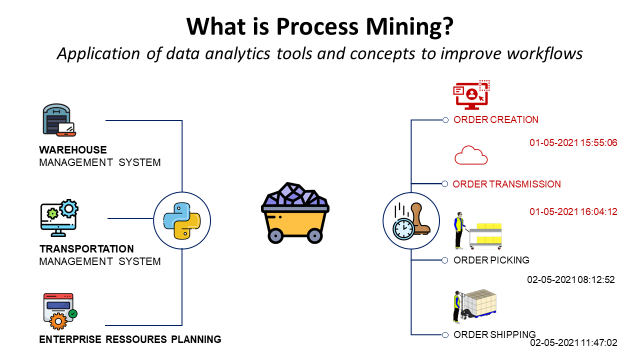
Different types of Supply Chain Analytics?
Supply Chain Analytics can be represented as a set of tools that leverage the flow of information to answer questions and support decision-making.
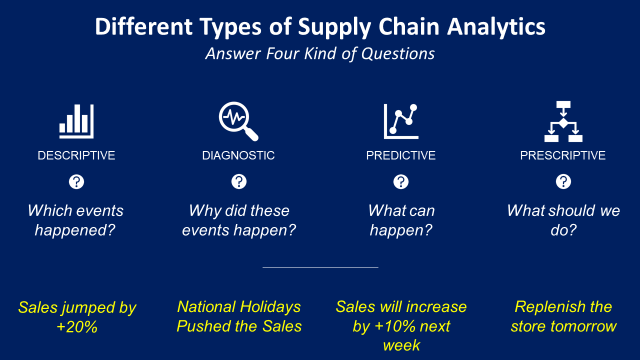
For each type, you’ll need specific methodology, mathematical concepts and analytics tools to answer the question.
Descriptive Analytics
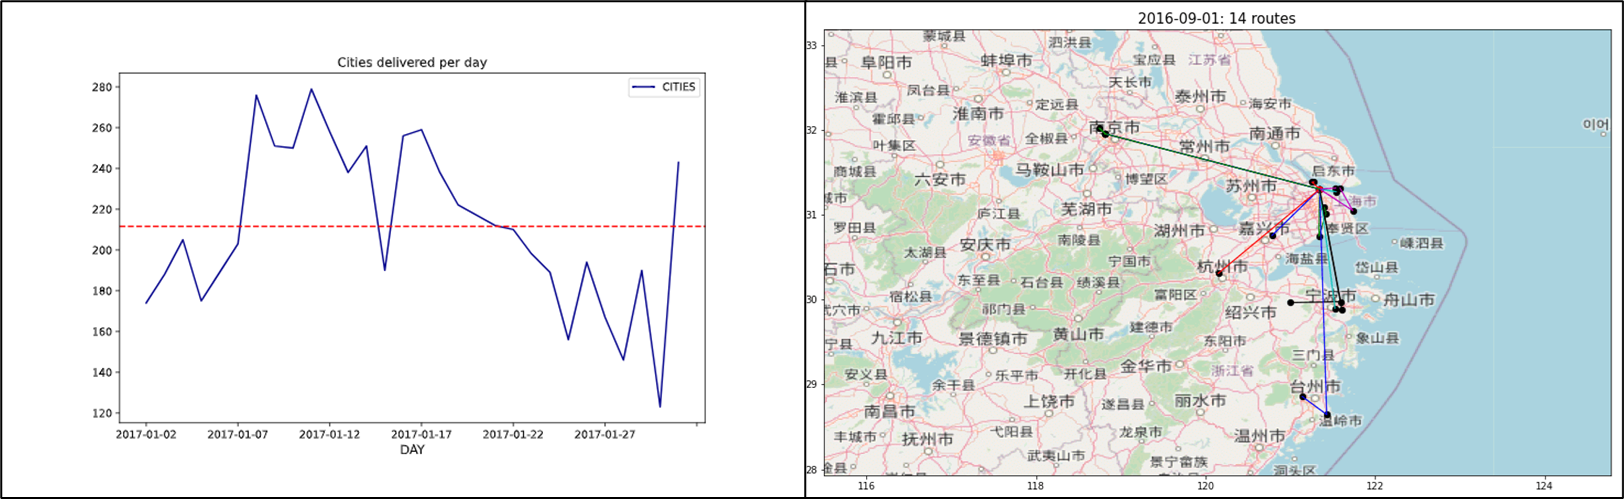
A set of tools to provide visibility and a single source of truth across the supply chain to track your shipments, detect incidents and measure the performance of your operations.

The final deliverable is usually a set of dashboards that can be put on the cloud using Power BI/Tableau, such as a
- Warehouse Workload Report reporting the key indicators to measure a warehouse activity (orders prepared, productivity, logistic ratios)
- Supply Chain Control Tower to track your shipments along your distribution networks
- Transportation Route Analysis to visualise the routing of your past deliveries
Supply Chain Engineers, Data Analysts, Data Architects, Data Engineers, Product Managers and Business Intelligence Experts
Diagnostic Analytics
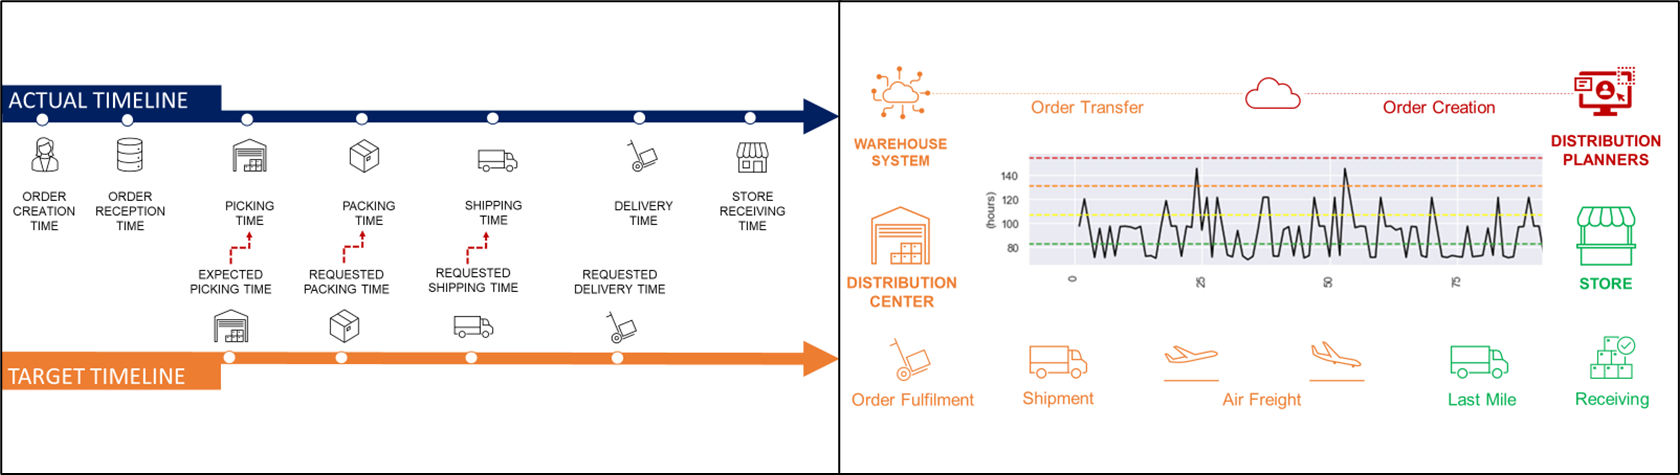
This can be summarised as incident root cause analysis. Let us take the example of the supply chain control tower.
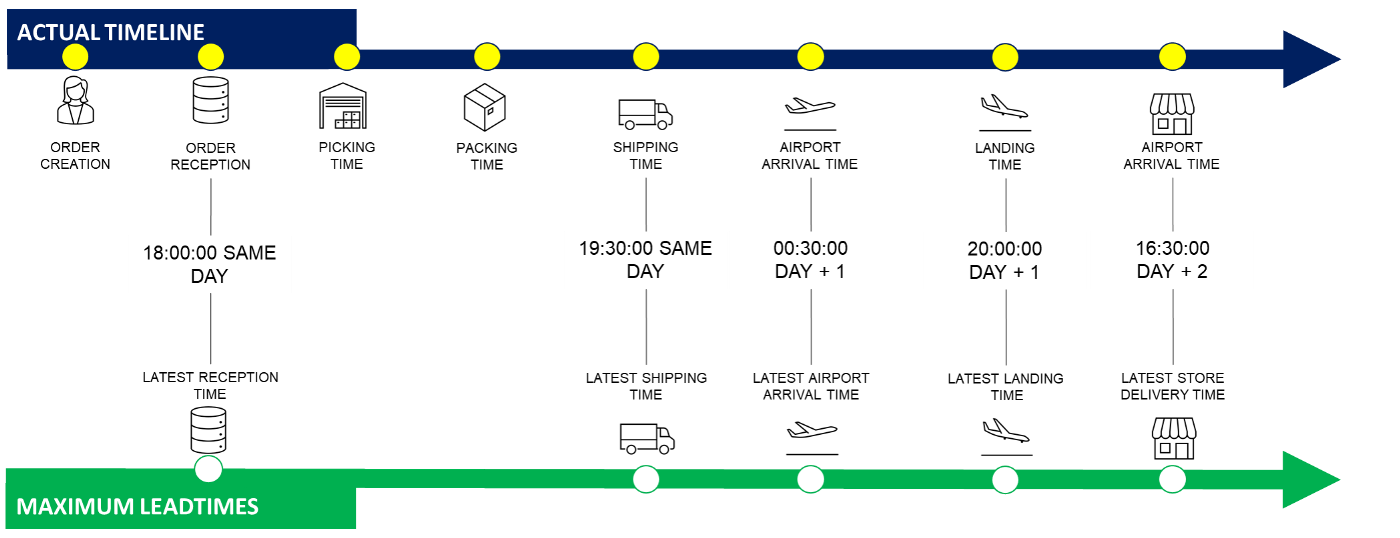
Thanks to your data architecture, you can track your shipments at each step of the logistic chain.
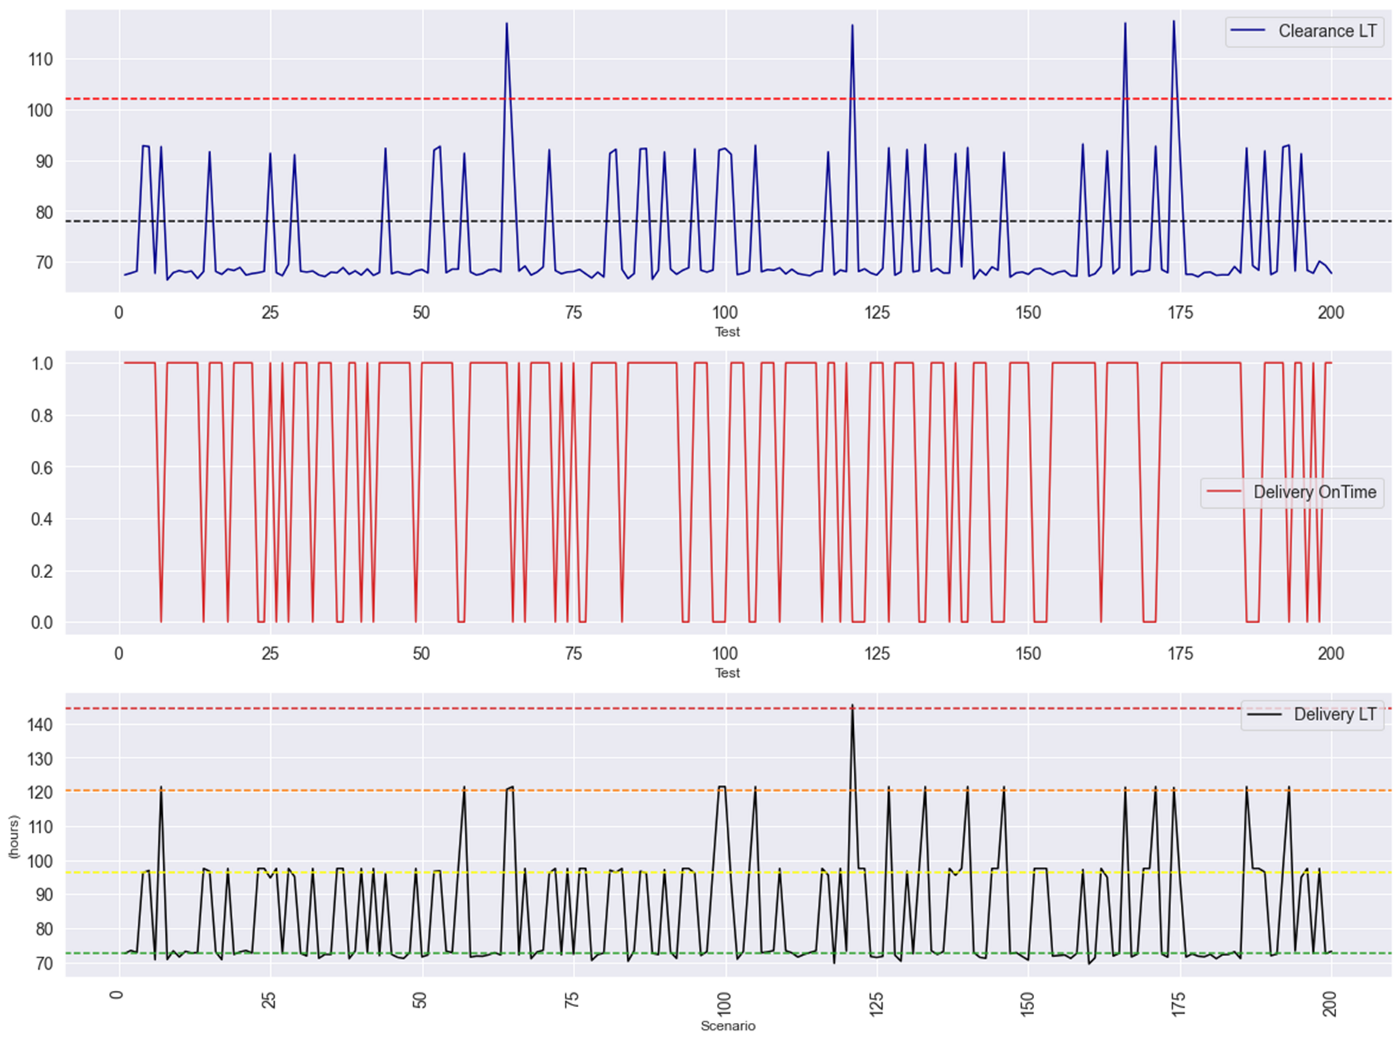
For instance, in the chart above, you can see that long clearance lead times directly lead to late deliveries.
Supply Chain Engineers, Data Analysts, Data Engineers, Product Managers
🧰 TOOLS
Cloud computing, Python processing libraries (Pandas, Spark), BI Visualisation tools (Tableau, Power BI, Google Studio)
If a shipment is delivered late, the root cause analysis involves checking each timestamp to see where your shipment missed a cut-off time.
The analysis process is designed by the operational teams and implemented by data engineers to achieve complete automation.
Predictive Analytics
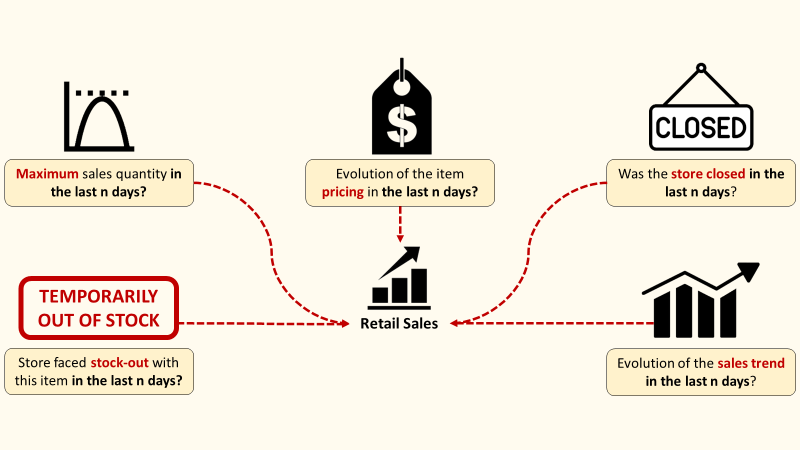
Support the operations to understand the most likely outcome or future scenario and its business implications.
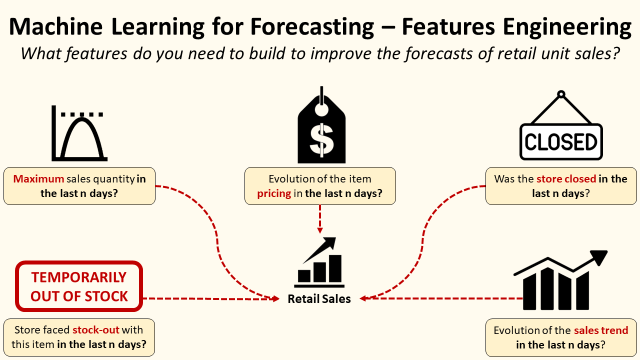
For example, using predictive analytics, you can estimate the impact of future promotions on store sales volumes to support inventory management.
Supply Chain Engineers, Data Scientists, Business Experts
🧰 TOOLS
Cloud computing, Python processing libraries (Pandas, Spark), BI
Machine Learning, Statistics
In the example above, data scientists will work with business experts to identify which features can improve the accuracy of sales forecasts.
Prescriptive Analytics
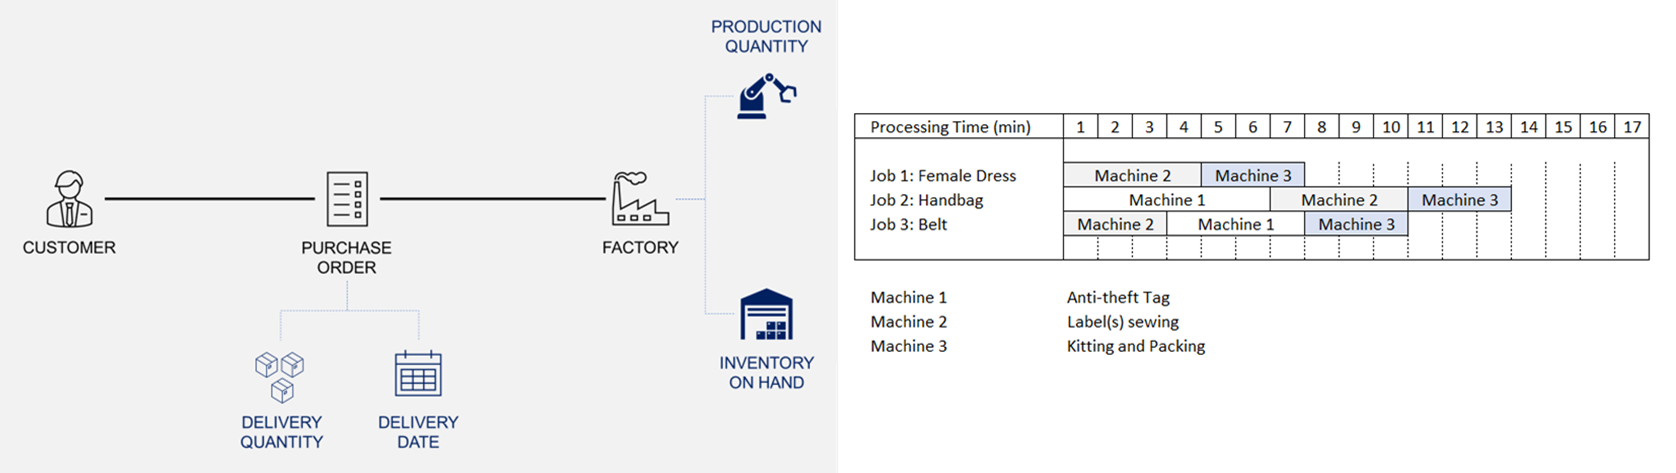
Assist the operations in solving problems and optimizing the resources to reach the best efficiency.
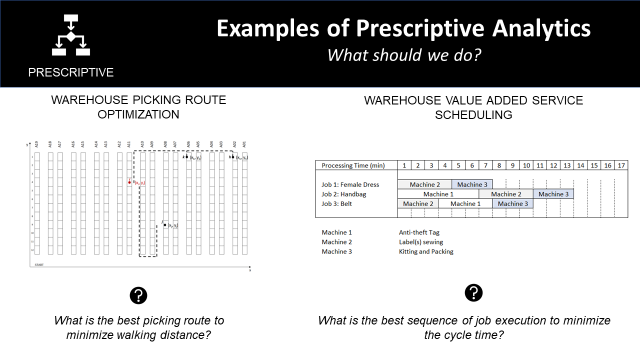
Most of the time, prescriptive analytics are linked to optimization problems where you need to maximize (or minimize) objective functions considering several constraints.
Supply Chain Engineers, Data Scientists
🧰 TOOLS
Cloud computing, Python processing libraries (Pandas, Spark), BI
Machine Learning, Statistics, Linear Programming, Operations Research tools
Usually, the operational issue is linked to a well-known problem with solutions documented in the literature.
For instance, the travelling salesman problem and the job-shop scheduling problem are used in the examples shown above.
Why is it important?
As a supply chain manager, your scope of responsibilities includes
- Understand and minimise the risks
- Optimise operations to reduce costs
- Provide visibility for resource planning
- Prepare for future scenarios
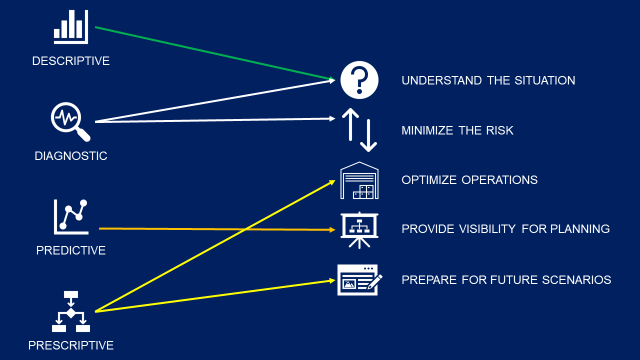
Therefore, you need descriptive and diagnostic analytics to understand the current situation.
Predictive analytics will give you visibility into the future, while prescriptive analytics will support your decision-making.
What skills do you need?
Descriptive Analytics
This will depend on the type of analytics your position involves.
In any case, you will need basic programming skills to work with unstructured data using Python or VBA.
Most of the time, data will be unstructured (in Excel files or PDF reports) or come from heterogeneous systems.
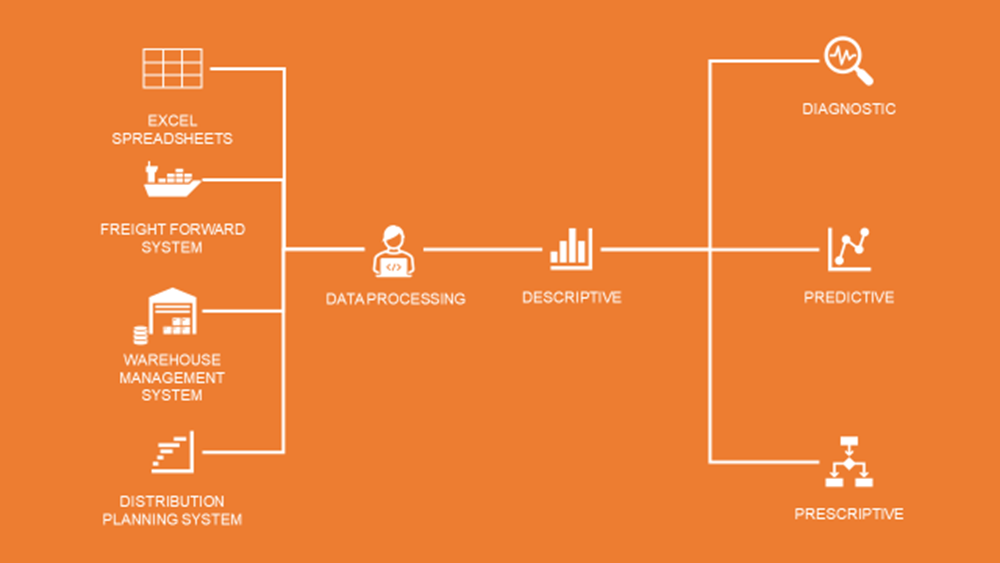
The first mandatory step is the processing and harmonisation of information across these different sources, as well as the development of descriptive capabilities.
Therefore, even if, from a mathematical point of view, it is the easiest part, descriptive analytics will take up a large share of your energy (and budget).
Go beyond
After you’ve created a clean source of reliable data, you can start building models for diagnosis, prediction or prescription.
If you want to go into more detail, you can find examples of case studies in the articles listed below
Descriptive Analytics
- Road Transportation Network Visualisation, Samir Saci
- Deploy Logistics Operational Dashboards using DataPane, Samir Saci
Diagnostic Analytics
- Logistic Performance Management Using Data Analytics, Samir Saci
- Lead Times Variability and Supply Chain Resilience, Samir Saci
Predictive Analytics
- Machine Learning for Retail Sales Forecasting — Features Engineering, Samir Saci
- How To: Machine Learning-Driven Demand Forecasting, Nicolas Vandeput
- Machine Learning for Store Delivery Scheduling, Samir Saci
Prescriptive Analytics
- Production Fixed Horizon Planning with Python, Samir Saci
- Optimize Warehouse Value Added Services with Python, Samir Saci
- Improve Warehouse Productivity using Pathfinding Algorithm with Python, Samir Saci
About Me
Let’s connect on LinkedIn and Twitter. I am a Supply Chain Engineer who is using data analytics to improve logistics operations and reduce costs.
If you’re looking for tailored consulting solutions to optimise your supply chain and meet sustainability goals, feel free to contact me.