What is Process Mining?
Process mining is the application of data analytics tools and concepts to understand, validate and improve workflows.
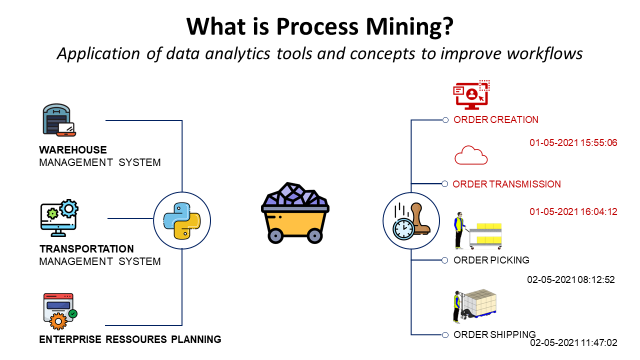
Process mining is a type of data analytics that focuses on discovering, monitoring, and improving business processes.
It involves analysing data from various sources, such as process logs, to understand how a process is actually executed, identify bottlenecks and inefficiencies, and suggest ways to improve it.
In previous articles, I shared examples of Python tools designed to monitor and visualize logistics performance, build an automated supply chain control tower or create smart visualizations.
In this article, we will go beyond monitoring and see how process mining with Python can help you identify bottlenecks and improve productivity.
💌 New articles straight to your inbox for free: Newsletter
What is Process Mining?
Monitor and improve processes with data
Process mining techniques can be applied to many processes, including manufacturing, supply chain management, healthcare, and customer service.
By analyzing data about the process, process mining can help organizations understand how their processes function, identify areas for improvement and make informed decisions about optimising their processes.
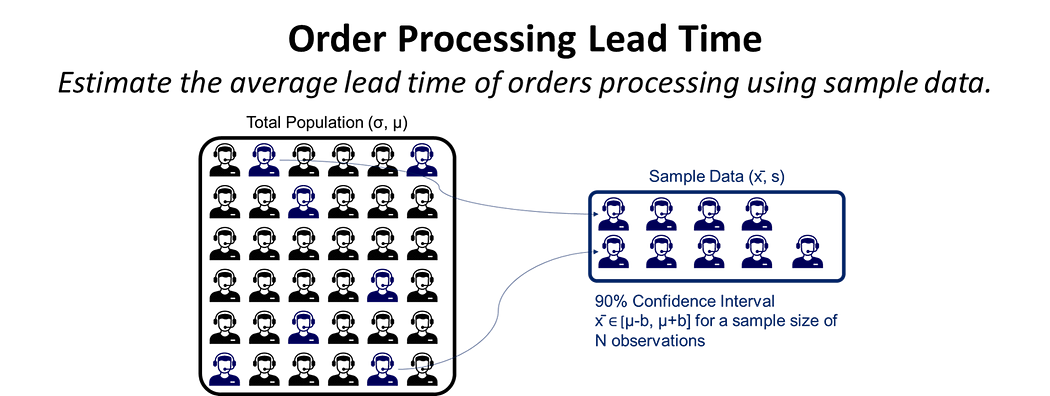
For example, in this article, we explore a statistical method to estimate the lead time of order processing by a customer service team.
Process Mining Approaches
There are several different approaches to process mining, including discovery, conformance, and enhancement.
- Discovery involves using process mining techniques to uncover the structure and behaviour of a process from process logs.
- Conformance involves comparing the actual process to the desired process model to identify deviations.
- Enhancement involves using process mining to suggest improvements to the process based on data analysis.
Example: Store Delivery Lead Time
Distribution Network for Fashion Retail
Let us take the example of the Supply Chain Network of an international clothing group with stores worldwide.
This company is selling garments, bags and accessories produced in overseas factories to replenish a network of regional warehouses.
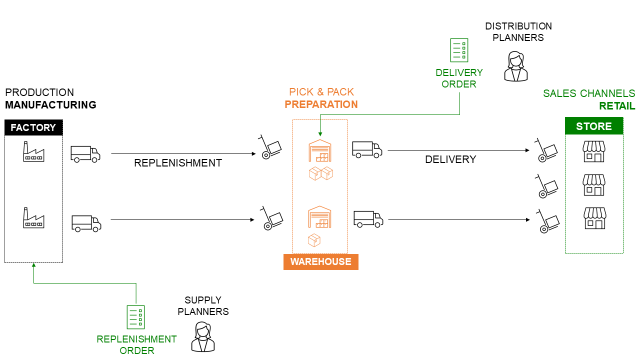
In this article, we will focus on the store's delivery from these regional warehouses.
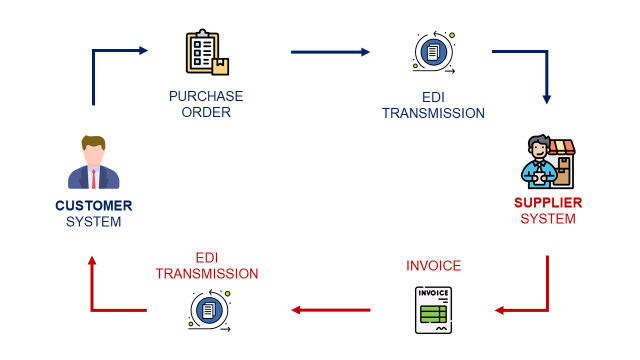
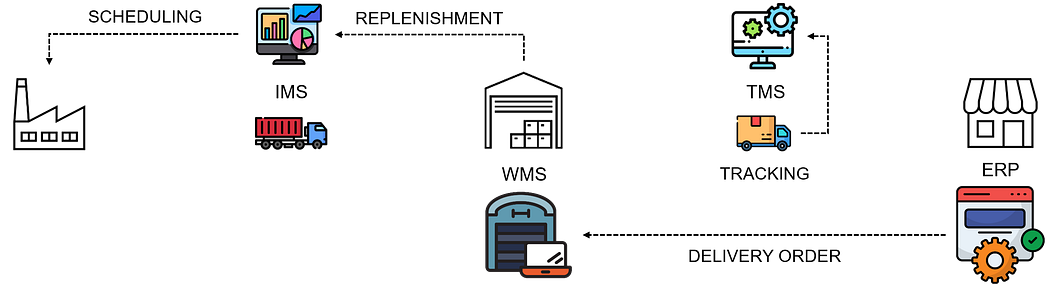
- Distribution planners create replenishment orders in the ERP
- Planners include a list of items needed (with quantity) and a requested delivery date
- Orders are transmitted to the Warehouse Management System
- Warehouse teams prepare the orders in pallets for shipping
- Transportation teams organise the pick-up at the warehouse
- Shipments are delivered and received at the stores
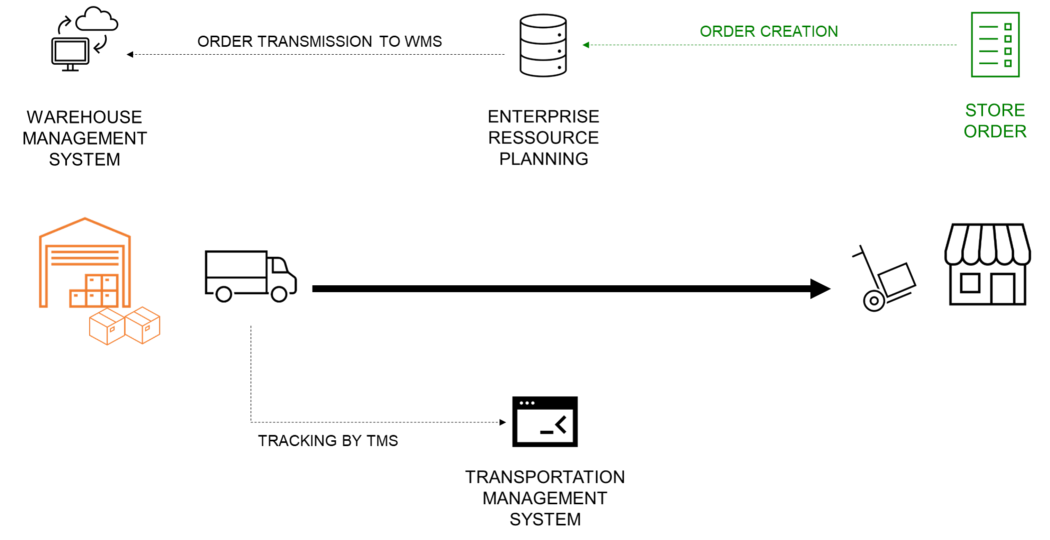
Each step of the process is managed by a specific system (ERP, WMS, TMS) that records information and timestamps, which we will use for process mining.
Approach 1: Discovery
a) Time stamp definitions
From order creation to store reception, timestamps are recorded by the various systems.
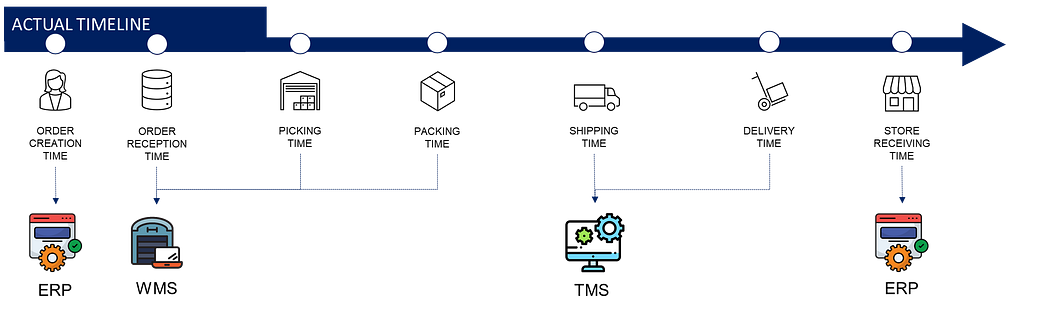
- Order creation time in the ERP by the distribution planner
- Order reception time in the Warehouse Management System (WMS)(now ready to be prepared by warehouse teams)
- Picking time(s) that can include the starting and ending time of the picking mission that contains the order
- Packing time refers to the end of the packing process
- Shipping time when your orders leave the warehouse
- Delivery time is when your truck delivers the pallets to the store
- Store receiving time is concluding the delivery process: the time when the store’s team records the received items in the ERP
💡 Know your processes
In your company, systems can be used in different ways.
Therefore, ensure that processes have been mapped with detailed workflows (including data inputs and outputs).
b) Lead times definitions
As timestamps alone mean nothing, we define lead times for each process as the difference between two timestamps
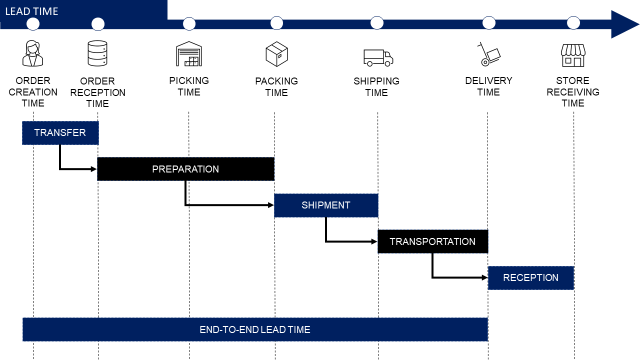
They usually refer to a specific team’s responsibility
- End-to-end lead time measures the performance of the whole logistics department.
- Order Transfer lead time is under the responsibility of the IT/Infrastructure team, which ensures fast transmission of orders
- The warehouse operational team's performance is measured by Preparation Lead time
- Shipment lead time is a grey zone, as warehouse teams can impact it, the finance department (invoicing) or transportation teams (find a truck for shipment)
- Transportation lead time is entirely under the scope of the transportation teams
- Receiving lead time is the responsibility of store teams
Your systems may not have a time stamp for every process. However, your infrastructure team can always find alternative solutions.
For instance, there is no timestamp to show when the packing process ends
- But the order status is changing (from packing to ready to ship).
- A script can be developed to create a timestamp when this status is changed.
- It can be then populated in the data lake you use as a data source.
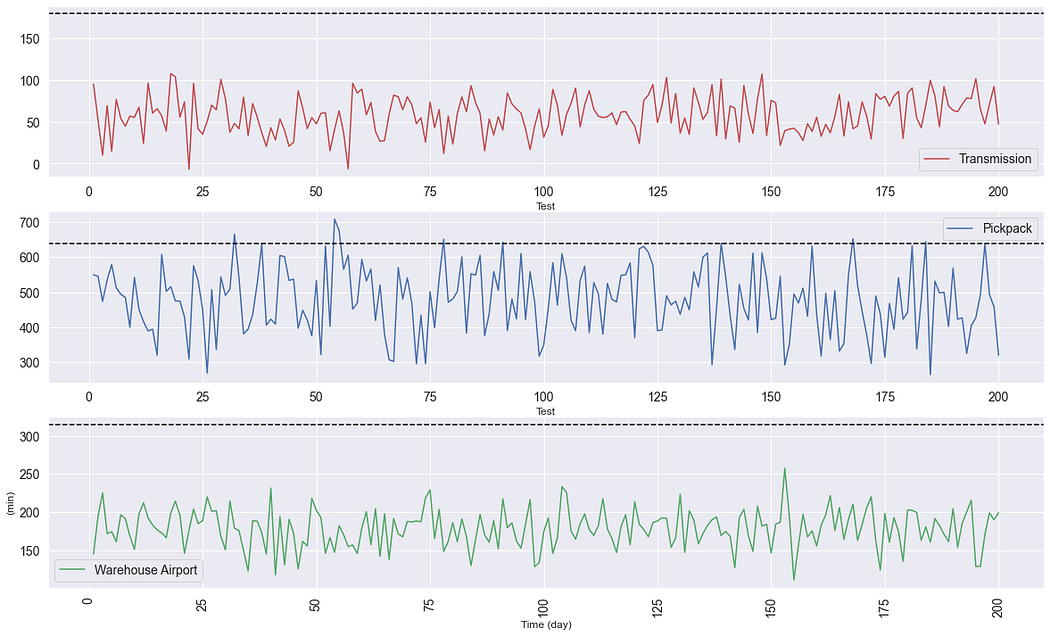
c) Data processing with Python
Using Python, you can connect to different systems to extract transactional records from their respective databases.
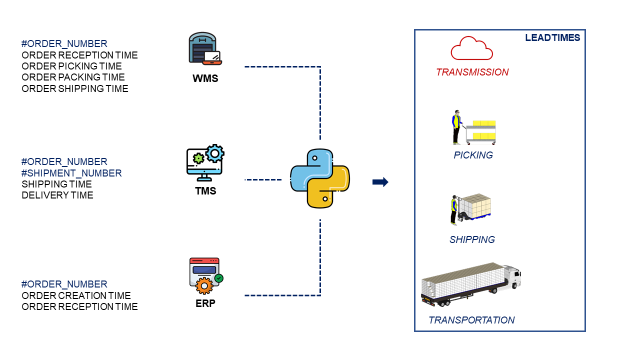
These systems may have different fields and definitions of metrics. Use the order number to merge the tables in a single data frame and calculate the different lead times.
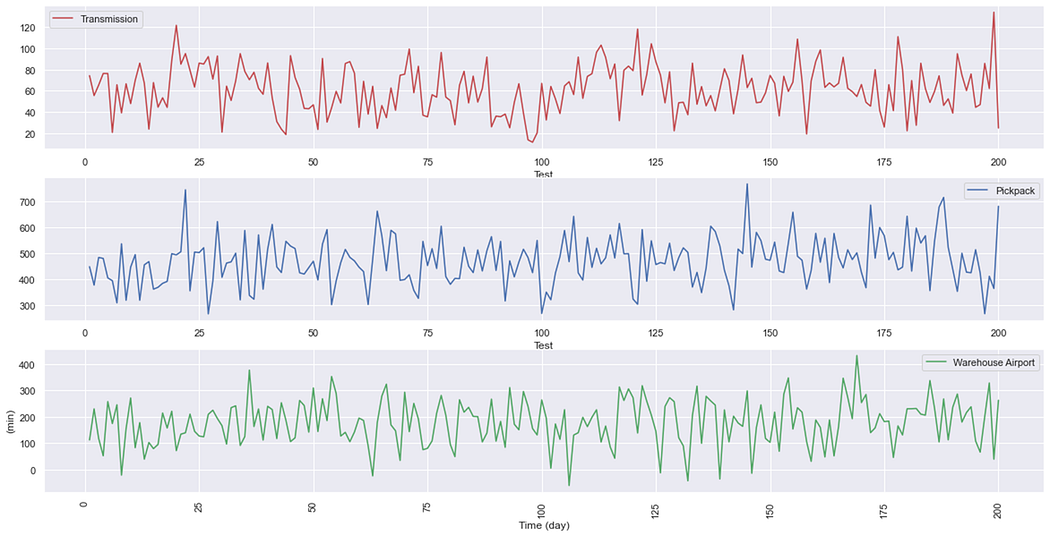
The graph above shows an example of lead times plots (in minutes) that provide an overview of performance variability of order transmission, pick and pack and warehouse-airport transfer.
For more information on how to build a logistic performance dashboard, have a look at this short video.
Approach 2: Conformance
a) Delivery Lead Time: On Time In Full
The most important key performance indicator is the lead time between order creation and delivery.
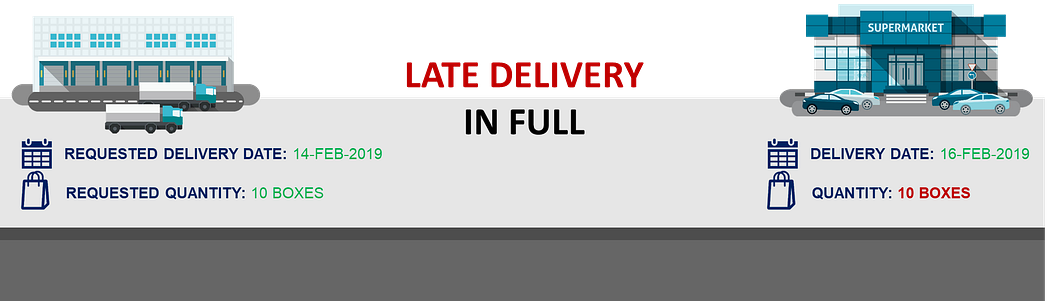
Distribution planners use it to manage their inventory, set the safety stock and plan new collection launches.
And it will also be used by store managers to challenge the logistics department in the different supply performance reviews.
b) End-to-end delivery process
In our example, the delivery lead time target is 72 hours.
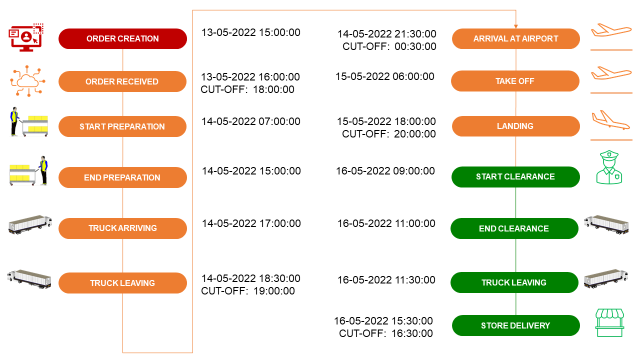
The example above shows a delivery that meets the target lead times.
💡 Cut-off time definition
The order reception cut-off time is 18:00:00.
That means if an order is received after this time, you’ll need to wait for an additional 24 hours to prepare it.
They are the main cause of delayed delivery and disruptions.
c) Visualization
After defining them, you can use your Python script to compare lead times with these targets.
In this visual, you can see that:
- For some orders, warehouse teams do not meet the 5.5-hour (630-minute) preparation lead-time target.
- Order transmission or warehouse-to-airport transfer will never be a problem, as you are well below the maximum lead time.
Approach 3: Enhancement
a) Visualise delays
The objective is to ensure that you have all our orders transmitted, prepared and delivered in less than 72 hours.
It starts with visualisations that will help you to answer simple questions.
- How many orders have been delivered late?
- Which process is impacting your overall lead time the most?
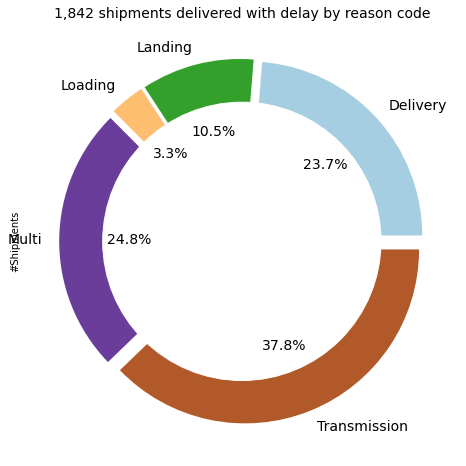
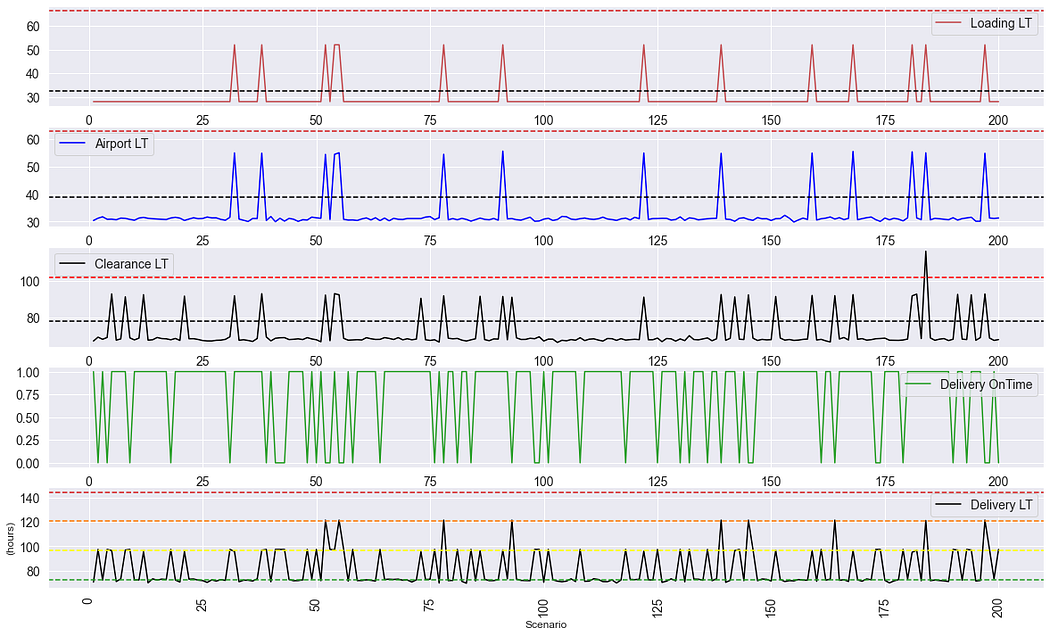
The visual above will help you spot the late deliveries and quickly screen the different legs to understand which one impacted your lead time
- Start to look at the bottom graph
- You spot that one order lead time is above the yellow line
- Screen the lead times above to find which one(s) are causing this delay
As part of prescriptive analytics, you can automatically generate reason codes for late deliveries to be used in visuals like the doughnut plot above.
Example: if your shipment is delayed and your loading lead time exceeds the target, you can add a late-delivery reason code: loading.
b) Process mining to reduce delays
Now that you know the root causes, you can focus on designing solutions to prevent future delays.
For instance,
- You have spotted that many orders are delivered late due to long shipping lead times.
- After further analysis, you found that the root cause is the invoicing process.
- This process depends on the delivery location (region, store type (duty-free, franchise, ..), product category, order type (cross-docking, replenishment, collection launches), and order creation date.
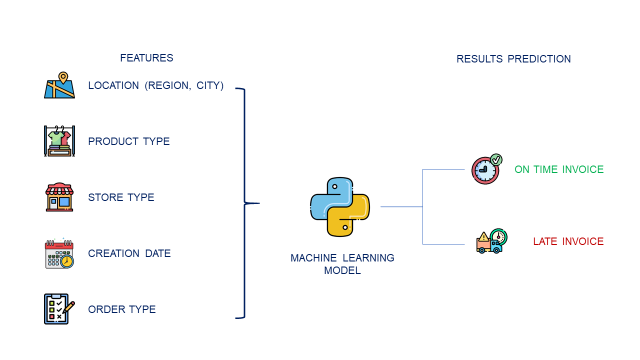
You use data to train a model that predicts the probability of having delays in the invoicing process using the features listed above:
- You have spotted a high correlation between the boolean output (on-time invoicing) and the order creation day (Monday, Sunday) and the store region (Europe, Middle East, Asia, America).
- The vast majority of late invoices are from orders created in the second half of the week for stores located in the Middle East.
- After aligning with local logistics teams in the Middle East, you discovered that the invoice process is stopped on Thursdays and Fridays, as it is the weekend in this region.
You can then ask demand planners (located in Europe) to adapt their order-creation processes to these local specifics.
The example above shows that data alone cannot design a solution or solve problems.
They need to be included during
- Time-stamp definitions to ensure that the information you retrieve from systems matches operational reality.
- Lead time definitions to match them with your company’s supply chain performance management. (Example: if store receiving is not included in the transportation team’s performance measure, you need to remove it)
- Data processing with Python, to ensure that the fields you are using for your calculation are the right ones.
- Visualisation creation to ensure that they can be used by operational teams to get insights.
The models and visualisations you designed will provide insights to support continuous improvement initiatives and boost strategic decision-making.
Conclusion
Overall, process mining can be a powerful tool for improving the efficiency and effectiveness of business processes.
And is increasingly used by organizations to drive process improvement efforts.
What do you need to implement Process Mining?
It requires harmonised and clean data.
This basic requirement can be a major obstacle in your digital transformation journey.
The worst-case scenario, which is unfortunately very common, would be an organisation with
- Several systems that are not communicating together, like multiple ERP instances, one WMS per warehouse fully controlled by the 3PL, and several TMS not interfaced with anything
- Many customisations that are not documented, such as additional fields created by a developer who left the company
- Absence of a single source, like a data lake, that groups the databases of your different systems
At this stage, you need to work on harmonising and building a strong data architecture (with governance to maintain data integrity) before jumping into process mining.
Next Steps
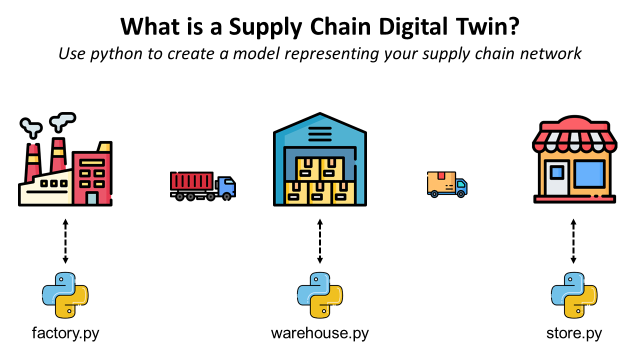
After identifying operational failures and their root causes, you will be interested in building a Digital Twin to simulate scenarios and test the resilience of your solutions.

About Me
Let’s connect on LinkedIn and Twitter. I am a Supply Chain Engineer who is using data analytics to improve logistics operations and reduce costs.
If you’re looking for tailored consulting solutions to optimise your supply chain and meet sustainability goals, feel free to contact me.