Reduce Warehouse Space with the Pareto Principle using Python
How the 80/20 rule implemented using python can optimize your layout, reduce space utilization and improve the picking productivity

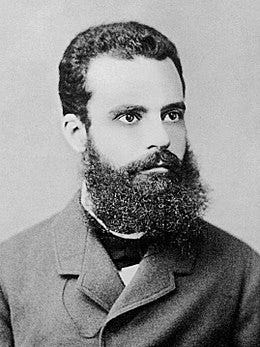
An Italian economist, Vilfredo Pareto, developed a mathematical formula in 1906 to describe the distribution of wealth in Italy.
He discovered that 80% of the wealth belonged to 20% of the population.
A few decades later this rule has been generalized to many other applications including Supply Chain and Logistics Management.
This principle, called the “Pareto Principle”, “the 80–20 rule” or “The Law of Trivial Many and Critical Few”, can be translated for Logistics Practitioners
- 80% of your company's revenue is made from 20% of your reference
- 80% of your volume is picked in 20% of your picking locations
- 80% of your replenishment volume will be performed on 20% of your picking locations
In this article, we will explore how to apply the Pareto Principle using a real operational example
- 1 month of picking orders
- 144,339 order lines
- 59,372 orders
- 4,864 active references
💌 New articles straight to your inbox for free: Newsletter
If you prefer to watch, here is the video version of this article.
Data Processing using Pandas
Import Libraries and Dataset
Calculate Volume Prepared per SKU (BOX)
To plot the Pareto graph, we need to
- Sum the number of boxes picked per SKU
- Sort your data frame by descending order on the BOX quantity
- Calculate the cumulative sum of BOX
- Calculate the cumulative number of SKUs
Results
In line 5, you can see that 0.1% of your SKU represents 12.7% (20,987 Boxes).
Visualisation of the Pareto Principle
A first visualisation
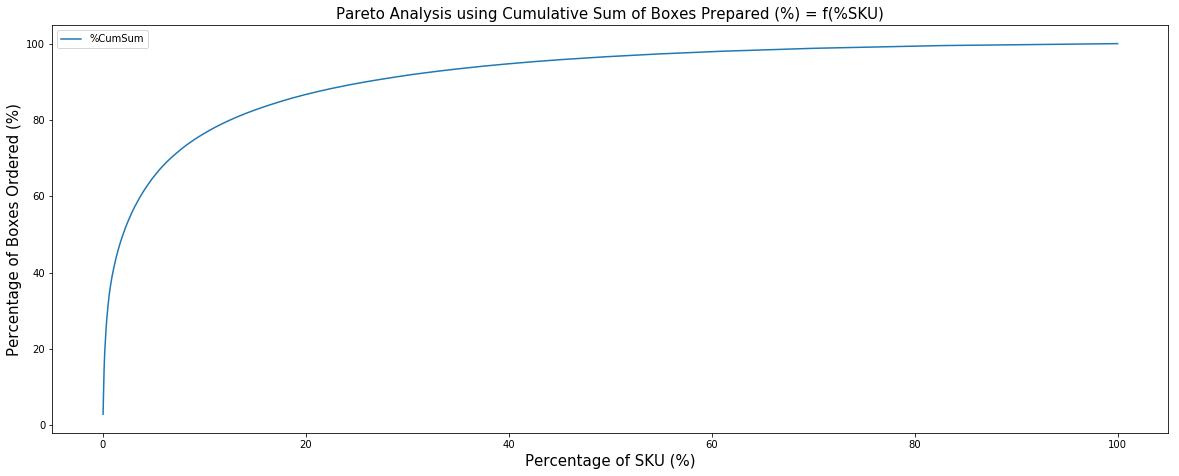
Using your processed data frame, let us now plot (%BOX) = f(%SKU) to show the Pareto principle.
Add Markers for 80/20
Marker 1: x = 20% of SKU (blue)
Marker 2: y = 80% of Boxes (red)
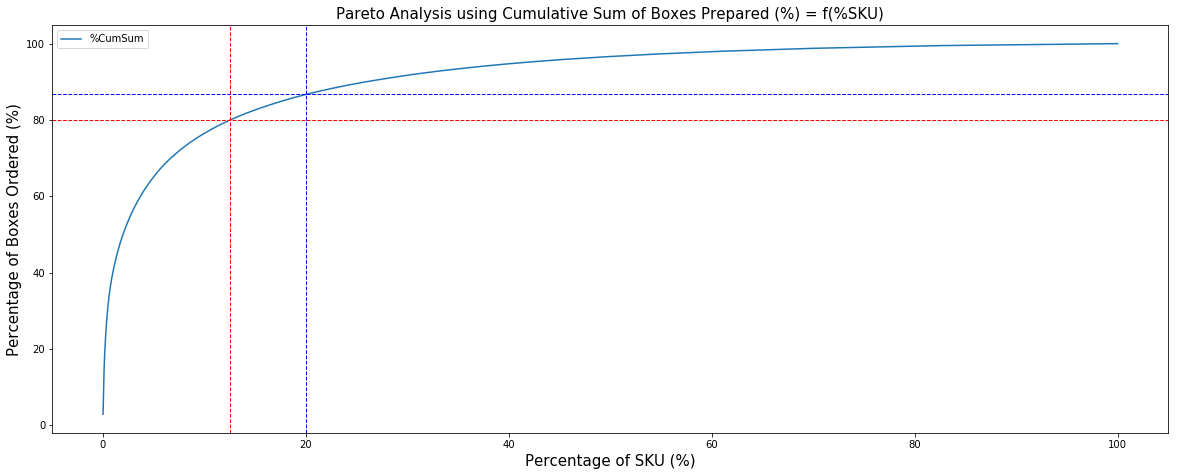
Insights
We can see that the threshold of 80% volume is already reached before having 20% of SKU (sku_80 = 12.55%).
Try it yourself to see how much %BOX represents 10% of the SKU picked.
Grouping High Rotation SKUs in Dedicated Picking Zones
How can we use these insights to increase your picking productivity and reduce space usage?
Use these results for Storage Optimisation
We always need to reduce the surface used in warehouses; it's the highest cost.
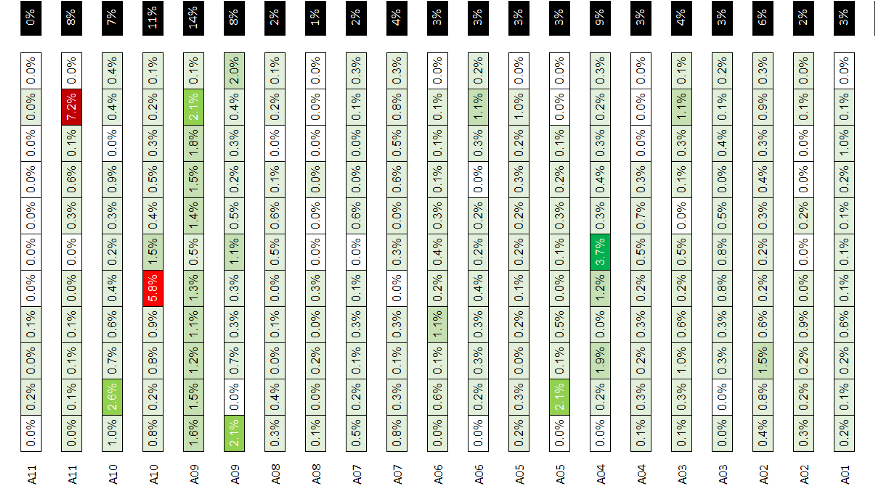
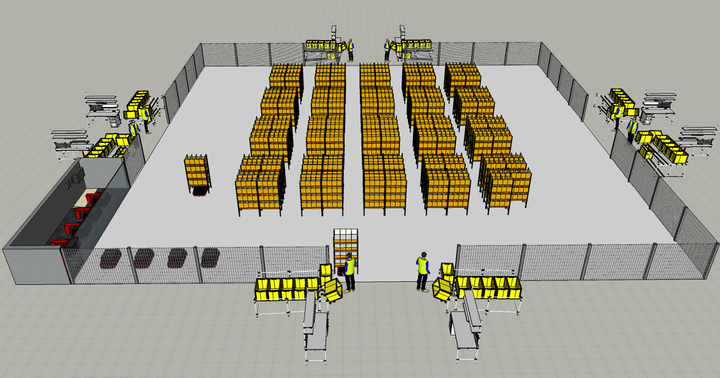
The Heatmap above is a 2D representation of the Pareto Principle, linking each SKU to its picking location.
Optimization Lever
Reduce the average picking distance by grouping high-rotation items in a zone near the docks.
For more information, have a look at my previous article: Improve Warehouse Productivity using Spatial Clustering with Python Scipy
 Samir Saci
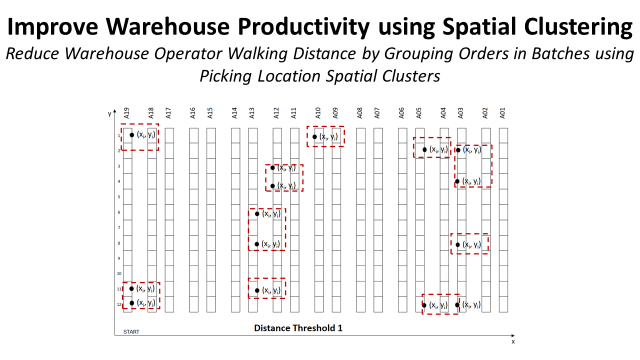
Densify Picking Locations for Very Low Rotations
What is a replenishment task?
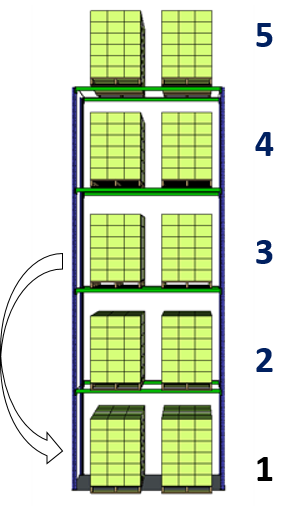
Level 1 is the Picking Location located on the ground level.
This is where the Warehouse Picker will take boxes to prepare orders.
When the quantity level in your picking location is below a certain threshold:
- WMS triggers a Replenishment Task
- Taking a pallet from the storage level (level 3)
- And putting it in the picking location (level 1)
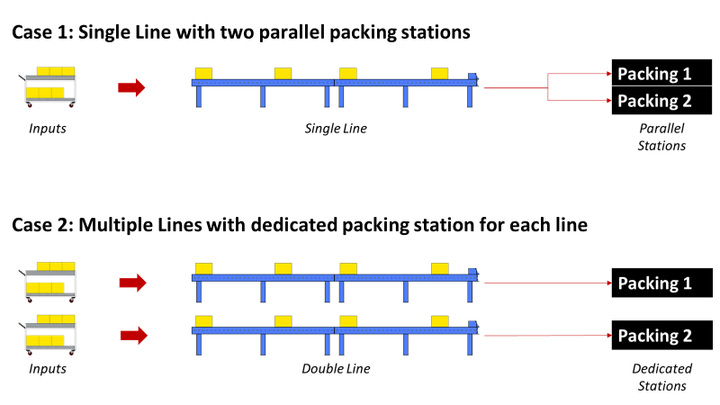
This process has a productivity that depends on the layout.
How can the Pareto Principle impact your picking location layout?
Full Pallet locations take a floor pallet location per SKU.
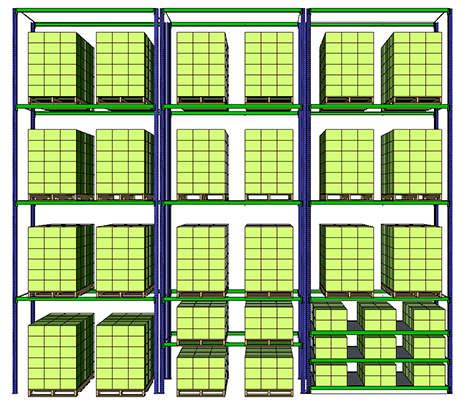
However, we can increase the density of locations by using
- Half Pallet Locations: 2 SKUs per floor pallet location
- Shelves Locations: 9/2 SKU per floor pallet location
Surface Optimisations vs. Number of Replenishment Moves
A major issue with half-pallets and shelves is their limited storage capacity relative to full pallets.
For the same quantity picked per month, you have 2x the replenishment with a half-pallet, and even more with shelves.
Applying the Pareto principle and SKU rotation analysis will help us identify the optimal compromise by selecting the location type according to the rules below.
- Full Pallet/Half Pallet Locations: only for high-runners (Top 20%)
- Shelves Locations: for the 80% low runners, relative to making only 20% of your volume
These thresholds have to be adapted to the specificities of your warehousing operations
- Workforce hourly costs (Euros/Hour) and your productivity for Picking (Lines/Hour) and Replenishment (Moves/Hour)
- Warehouse rental costs (Euros/Sqm/Month)
- Dimensions of your boxes (Width (mm) x Height (mm) x Length (mm)) that will drive your different picking locations' storage capacity
The objective is to find the best trade-off between high replenishment productivity (Full Pallets) and reduced ground surface area (Shelves).
Quick Example based on the layout above
Alley width: 3.05 (m)
Dx: 0.1 (m) Distance between two pallets
Dy: 0.15 (m)
Ground surface occupied(including alley)
Full Pallet = (0,8 + 0,1) x (1,2 + 0,15 + 3,05/2) = 2,5875 (m2)
Half Pallet = 2,5875 / 2 = 1,29375 (m2)
Shelves = 2 x 2,5875/9 = 0,575 (m2)
Warehouse Rental Cost (Jiaxing, China)
C_rent = 26,66 (Rmb/Sqm/Month) = 3,45 (Euros/Sqm/Month)
Forklift Driver Hourly Cost
C_driv = 29 (Rmb/Hour) = 3,76 (Euros/Hour)
Replenishment Productivities
Full Pallet: 15 (Moves/Hour)
Half Pallet: 13 (Moves/Hour)
Shelves : 3,2 (Moves/Hour)
Picking Location Capacity
Full Pallet: 30 (Boxes)
Half Pallet: 15 (Boxes)
Shelves : 4 (Boxes)
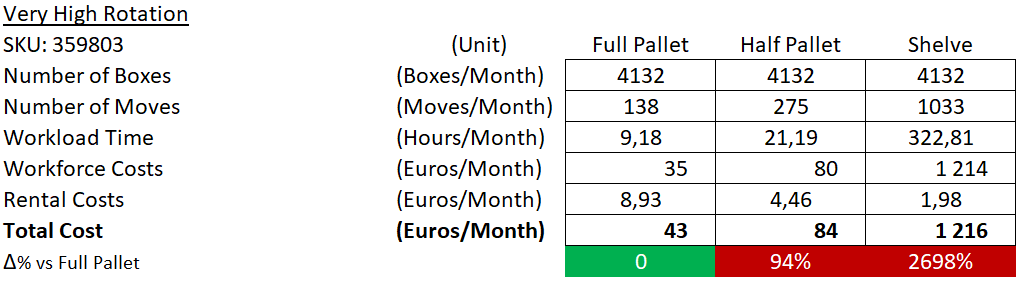
Example 1: Very High Rotation
Example 2: High Rotation
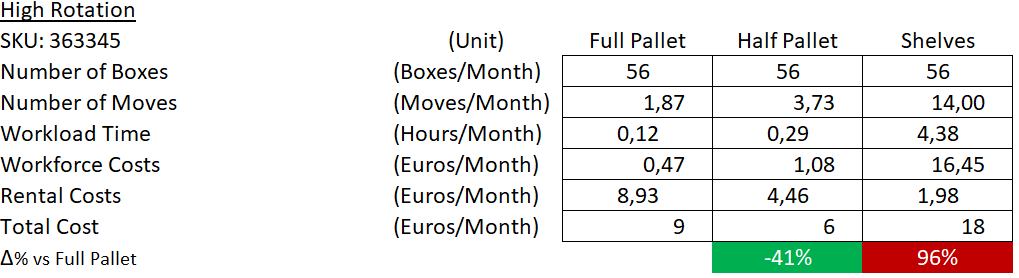
Conclusion
Half Pallet Location is the cheapest solution
Example 3: Low Rotation
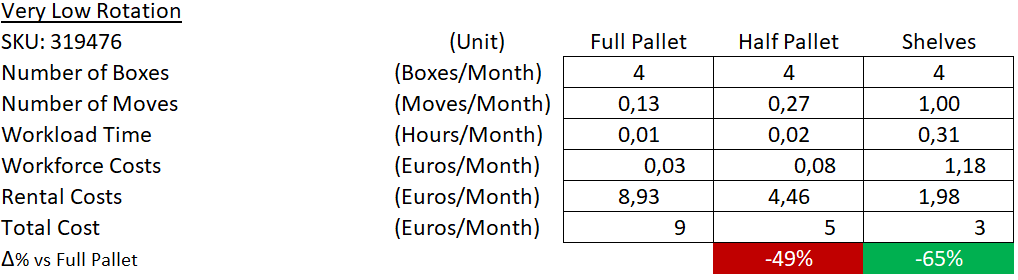
Conclusion
Shelf Location is the cheapest solution
If you want to implement this solution for your warehouse,
Conclusion
This first application of Pareto Analysis shows how product segmentation can support continuous improvement in logistics and supply chain operations.
In another article, we explore another segmentation method called ABC Analysis.
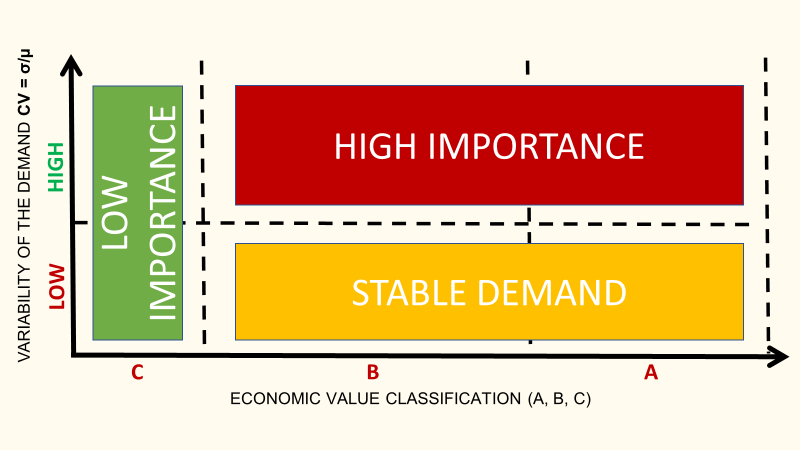
The idea is now to support inventory management by grouping products by importance (% of volumes) and demand variability.
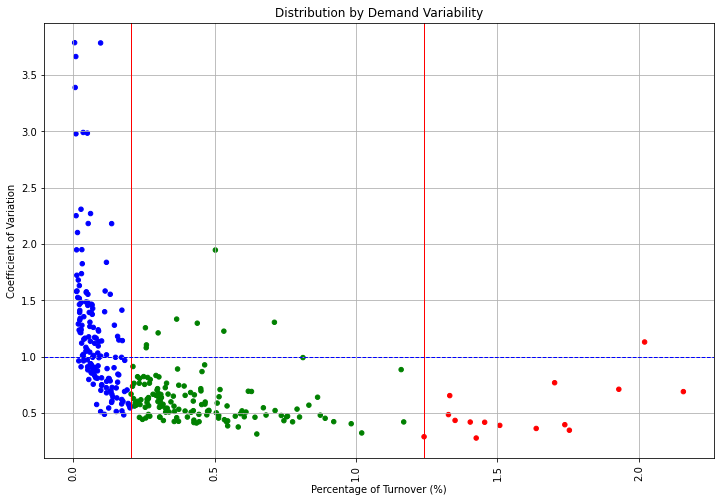
For instance, a product with low turnover contribution and low demand variability will be less important than a fast runner with unstable demand.
This arbitration can be completely automated using the methods presented in the case study linked below.
About Me
Let’s connect on LinkedIn and Twitter. I am a Supply Chain engineer using data analytics to improve logistics operations and reduce costs.
If you’re looking for tailored consulting solutions to optimise your supply chain and meet sustainability goals, please contact me.