
Warehouse Layout Design: How to Size a Warehouse Before You Sign the Lease
How to design a warehouse layout and count its pallet locations before signing the lease: measure what the plan omits, cut the floor into cells, buffer in one direction.
Warehouse layout design is the exercise of deciding where the racks, the aisles, the docks and the working areas go inside a building, and how many pallet locations that arrangement holds.
Most of the time it is asked as a single question, by somebody with a lease in front of them: will everything fit?
I have been sizing warehouses for ten years, in Asia and in Europe, and the temptation is always to answer with a drawing, because a 3D model looks like the professional answer.
It is the wrong deliverable for that question, because a lease decision needs a number you can defend line by line, not a picture that looks plausible.
In this article, I will go through the method I use to design a warehouse layout before a lease is signed.
What to measure on site, how to cut the floor into pallet-sized cells, how to choose the buffers, and how to keep the whole thing cheap enough to re-run inside the meeting.
The scenario: a retailer moving to a cheaper building
A retail company in China had found a warehouse closer to its customers and cheaper than the one it was in.
They had a floor plan from the real estate broker, a current site full of racks and pallets on the ground, and one question: would all of it fit?
Behind that question there is a yes or a no, and a lease with a signature on it, which is why the answer has to be a count rather than an opinion.
The whole study took less than half a day, and the method below is the one I used.
Step 1: find the dimension the plan does not give you
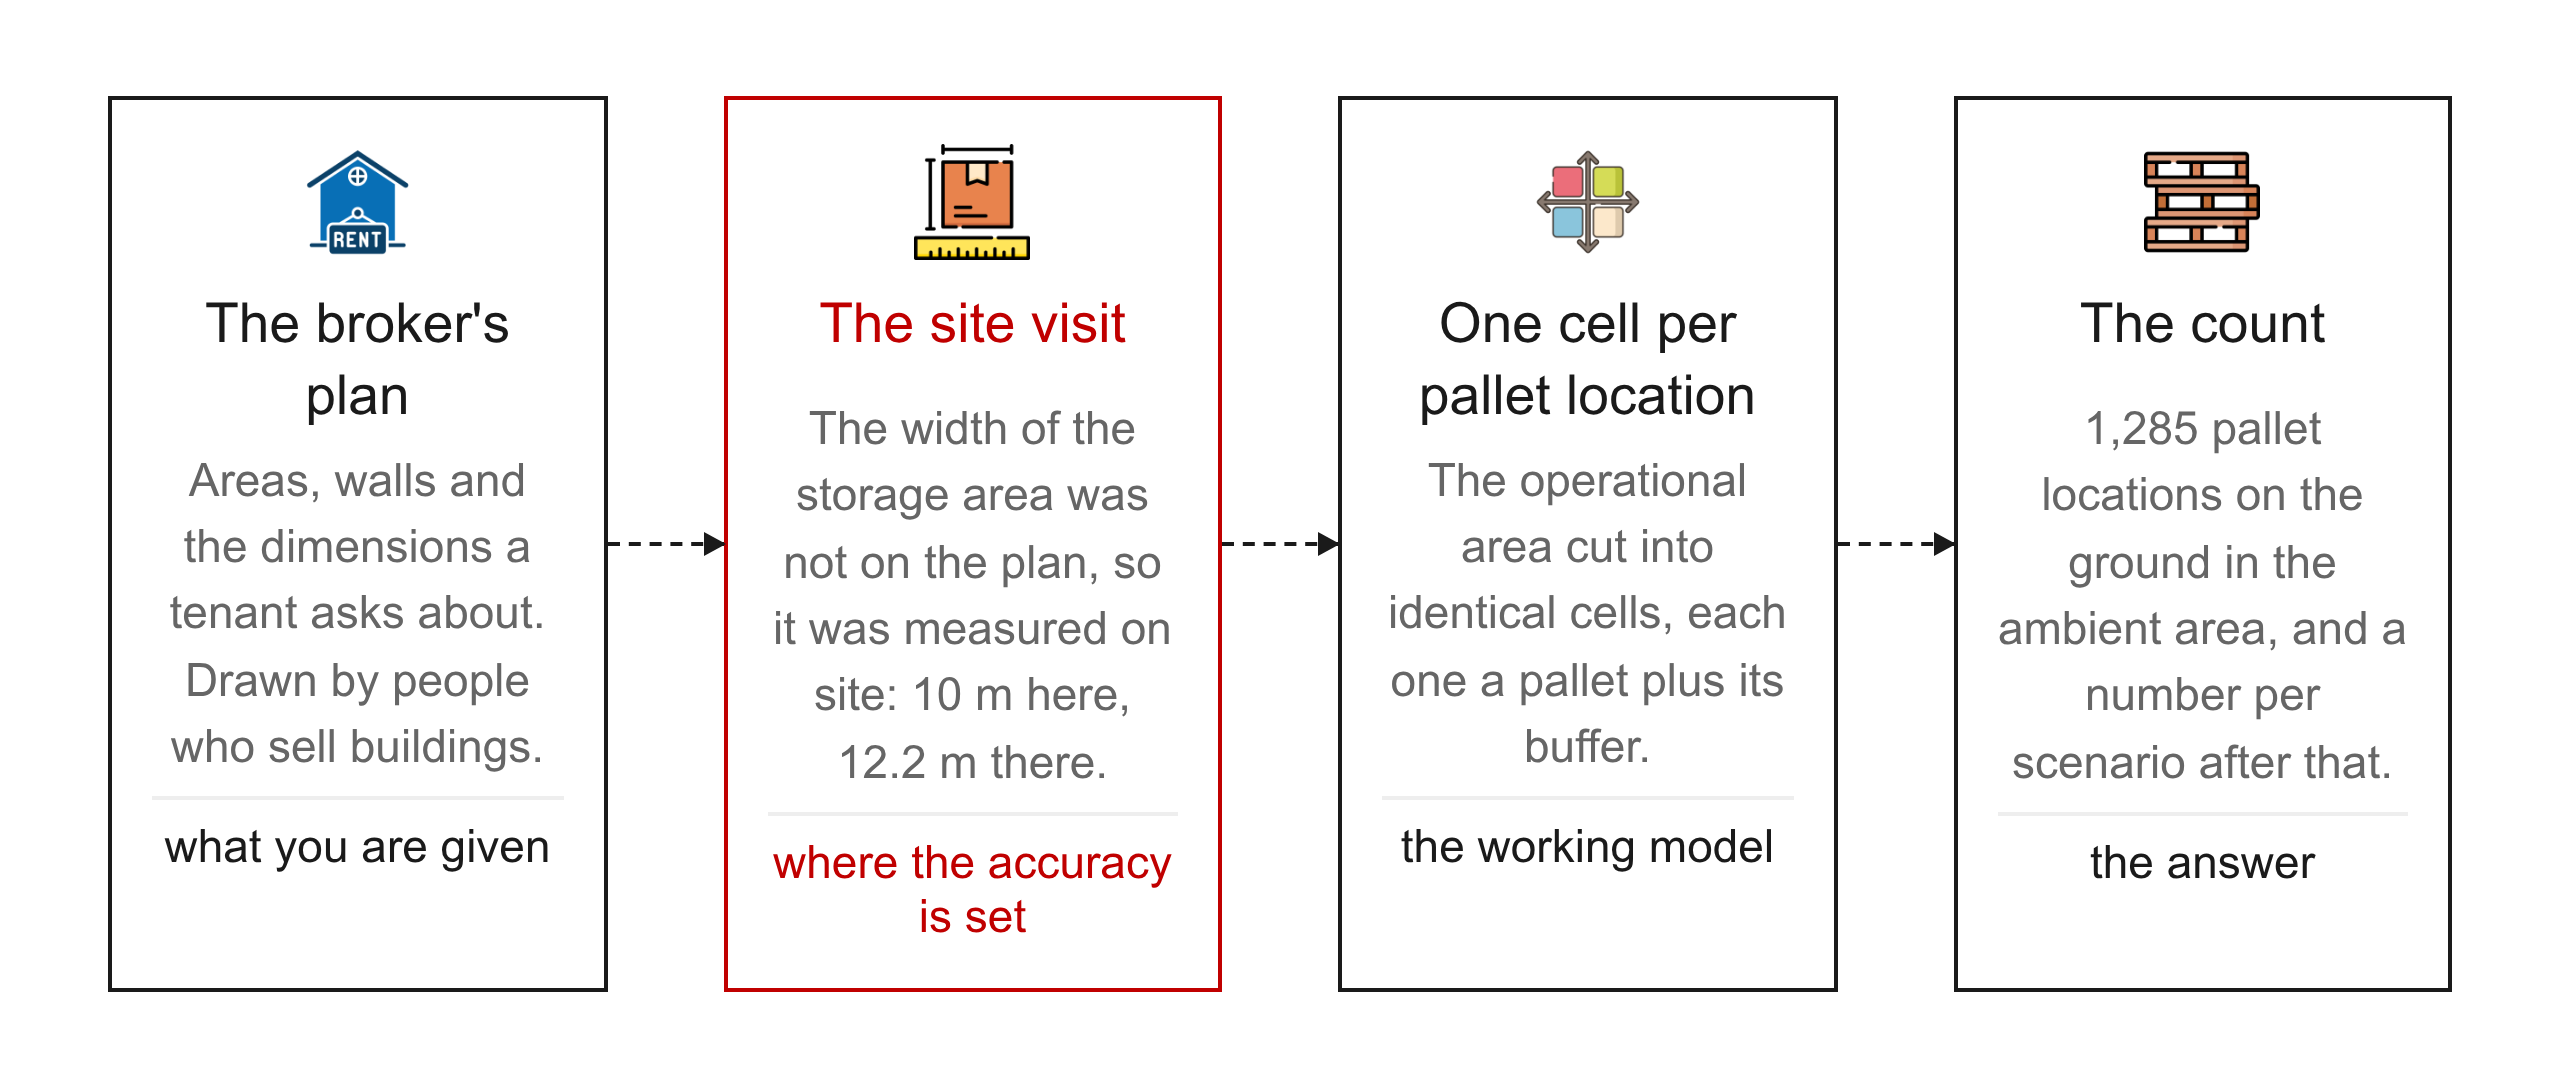
The broker's plan arrives with the areas marked, offices, an equipment room, a property centre, and a set of dimensions along the walls.
The people who drew it sell buildings for a living, so it carries the dimensions a tenant asks about rather than the ones a layout needs.
On that project the plan did not carry the width of the storage area itself.
I knew how large the hall was, and not how much of it was left for pallets once the offices and the equipment room were taken out.
The plan tells you how big the building is. It does not tell you what you can store in it.
The scale is not a defence either, because on a real estate plan it is usually aesthetic rather than measured.
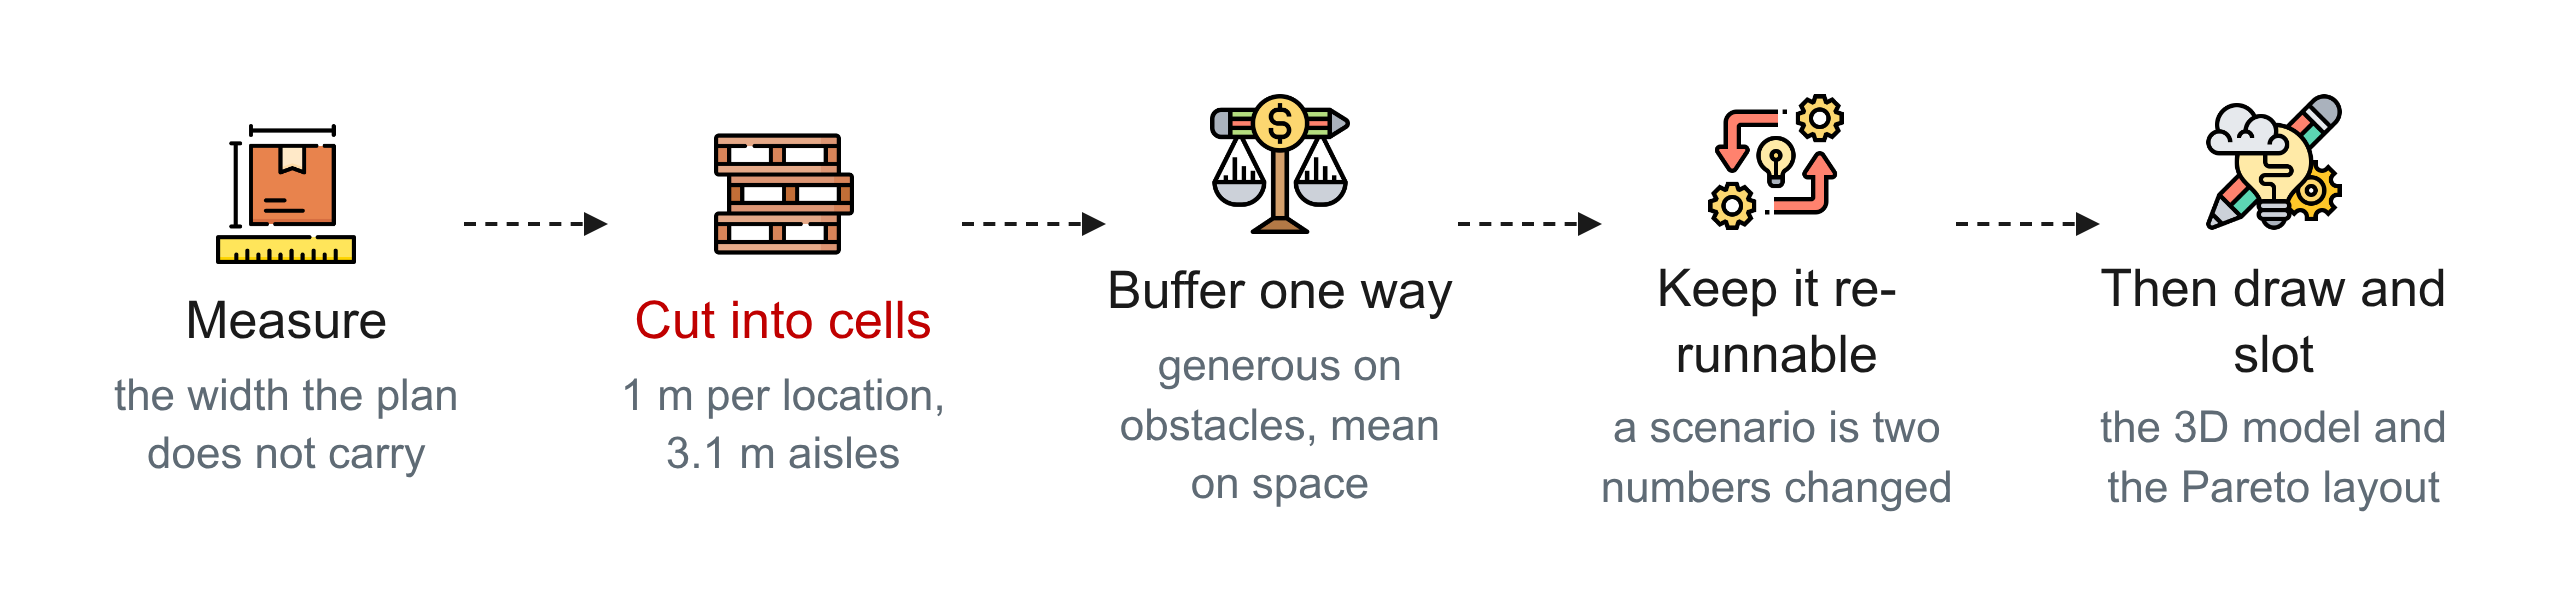
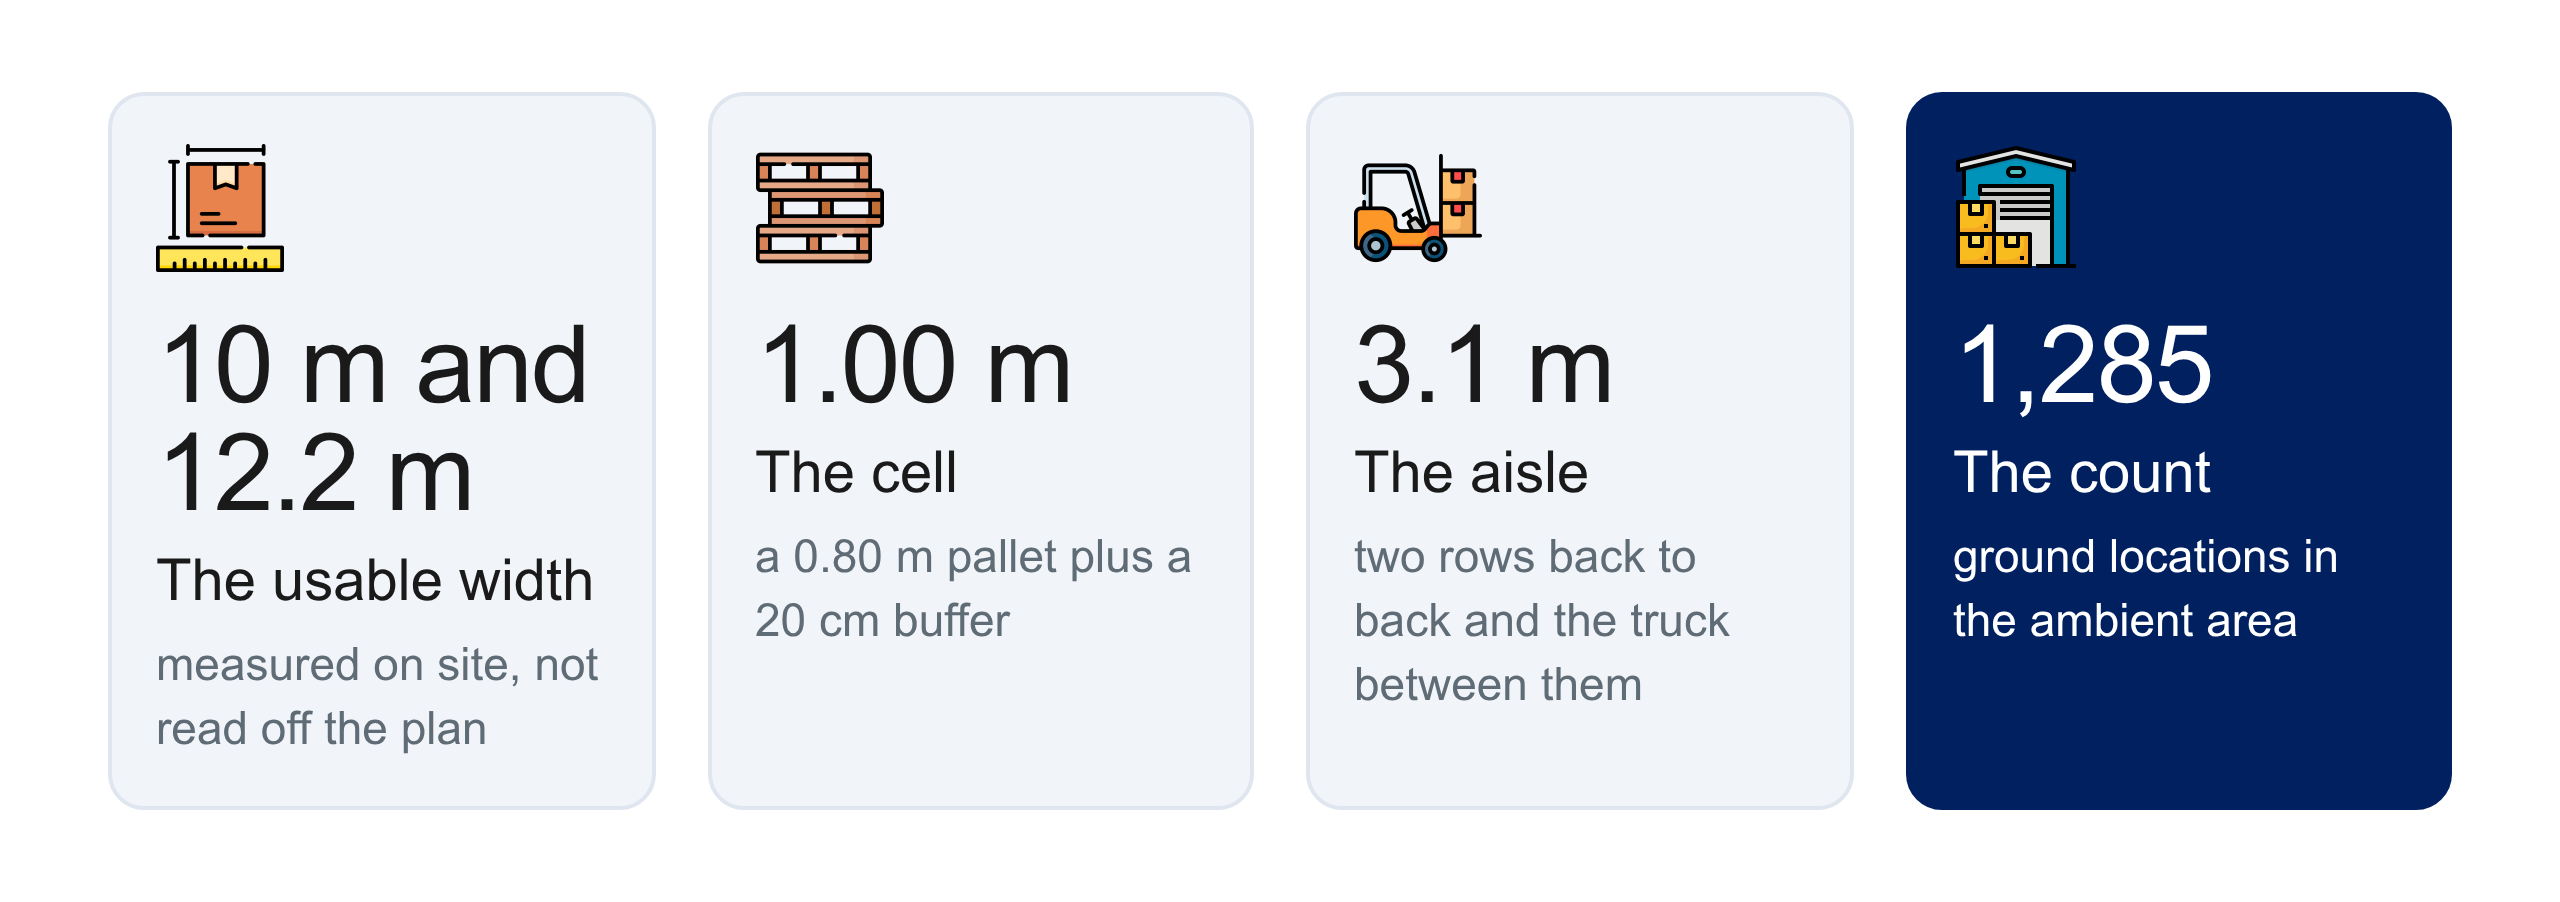
So I went to the site and measured the missing widths myself, 10 m in one place and 12.2 m in another, and that visit is where the accuracy of the whole study is decided.
Step 2: cut the floor into pallet-sized cells
Once the real dimensions are in, the question stops being geometry and becomes arithmetic.
What you are fighting for is floor, because the height of the racks is not what decides whether the stock fits.
The move that does the work is cutting the operational area into identical cells, each one the footprint of a single pallet location.
Once the space is a grid of pallet-sized cells, "does it fit" becomes something you count rather than something you argue about.
The footprint is not the pallet, and that is where these studies go wrong.
A standard pallet is 120 cm by 80 cm, the rack takes slightly more room than the pallet it holds, and two rows placed back to back need an aisle for the truck that serves them.
On that project a location was the pallet width plus a 20 cm buffer, which put it at exactly 1 m.
The aisle sat at 3.1 m rather than the standard 3 m, so that the rows came out even inside the hall.
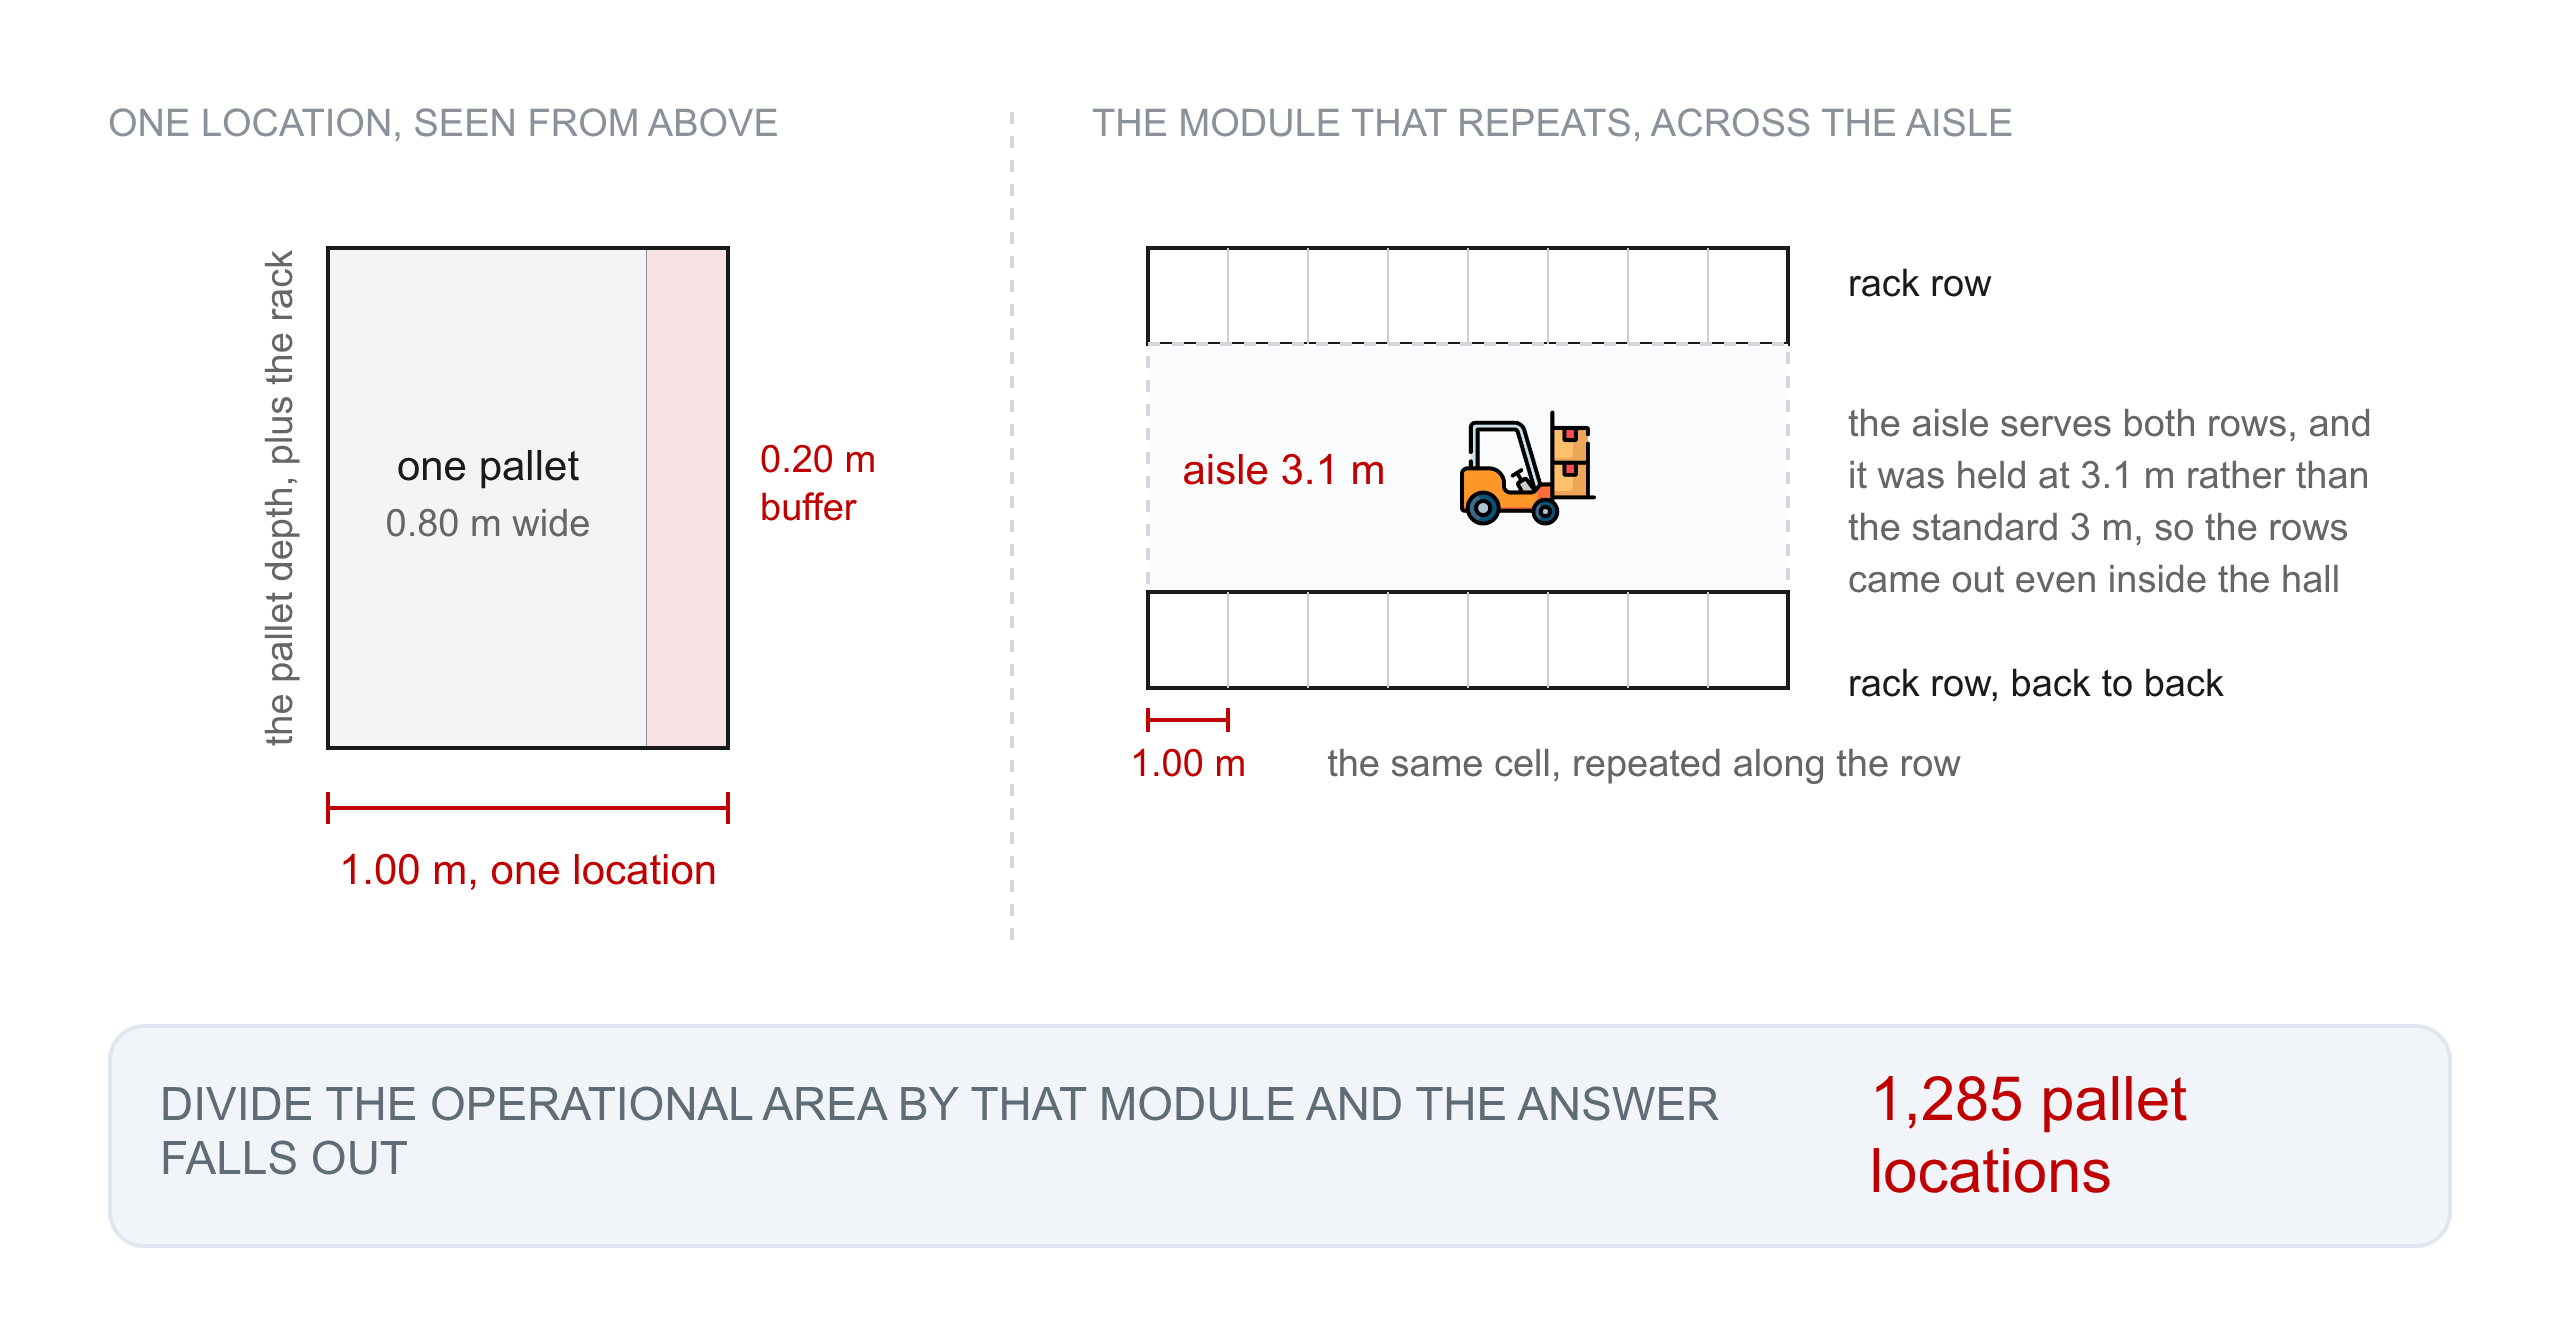
That grid is the deliverable, and the answer falls out of it: 1,285 pallet locations on the ground in the ambient area.
Step 3: choose the buffers, and choose them in one direction
Every dimension in that grid can be argued down.
Take 15 cm of buffer instead of 20 cm, hold the aisle at exactly 3 m, and the count goes up without anything being redrawn.
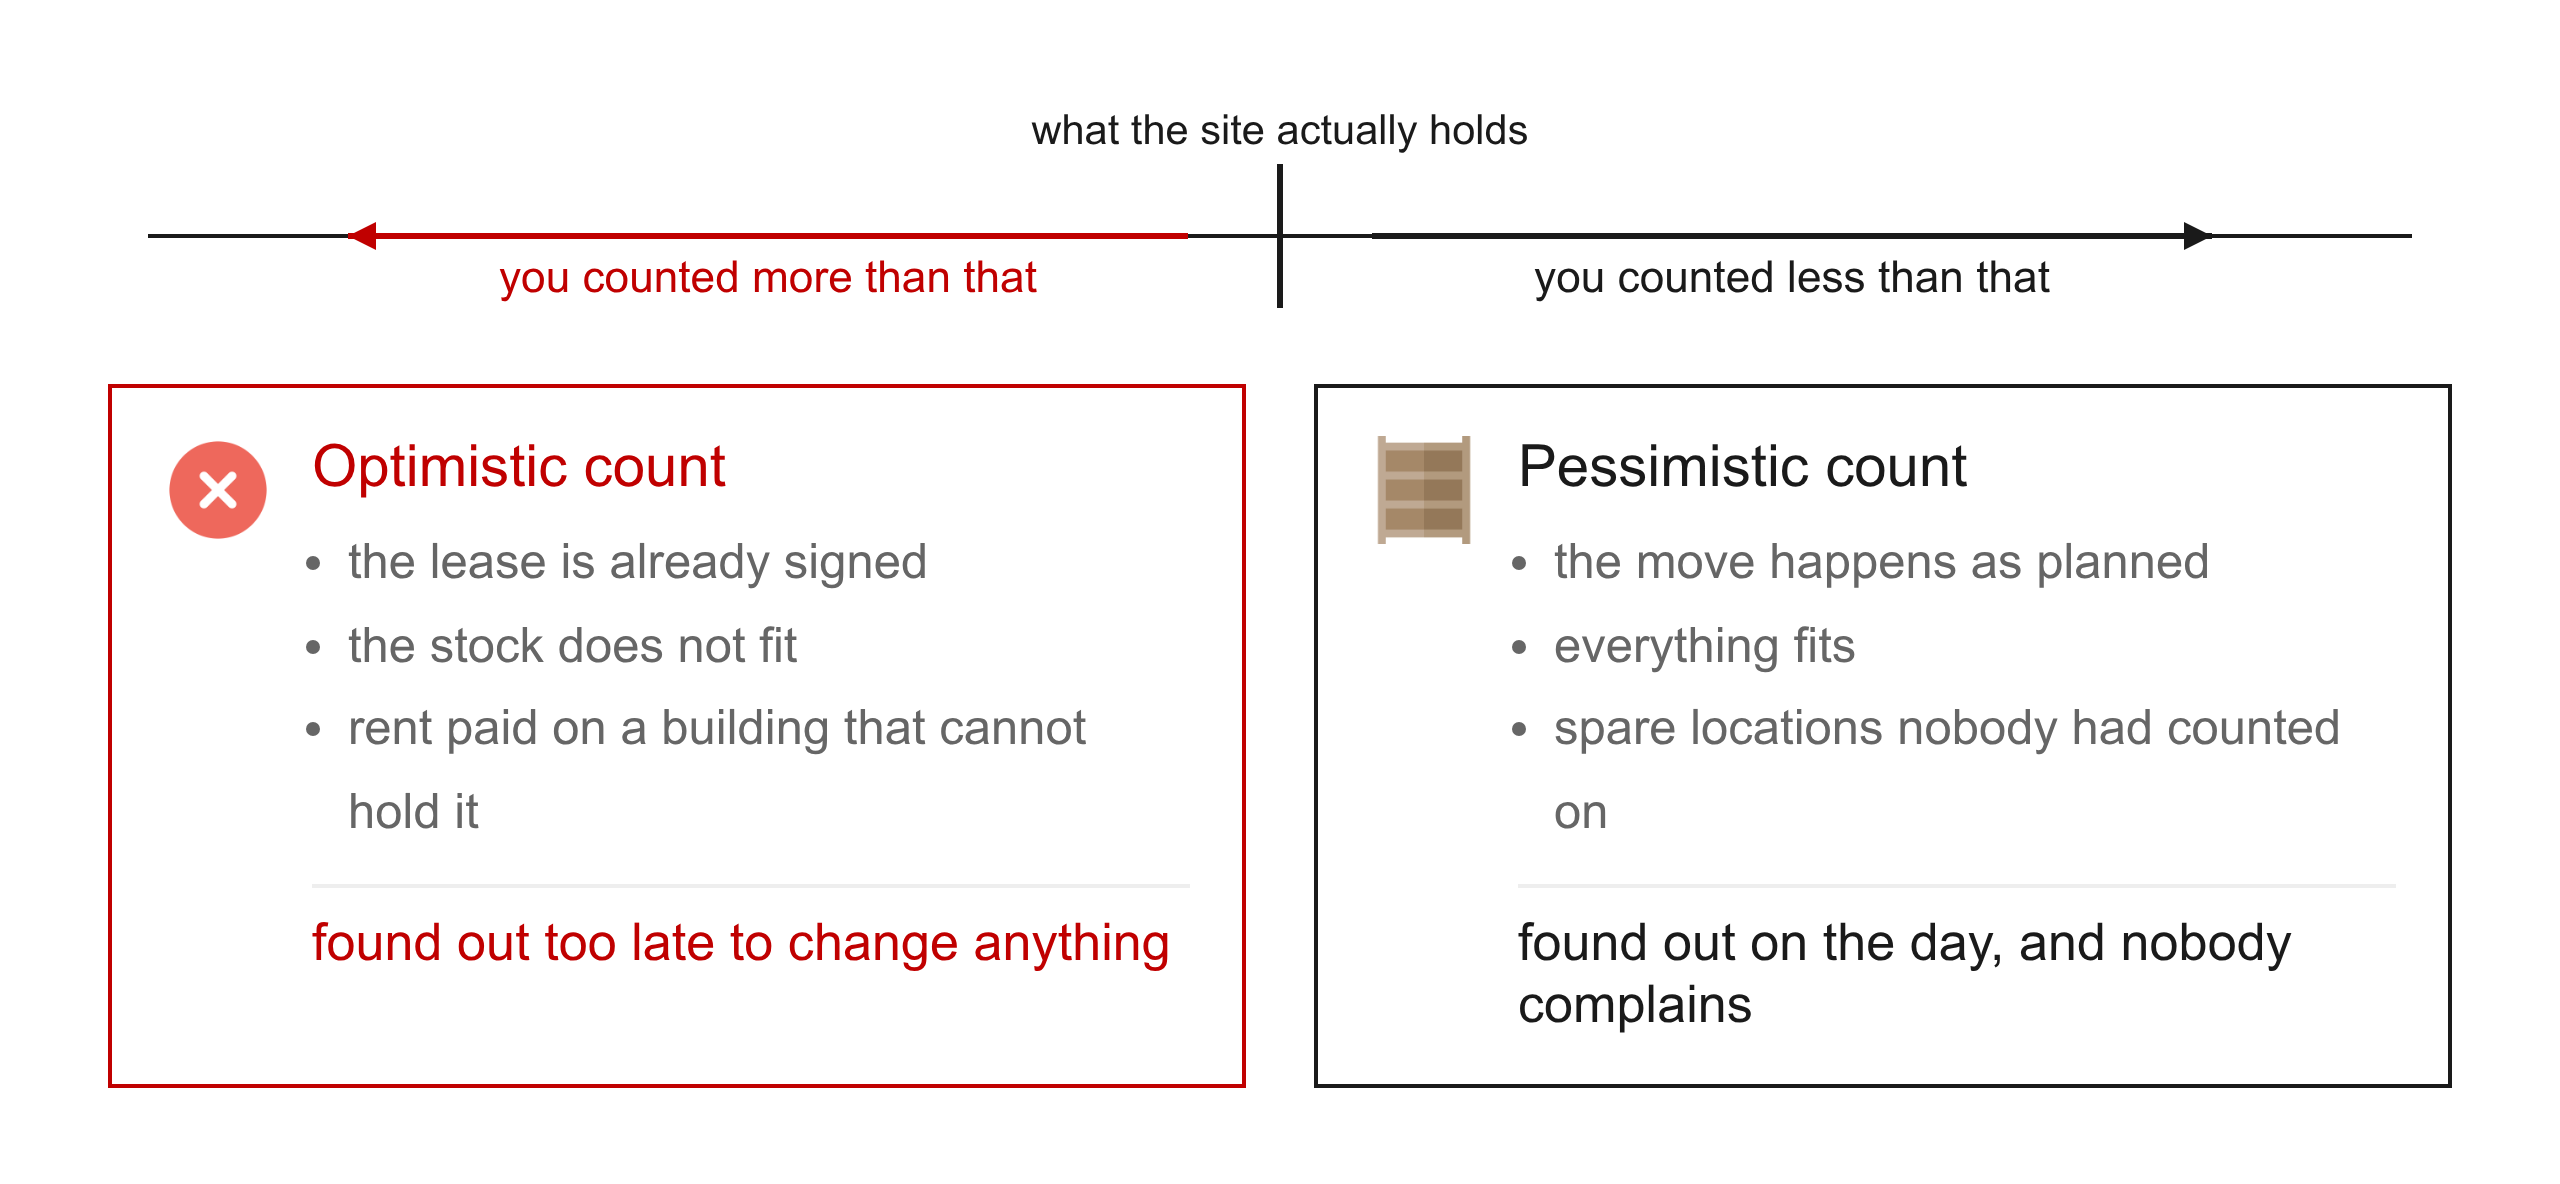
If your count is optimistic and the operation finds out after the lease is signed, they are paying rent on a building that does not hold their stock.
If it is pessimistic, they move in and find space they had not planned on.
The two errors do not cost the same, so the honest answer is deliberately the low one.
This is why the buffers always go the same way, generous on the obstacles and mean on the usable space.
The surprises point in one direction only: a pillar that was never drawn, a dimension somebody rounded, an area that turns out to be unusable once you stand in it.
And the buffer is not chosen alone, because 20 cm rather than 15 cm was agreed with the operations manager.
That is the person who has to work inside the aisle you drew, which makes it their number as much as yours.
Step 4: keep it cheap to re-run
A feasibility answer is never accepted on the day it is produced.
Decision makers take a few days, and in those days somebody asks what happens with a different pallet, or with narrower aisles, or if the chilled area grows, and each of those is a new count.
The study is only useful if the new count takes minutes, which is the real argument for keeping the whole thing in a spreadsheet, and it has very little to do with the tool being simple.
Every dimension is a parameter, the count follows from the parameters, and a scenario is two numbers changed rather than a drawing redone.
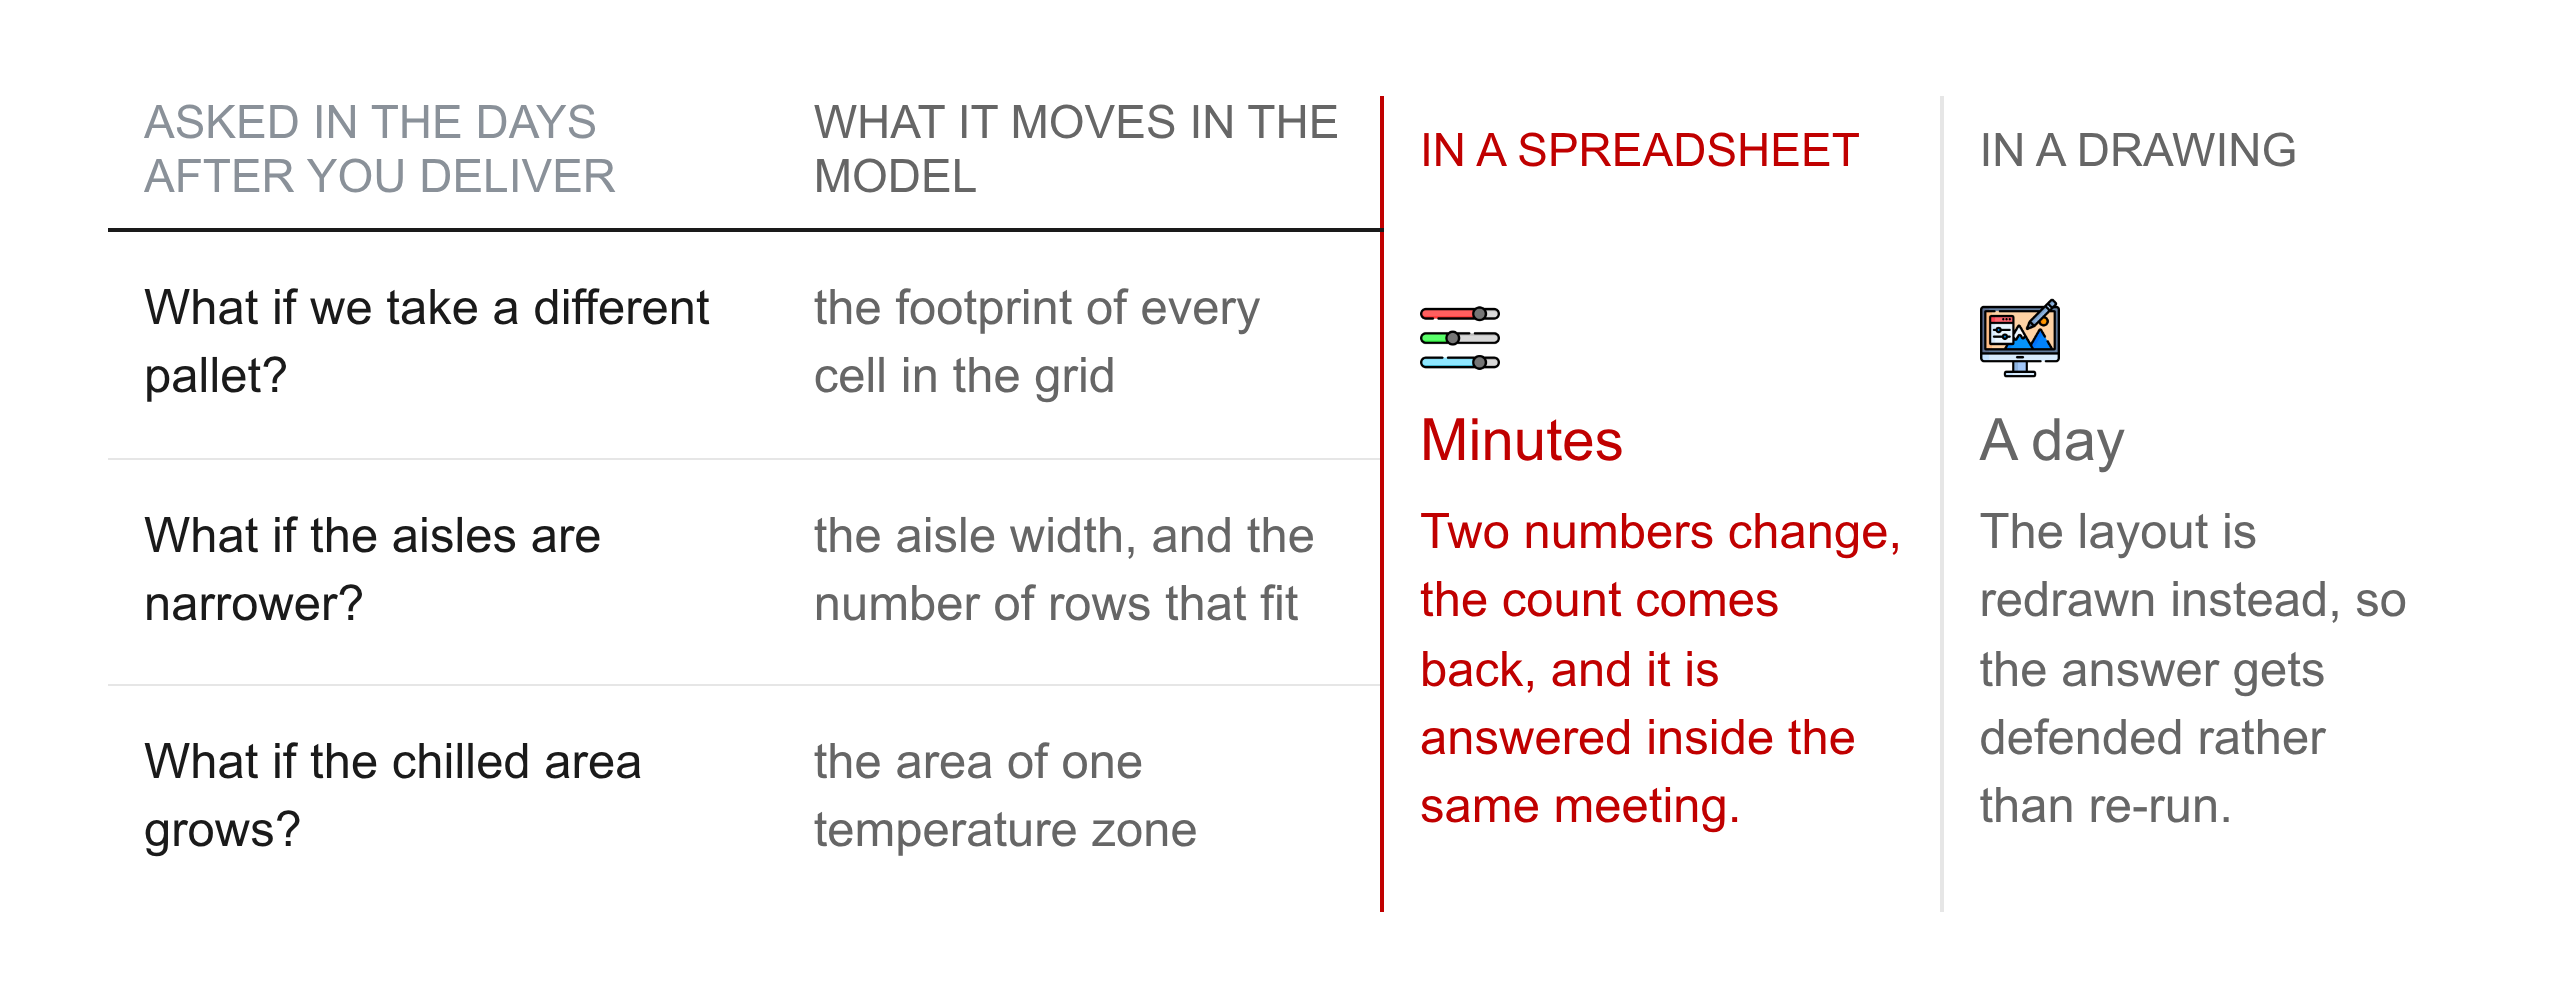
A model you can re-run inside the meeting gets challenged. A model that takes a day gets defended instead.
What the decision makers receive is the same every time: the hypotheses you took, the area of each hall, the buffer you added, and the pallet count per temperature zone.
Step 5: only then, the drawing and the slotting
None of this makes the 3D tools useless, and I still use them.
Once the site is validated, the precise layout goes into a proper drawing tool, and that version is what sells the solution internally to a management committee.
Which products then sit in which locations is a separate exercise, and the high rotation references earn the positions closest to the packing area.
That is the Pareto principle applied to the layout, because in most operations 20% of the references generate 80% of the picking volume.
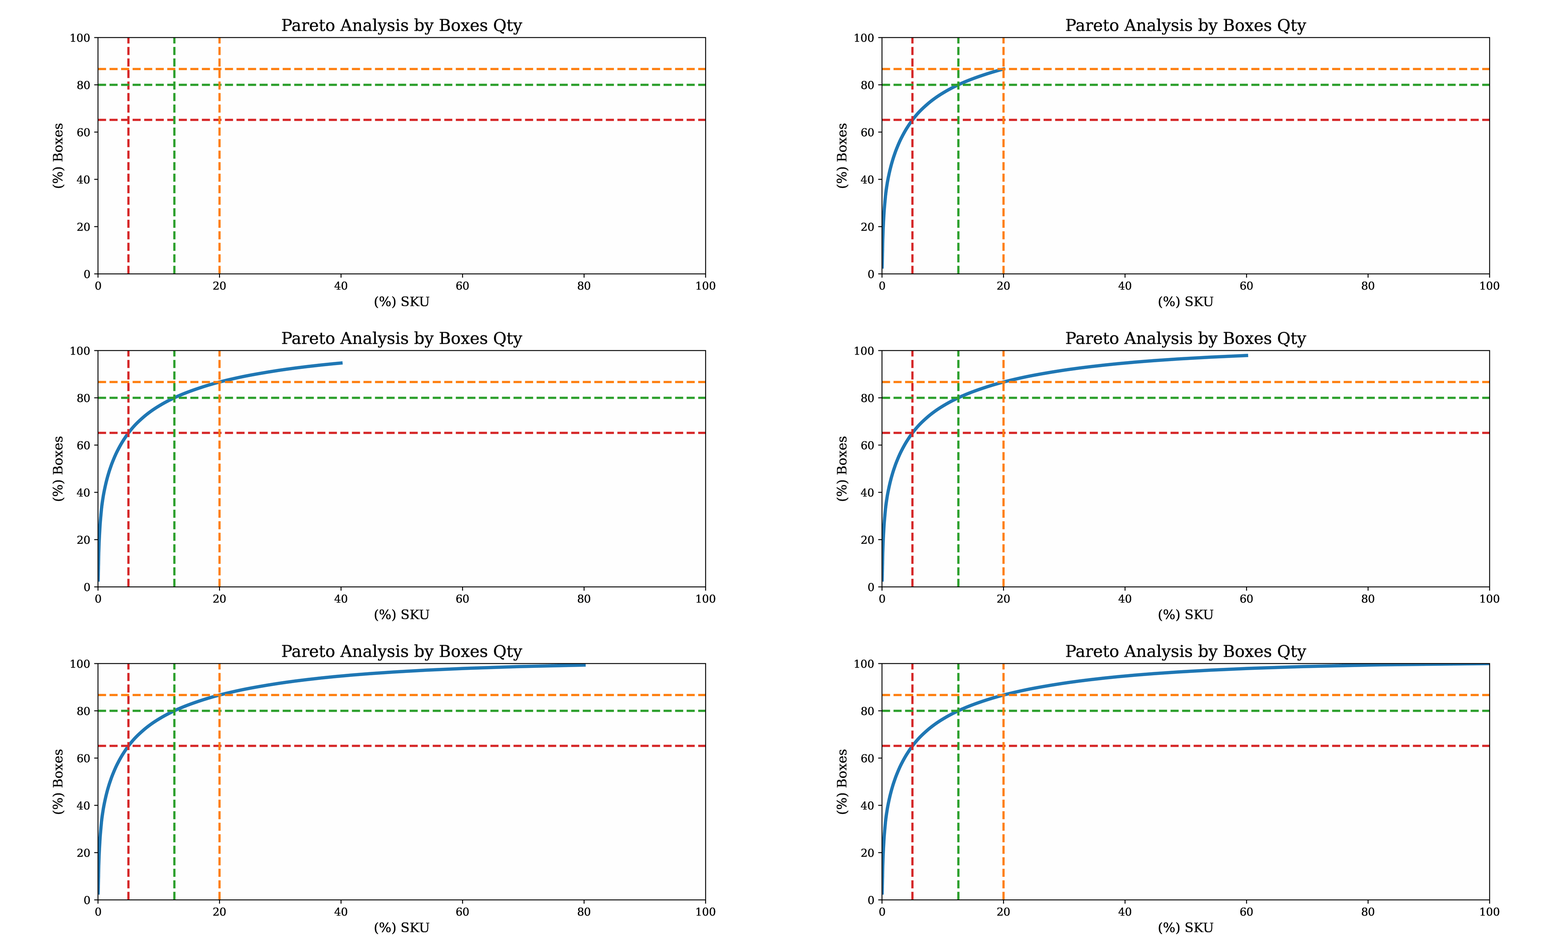
From there the layout feeds every productivity study that follows: order batching and spatial clustering both take the grid as their input, and the picking route is computed on it.
What a generative model does not help with
That project is seven years old and generative models did not exist when I ran it, and having used them since, the hard part is unchanged.
The hard part was noticing that the plan was missing a width, going to the site to get it, and agreeing a buffer with the person who runs the operation.
A model can produce a plausible arrangement of racks from the plan you hand it, and plausible is the exact failure mode.
You are going to defend a number that decides whether a company signs a lease, and every centimetre of it has to trace back to something you measured or agreed.
The output of this exercise is a number you are prepared to be wrong about in public.
The full method on video
I recorded the whole study on that project, from the broker's plan to a layout with every pallet counted, in sixteen minutes.
What you need before you start: the floor plan of the site, and a visit to collect the dimensions it does not carry.
Then the pallet count and rack setup you have today, and a pallet footprint with a safety buffer agreed with your operations manager.
Conclusion
Warehouse layout design, when the question is whether the stock fits, is a count and not a picture: measure what the plan leaves out, cut the floor into cells, buffer in one direction, and keep every number a parameter.
What we covered in this article
The dimension the broker's plan does not give you, the pallet cell and the 20 cm that decides the count, and why the buffers all go the same way.
Why the study has to be re-runnable in minutes, and where the drawing and the slotting come afterwards.
Where to go next
The wider picture of what happens between the docks is in warehouse operations explained, and once the racks are in, the value added services scheduling and container loading case studies pick up where the layout stops.
If you want to test yourself on the vocabulary first, the Supply Science App has a warehouse layout quiz.
Related videos
The videos behind this article, already on the channel:
- Understand the Pareto Principle for Warehouse Layout Optimization
- 20% of Your SKUs Are Doing 80% of the Work
- Understand Warehouse Costs Optimization
The ones coming next, with the date each goes public:
- Why the Wooden Pallet Runs the World, 16 December 2026
- Storage Location vs Picking Location, 13 January 2027
- The Pareto Rule for Warehouse Layout, 27 January 2027
About Me
Let's connect on LinkedIn and Twitter. I am a Supply Chain Engineer who is using data analytics to improve logistics operations and reduce costs.