How Will Data Science Accelerate the Circular Economy?
Actionable data science tips to overcome the operational challenges in transitioning to a circular economy.
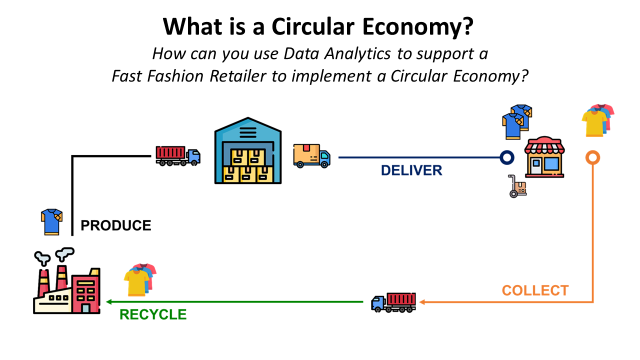
A circular economy is an economic system where waste is minimized and resources are continuously reused or recycled.
Imagine a world where your waste doesn’t end up in landfills but rather becomes the raw material for new products.
The transition from our current linear economy to a more sustainable circular one is a major topic for many companies.
What is holding us back?
As the current linear economic model reaches its limits, discussions around new circular business models become more and more prominent.
These discussions mainly focus on
- The operational and business obstacles blocking the transition
- Alternative strategies to increase the use of recycled materials
- Rental models to reduce the environmental footprint
As the analytics manager of a retail company, how can I support this transition?
Analytics experts can leverage the data generated by systems to overcome these barriers by identifying opportunities to create a sustainable and profitable circular supply chain.
In this article, we will step into the shoes of an analytics manager tasked with supporting the operational transformation of a fashion retail company.
💌 New articles straight to your inbox for free: Newsletterto
I. Transition to a Circular Economy
1. What is the environmental impact of a T-shirt?
2. Data-driven Process Design
II. Overcoming the Operational Challenges
1. The Opacity of Supply Chain Networks
2. The Low Residual Value of Used Products
III. Material Efficiency & Recycled Materials Usage
1. Raw Material Optimization with Linear Programming
2. Supply Chain Network Optimization
IV. Conclusion
Transition to a Circular Economy
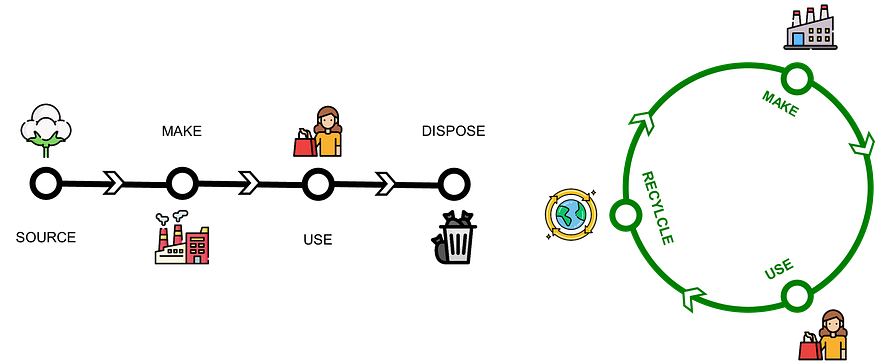
The evolution from a linear model to a circular economy is an ongoing process with significant business and operational implications.
This shift is not just about waste management or recycling.
It requires a holistic change in how we design, produce, sell and use goods or services.
Before implementing a circular economy, the first step is to estimate the environmental impact of our current linear model.
What is the environmental impact of a T-shirt?
Let’s take the example of a T-shirt you bought in a fast-fashion store.
What is its environmental impact along its life cycle?
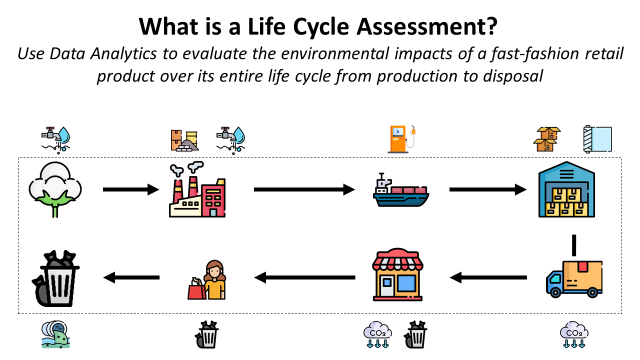
Life cycle assessment (LCA) is a methodology for evaluating the environmental impacts of a product or service throughout its life cycle.
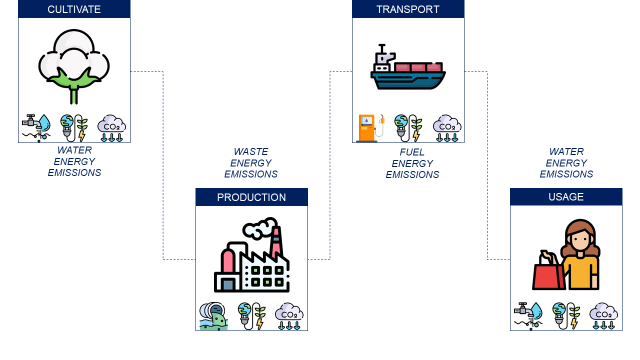
- Raw materials are sourced from different suppliers that use natural resources and energy.
- Manufacturing sites transform these materials into finished products using natural resources while emitting pollutants and CO2
- Finished products are delivered to stores and sold to final customers
- Customers are using the products until disposal
How can we support the automation of Life Cycle Assessment?
This descriptive analytics methodology can be automated using Business Intelligence solutions implemented by our analytics team.
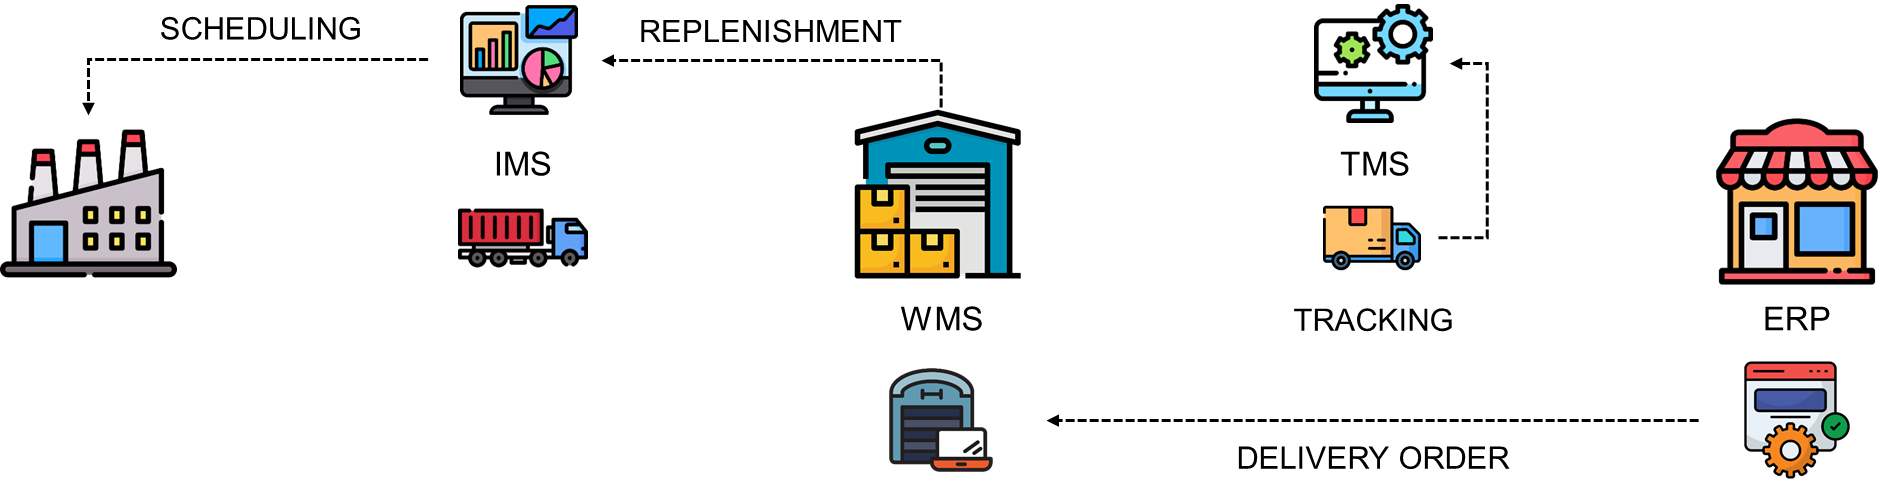
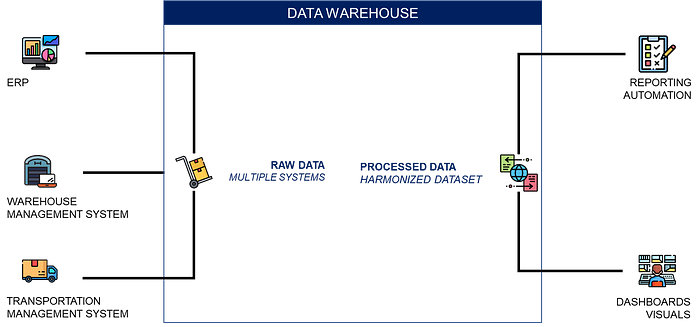
The challenge is to collect and process transactional data
- From different systems that may not communicate with each other
Factory Management Systems vs. Warehouse Management Systems - With different formats (Unstructured vs. Structured)
Excel Utility Usage Reports vs. WMS Transactional Database(s)
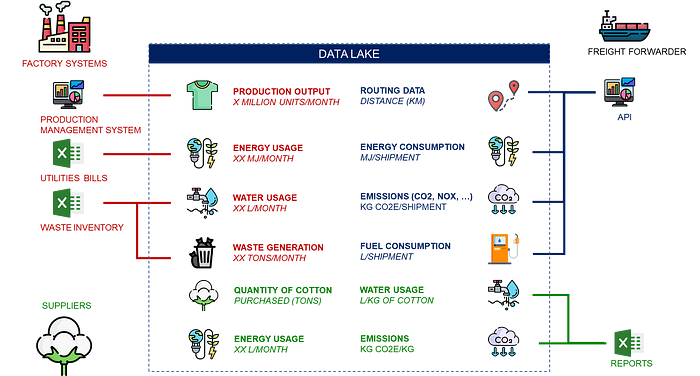
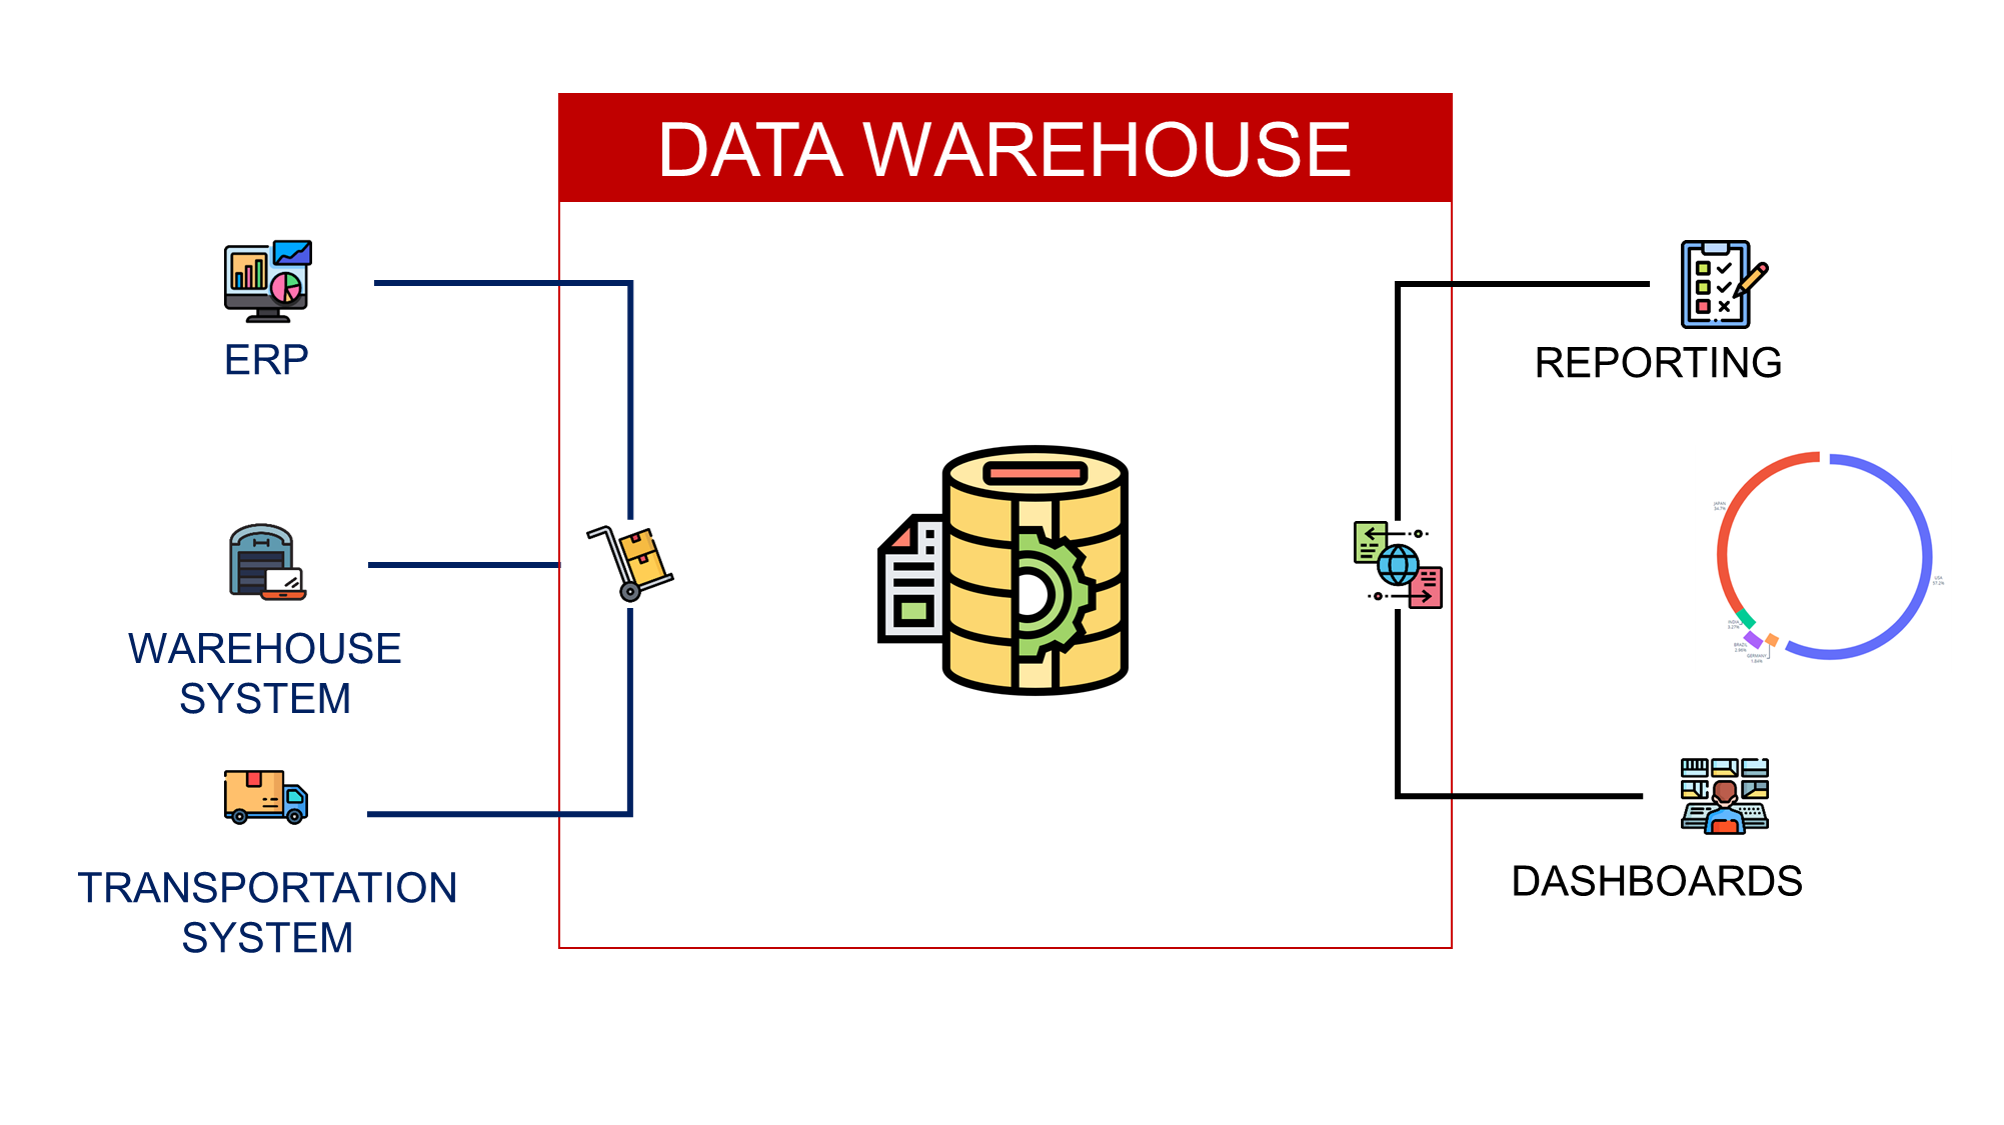
💡 Data analysts and engineers can implement pipelines using a central data warehouse to collect and process raw data to feed LCA calculations.
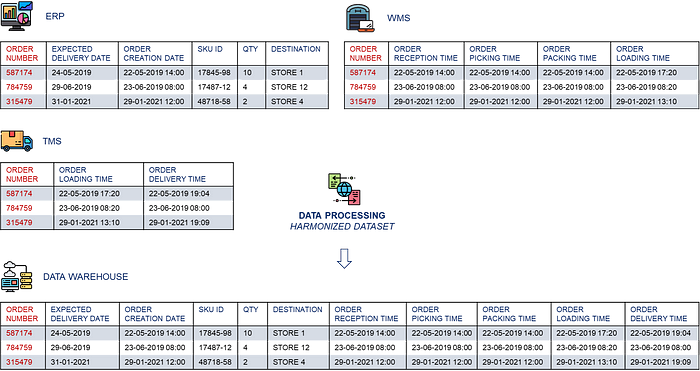
The final result can be a self-service database of harmonised tables containing transactional records covering the full cycle from raw material collection to store delivery.
💡 For more details,
Your sustainability department can then use these tables to run calculations and estimate the resource usage or CO2 emissions of each process.
What can we do to reduce our environmental footprint?
Data Analytics for Solution Design
Now that you have automated the Life Cycle Assessment, your sustainability team has established the baseline.
The total CO2 emissions for 2022 are 75k Tons CO2eq.
In line with the United Nations Sustainable Development Goals (SDGs), your company committed to a 30% reduction by 2023.
The next step is to build a roadmap to reach this target.
I have previously shared data-driven methodologies to implement decarbonization initiatives
- Sustainable Sourcing: select the set of suppliers that minimises the environmental impact of your raw materials sourcing
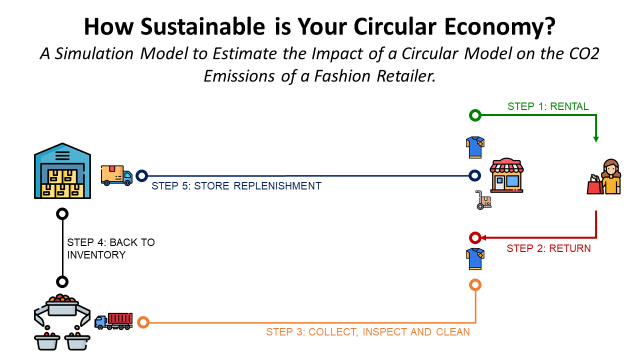
- Circular Economy: create a logistic chain to collect and reuse returned items from customers to save raw materials
Implementing a circular model can yield the highest carbon emissions reductions, as it directly affects the product.
However, the case studies above focused on generating insightful prescriptions using advanced analytics.
Now that your model told us what to do. How can you support the implementation?
Because such a transition can completely disrupt your current supply chain operations, Logistics operations will expect support to ensure a smooth implementation and avoid disrupting the business or impacting profitability.
In the next section, we will see how data science can support this operational transformation.
Overcoming the Operational Challenges
While the shift to a circular economy looks promising, it comes with various operational challenges.
The Opacity of Supply Chain Networks
This is the major barrier to the transition towards a circular economy.
In traditional linear economies, the origin and journey of goods from raw materials to the final product are often obscure.
Your company might not have a clear understanding of its supply chain beyond their immediate suppliers and customers.
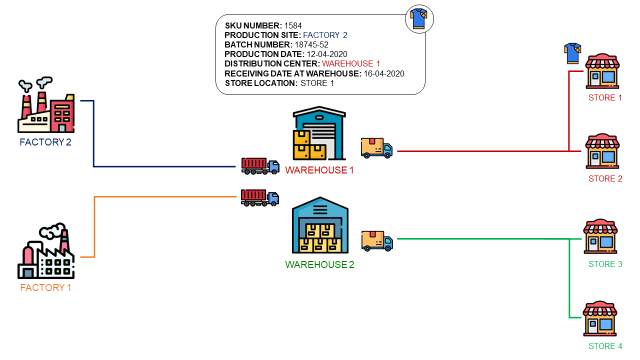
- Can you track the production facility of any item sold in your stores?
- Can you link a finished product leaving the factory with the batch of raw materials used to manufacture it?
A lack of transparency makes it difficult to trace products back to their source.
This is creating a stumbling block in adopting circular economic practices.
In a circular economy, understanding the lifecycle of a product (from raw materials to disposal) is crucial for implementing efficient recycling and reusing strategies.
With opacity, we cannot ensure that materials are being sourced sustainably, used efficiently and recycled properly.
You might also be missing opportunities to reduce waste, streamline operations and use resources more efficiently
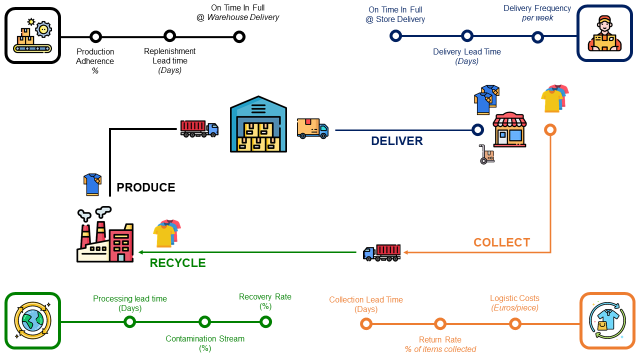
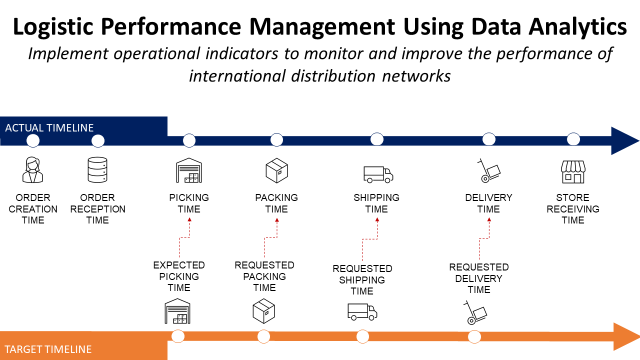
An optimal circular economy would require a minimum set of performance indicators, like
- Tracking of production and transportation KPIs with
Production Adherence (%), Replenishment Lead Time (Days) - Measuring the performance of reverse logistics with
Logistic Costs (Euros/piece), Ratio of Returned Items (%) and Collection Lead Time (Days) - Identifying potential improvements for the recycling process with Recovery Rate (%), Contamination Stream (%) and Processing Lead Time (Days)
These KPIs, covering logistics and manufacturing, require data from multiple systems with different data formats and database structures.
💡 Your team can play a crucial role in addressing these issues by
- Connecting to systems that track your products along the value chain and gathering data with timestamps
- Store and process this data to create a central source of information that can be used to create reports, dashboards and optimisation models
- Implement automated reporting tools with KPIs designed by the Supply Chain and Sustainability teams
This comprehensive view allows for the identification of inefficiencies, provides traceability to customers, and facilitates the transition.
💡 For more analytics solutions for supply chain traceability,
The Low Residual Value of Used Products
In our existing linear economy, products are designed for consumption and disposal rather than for reuse or recycling.
The product residual value refers to the remaining worth of a product after it has been used and has completed its initial lifecycle.
Once used, these products often have little residual value.
How can we design a profitable circular model?
Therefore, the costs of collecting used products for recycling often outweigh the value of the materials recovered.
This endangers the economic viability of circular business models and discourages businesses from transitioning.
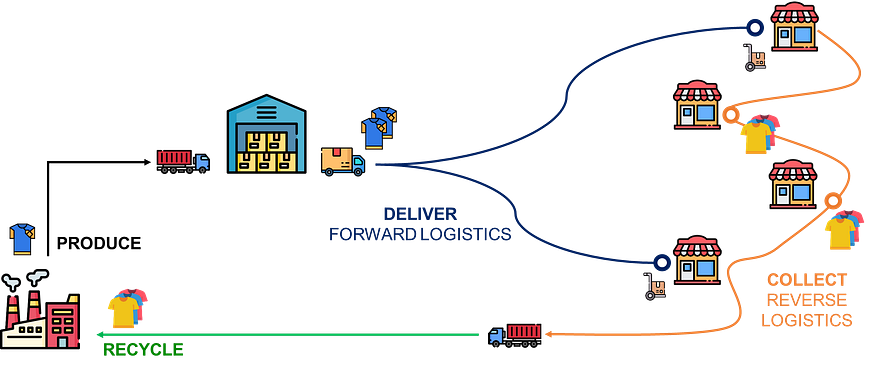
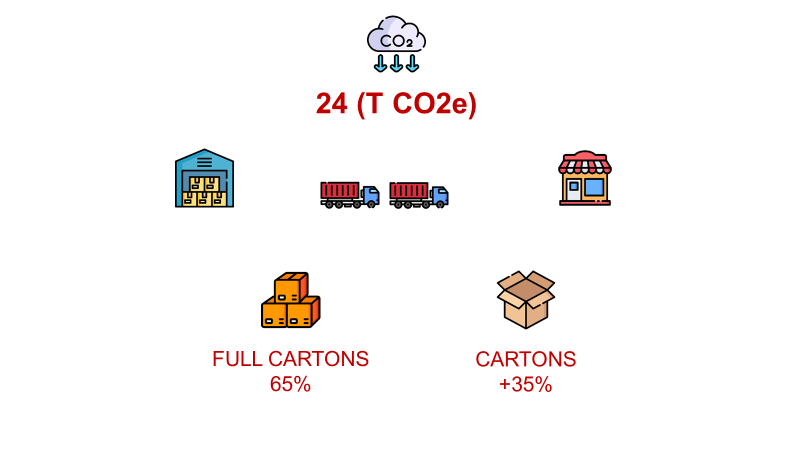
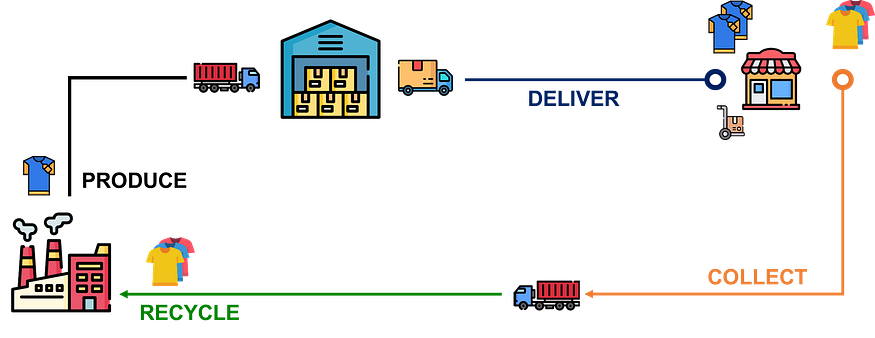
For instance, if we take the example of our T-shirt
- Forward Logistics is cost-efficient as we are delivering t-shirts by full containers with large trucks using optimized routing
- Reverse Logistics, in comparison, is extremely expensive as we collect used garments by piece with complex sorting and recycling flows that require customized processes
As reverse logistics operations can become extremely complex, it’s easy to face the situation that recycling becomes more expensive than disposal.
💡 Data analytics can play a crucial role in addressing these issues
- Streamline reverse logistics operations using optimization models to minimize the cost of collection and sorting of used items
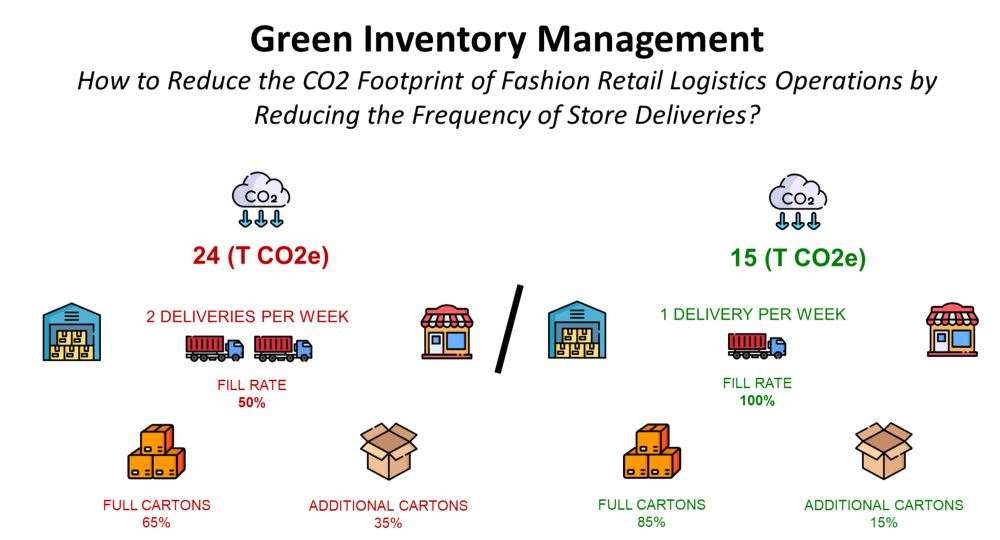
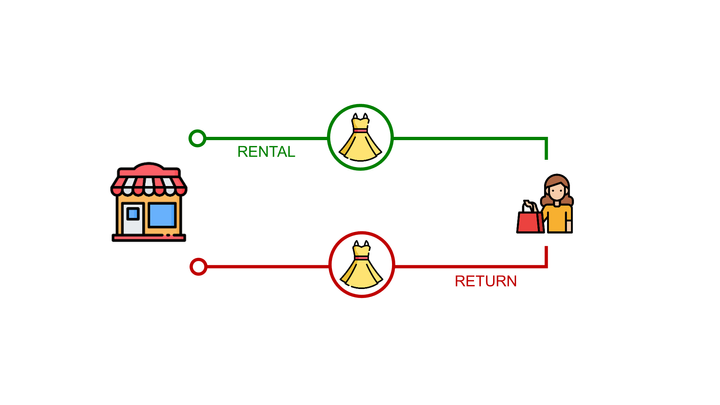
- Designing alternative business models like subscription models for which items are rented instead of sold
With these additional simulation models, you can support the implementation of a profitable reverse flow to recycle (or reuse) your products.
Material Efficiency & Recycled Materials Usage
As we move towards a circular model, material efficiency becomes a predominant concern.
Making products with fewer materials and minimising waste in production processes can bring substantial economic and environmental benefits.
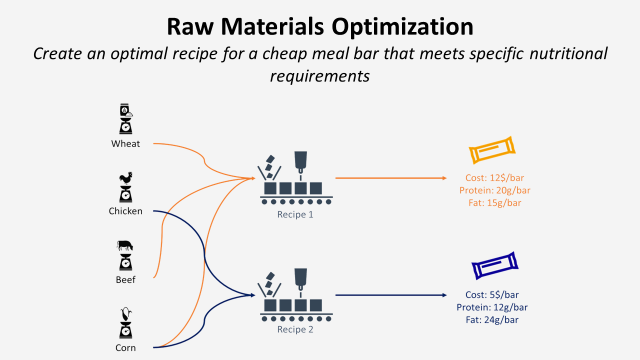
Raw Material Optimisation with Linear Programming
Efficient use of materials can drastically reduce waste and support the sustainable use of resources.
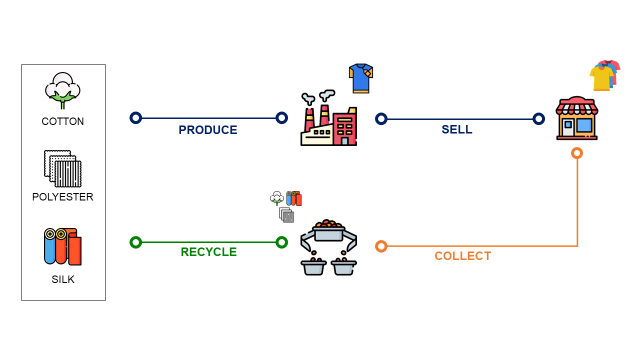
We have different types of fabric at our disposal, including cotton, polyester, linen, and silk.

Each type of fabric has different costs and attributes, such as durability, comfort and environmental impact.
The manufacturer's goal is to minimise overall production costs while meeting required quality and sustainability standards.
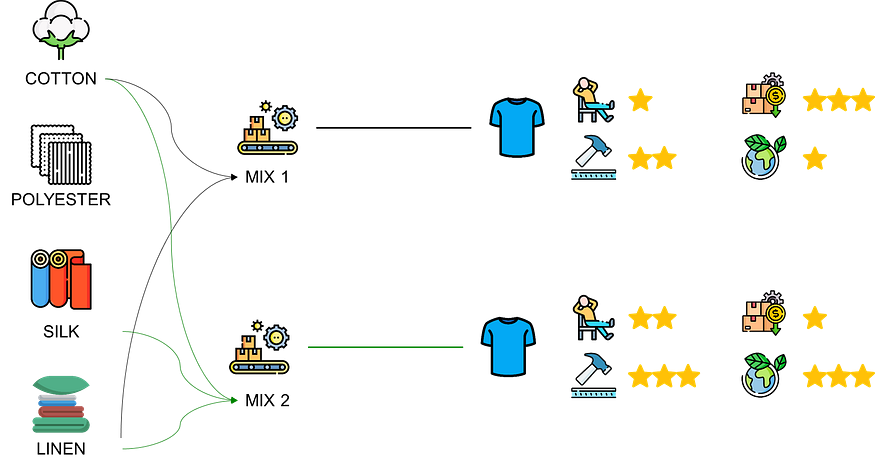
What is the best mix to meet our profitability and sustainability goals?
This is a multi-dimensional optimization problem where we are trying to optimize for cost and sustainability under certain constraints.
Example of T-shirt manufacturing
Let us imagine a scenario in which the T-shirt must contain
- At least 40% cotton for comfort
- Not more than 30% polyester due to sustainability guidelines
- Silk must not exceed 10% of the total material
This problem can be modelled and solved using linear (or non-linear) optimisation with Python.
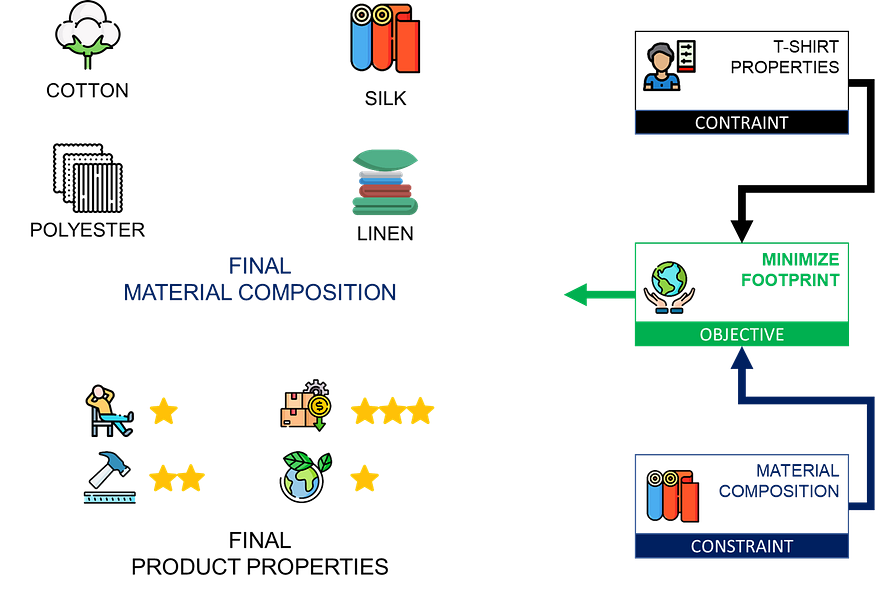
- Parameters: The quantity of each raw material used to produce a T-shirt
- Constraints: the one listed above
- Objective function: minimize environmental footprint, minimize the cost or a mix of both
Your team can use libraries like PuLP or SciPy to create an optimization model for testing several objective functions and eventually find the perfect mix of materials.
💡 For more details,
Supply Chain Network Optimisation
To introduce reverse-flow processes for recycling, we need to completely redefine our supply chain network.
Supply chain optimization can help us to make the best use of data analytics to find the optimal combination of factories, distribution and recycling centres that minimize cost impacts.
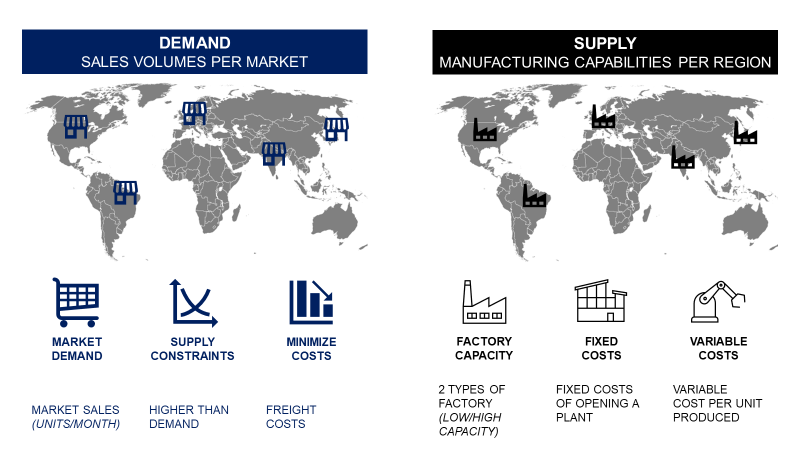
A linear programming model with Python can help us by
- Selecting the right locations for our recycling centres
- Optimising the flow of used items collection
- Sizing the capacity of sorting and recycling centres
The objective is to minimise the cost of collecting, sorting, and recycling used items to achieve a profitable, sustainable circular model.
💡 For more details on how to create a network optimisation model,

Conclusion
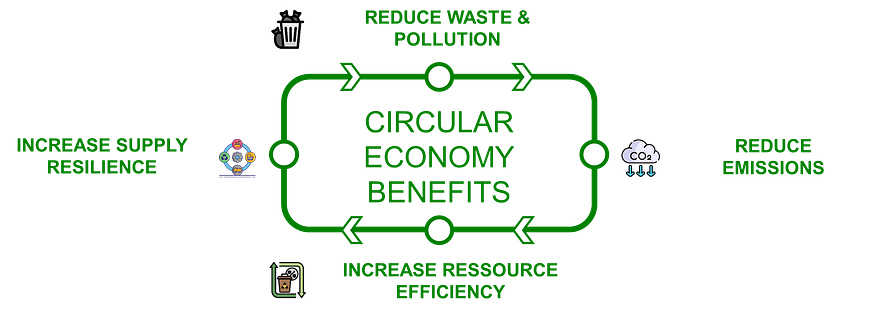
The journey into the circular economy and its intersection with data science revealed interesting insights.
Data science can be a powerful enabler in transitioning towards a profitable circular economy by overcoming complex barriers and optimising resources.
In the future, we can expect analytics teams to play a pivotal role in companies' transition to circular models
The primary focus here was on flow optimisation.
However, other potential areas for exploration include
- Machine learning to predict and optimise resource usage
- Automation of waste sorting for recycling
- Predictive maintenance of goods for extended lifecycles
These solutions did not even consider using generative AI because I believe the core solutions should be deterministic (code, algorithms and maths).
However, AI can enhance the user experience and analyse the results of these optimisations.
This is what I explored in this video.
About Me
Let’s connect on LinkedIn and Twitter. I am a Supply Chain Engineer using data analytics to improve logistics operations and reduce costs.
If you’re looking for tailored consulting solutions to optimise your supply chain and meet sustainability goals, feel free to contact me.