How I Use AI to Convince Companies to Adopt Sustainability
Discover how Claude can act as a Supply Chain Sustainability Analyst and guide companies toward greener, more efficient inventory management.
Nothing is harder than convincing someone of a truth they cannot see in their own data.
Data science and sustainability experts face the same problem: our concepts may be too abstract and theoretical, making them difficult for decision-makers to relate to.
When I published a case study on Green Inventory Management in 2024, I thought the logic was solid and convincing, but the impact was limited.
I learned this the hard way while developping my startup!
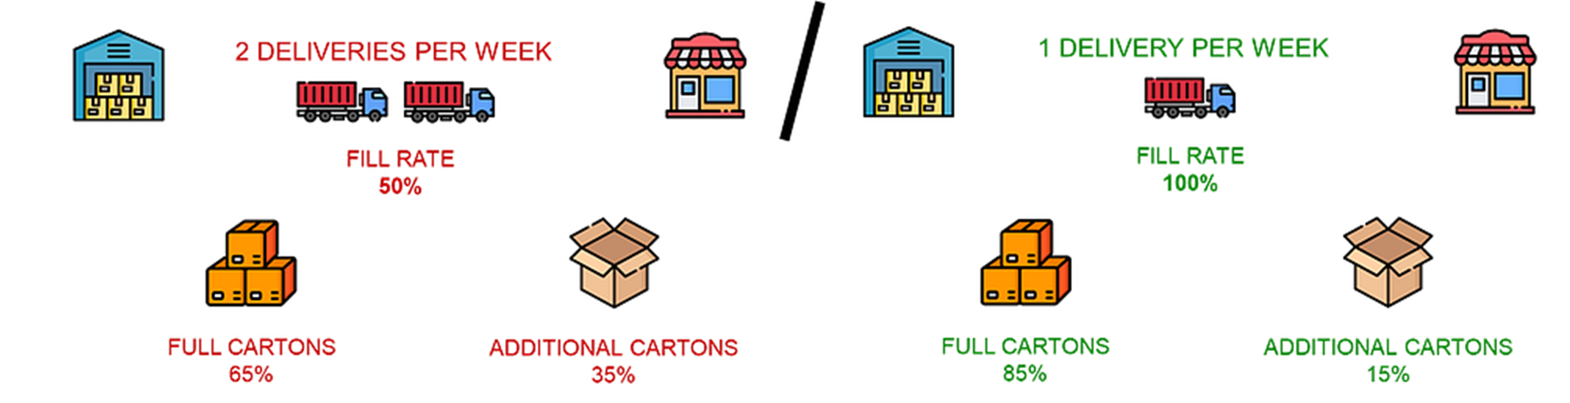
The article explained the mathematical theory behind it and used an actual case study to demonstrate the sustainability benefits.
Yet it didn’t convert sceptics.
Customer: "I am sure it won't work with our operations!"
Why? Because it wasn’t connected to their data and constraints.
So I decided to change the approach.
I packaged the simulation tool in a FastAPI microservice and gave my customers the ability to test the model themselves using an MCP Server connected to Claude Desktop.
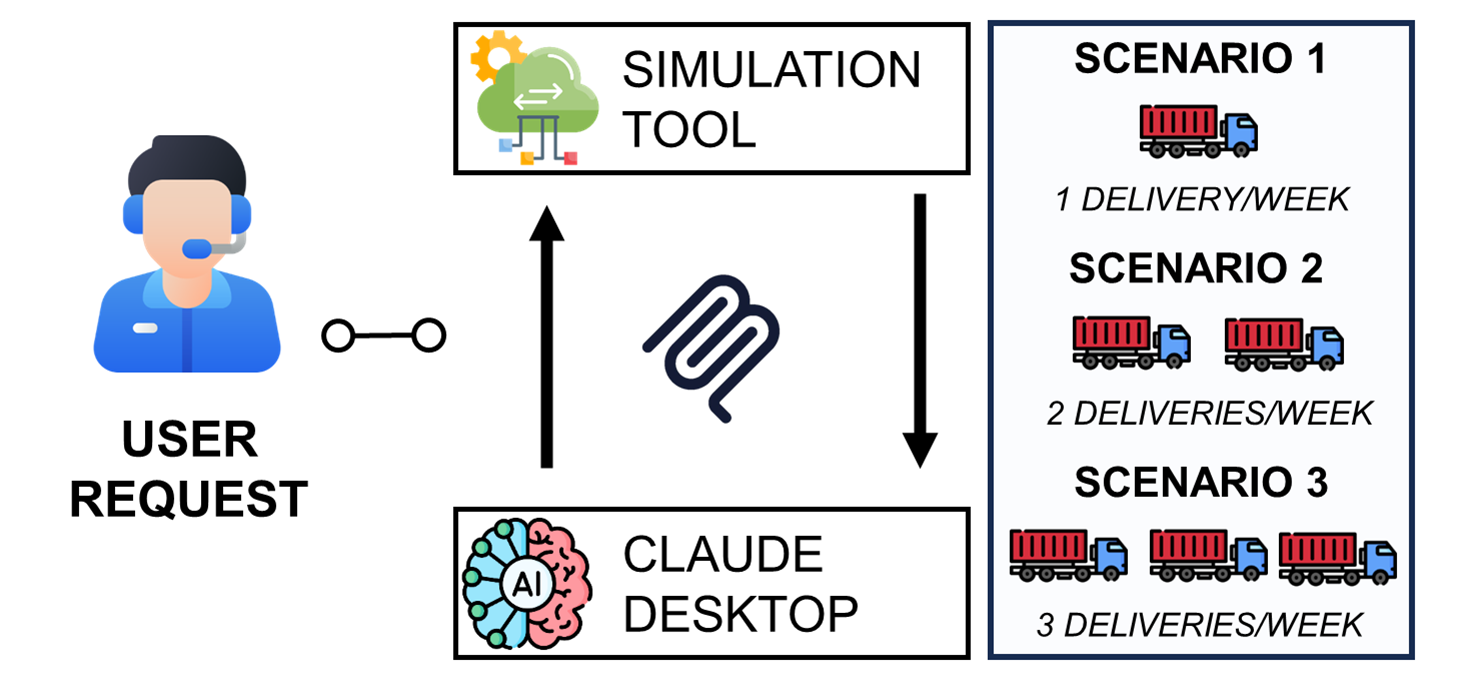
The objective was to have them ask the LLM to run their own scenarios, adjust their parameters, and see how CO₂ emissions dropped in response to different inventory policies.
In this article, I will share the approach I used for this experiment and the feedback I received from a prospect, the Supply Chain Director of a retail group based in the Asia Pacific region.
What is Green Inventory Management?
In this section, I want to briefly explain the concept of Green Inventory Management so you have the context to understand the tool's added value.
Context: Inventory Management for a Retail Company
Let us put ourselves in our Supply Chain Director's shoes.
His teams (inventory teams, warehouse and transportation operations) are responsible for replenishing stores from a central distribution centre.
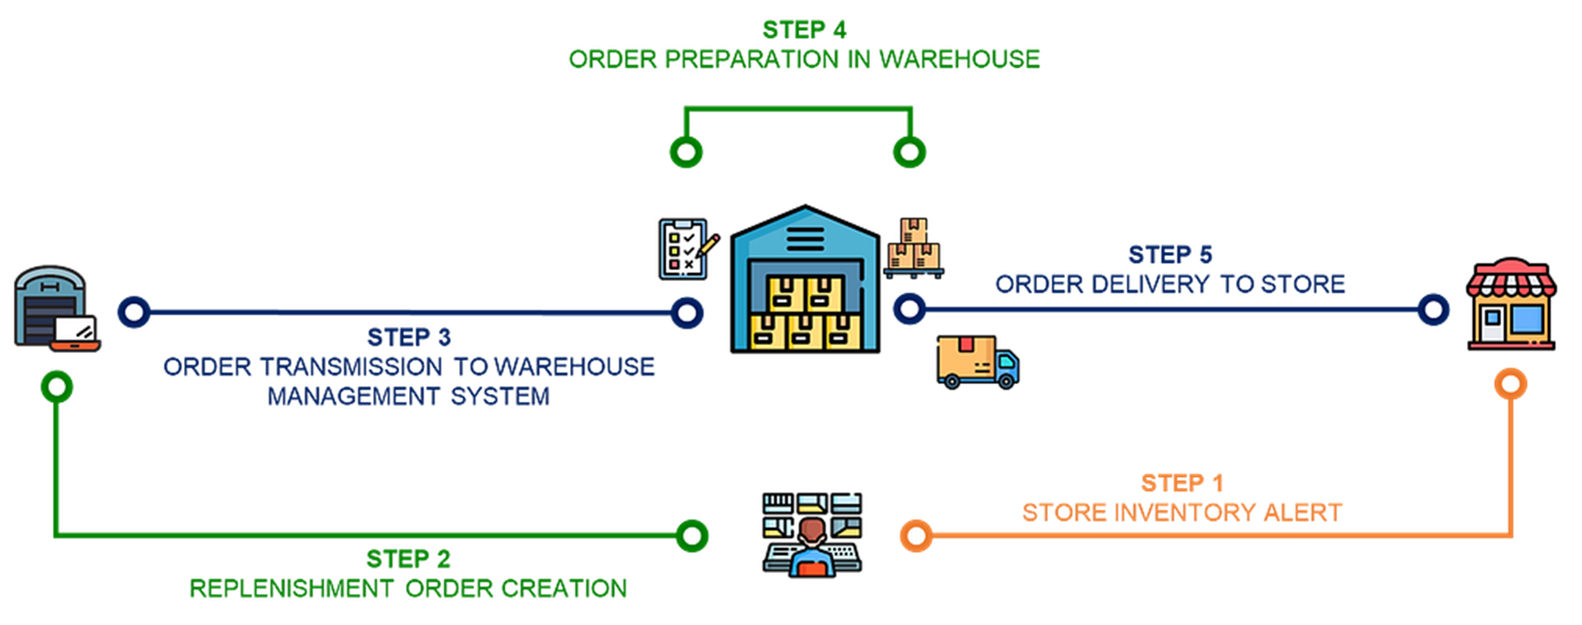
When they need specific products, stores automatically send replenishment orders via their ERP to the Warehouse Management System.
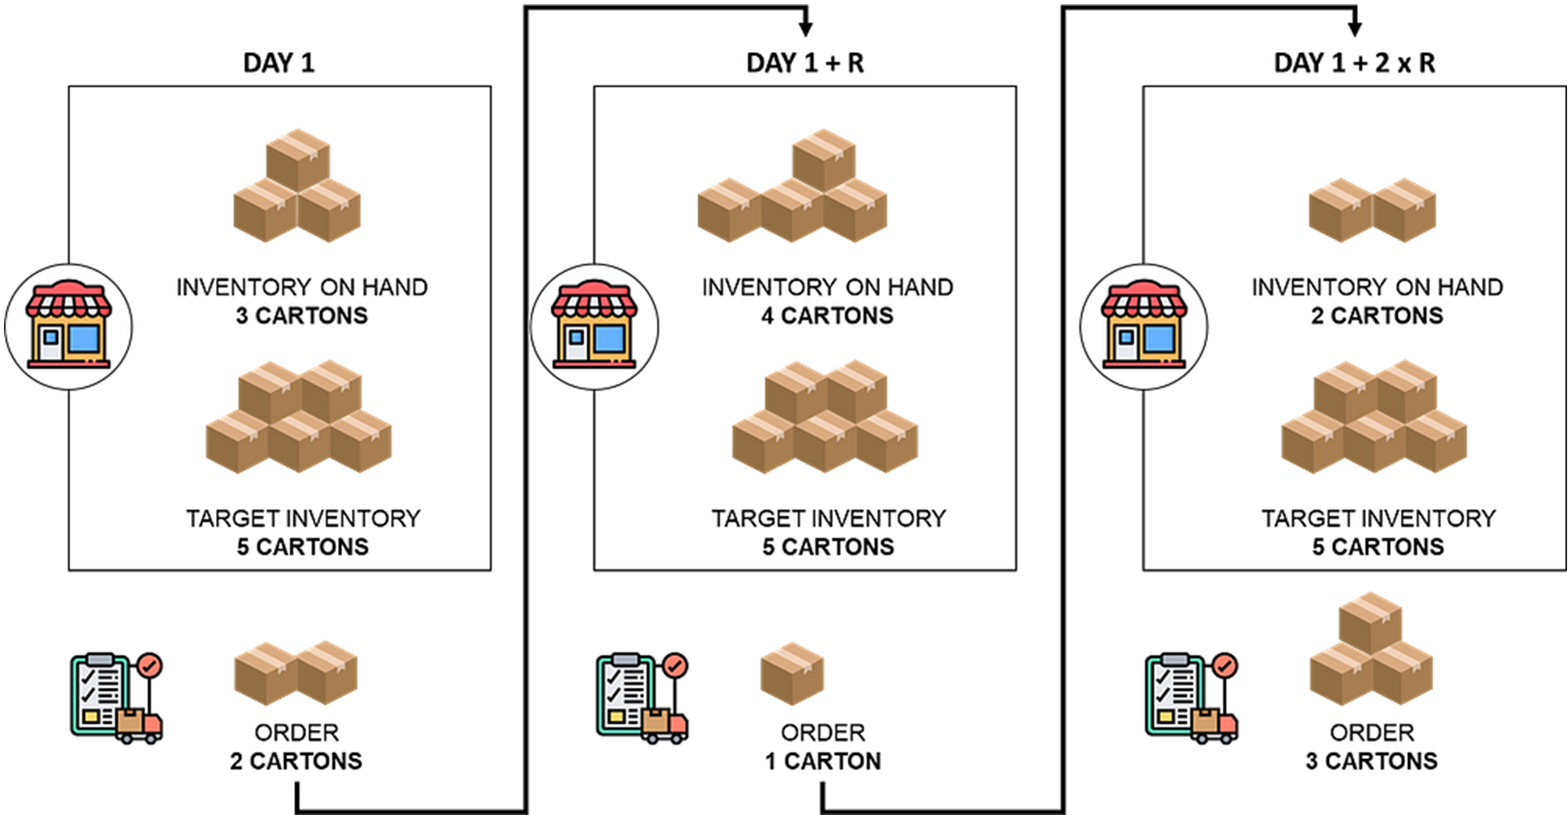
These automated orders follow rules implemented by the inventory team, known as the periodic review “Order-Up-To-Level (R, S)” policy.
- The ERP is reviewing stores' inventory levels, also called inventory on hand (IOH), every R days
- A Replenishment Order is created and transmitted to the warehouse with the quantity: Q = S — IOH
The delta between the target inventory S and the inventory level is calculated: Δ = S— IOH
After transmission, the order is prepared at the warehouse and delivered to your store within a specific lead time (LD) in days.
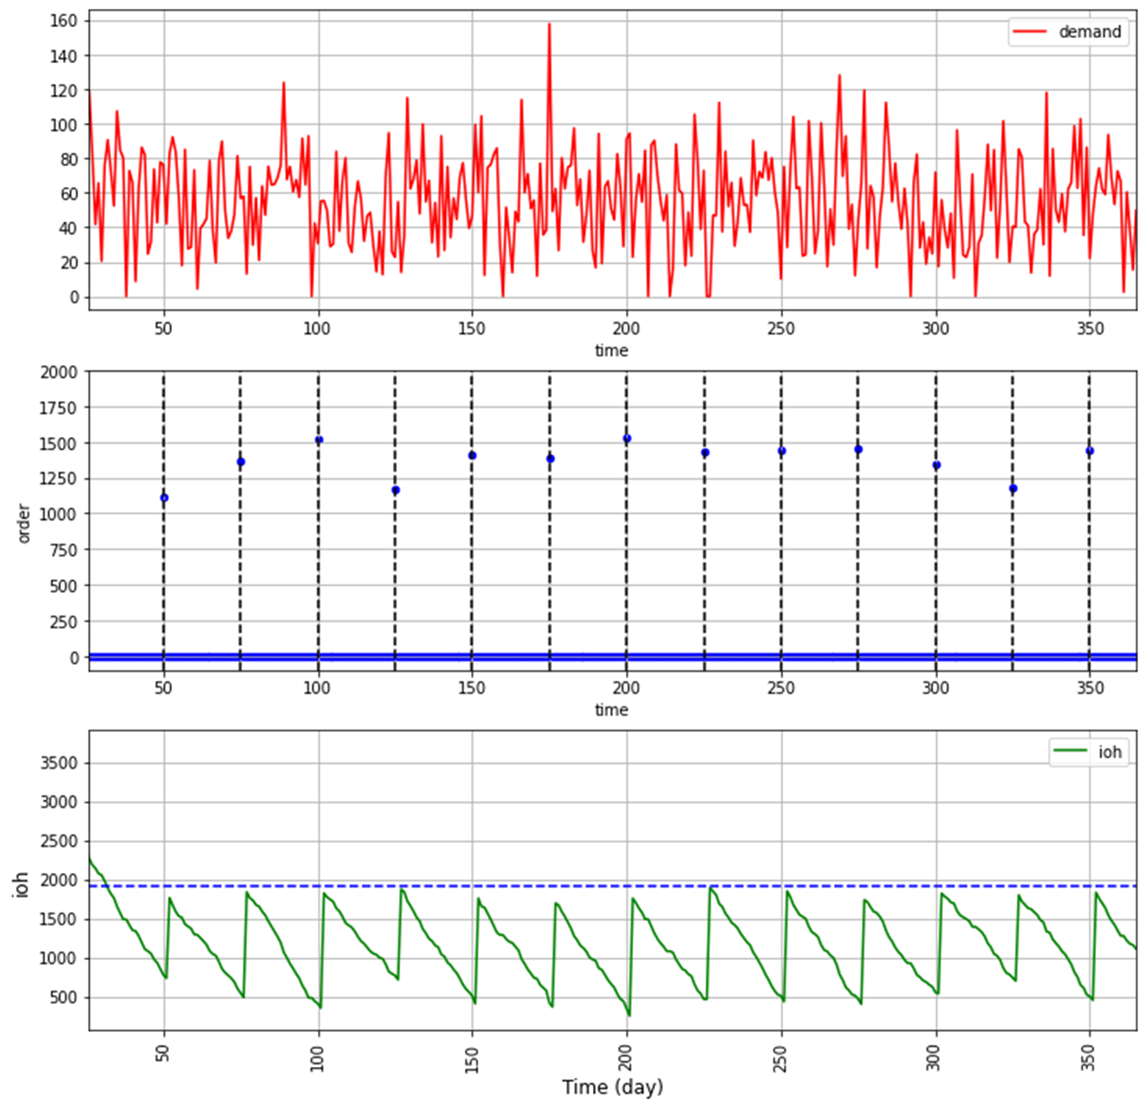
To be more concrete, I share the example above:
- R = 25 days: we review the inventory every 25 days as you can see in the blue scatter plot
- S = 1,995 units: we ordered to reach this level, as shown in the latest graph.
The inventory teams in the systems usually set these parameters, and the replenishment orders are automatically triggered.
What if we optimise these parameters?
Impacts on Logistics Operations
Based on my experience, these parameters are, most of the time, not set optimally..
The problem is that they significantly impact the efficiency of your warehouse and transportation operations.
This increases carton and plastic consumption and reduces productivity.
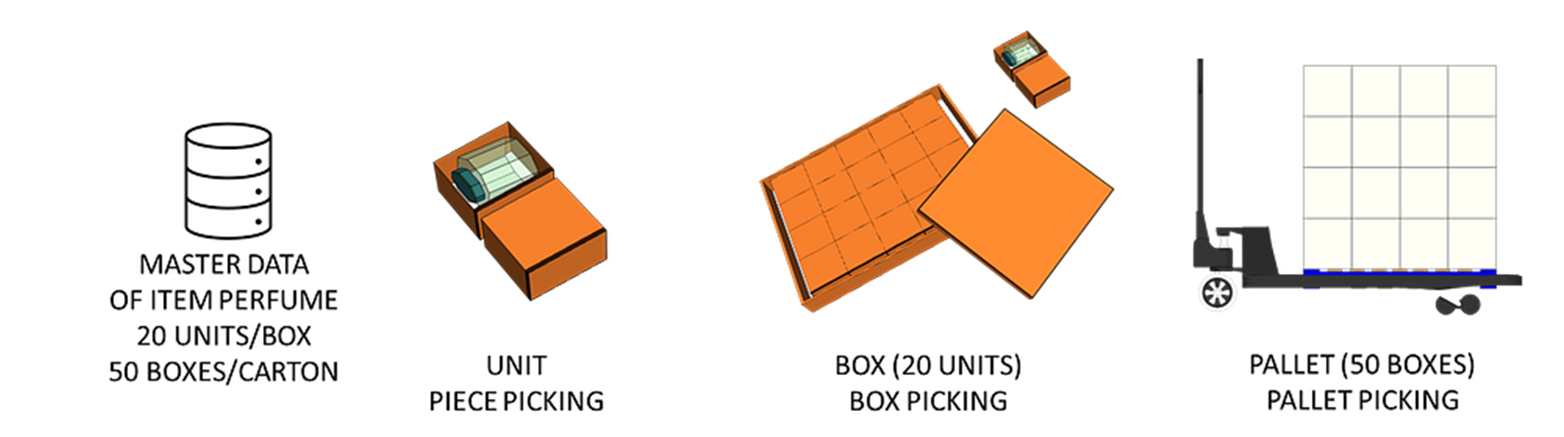
In the example above, items are stored in cartons containing units that can be picked individually.
If the order quantity is five, the operator will:
- Open a box of 20 units and take five units.
- Take a new box and put these items in it.
- Palletise the boxes using plastic film.
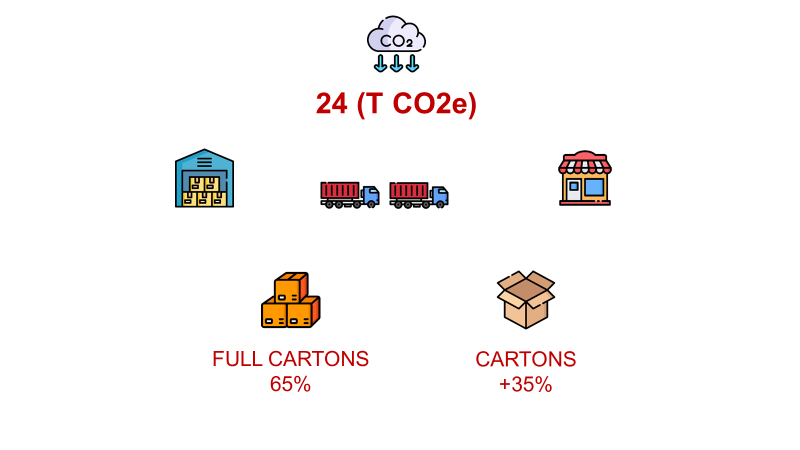
The other impact is on truck filling rate and CO2 emissions.
With a high delivery frequency, you reduce the volume per shipment.
This leads to the use of smaller trucks that may not be full.
What can we do?
Objectives of Green Inventory Management
We can test multiple scenarios, with different operational parameters, to find the optimal setup.
For that, I have loaded customer data into the simulation model
to test the tool with real scenarios.
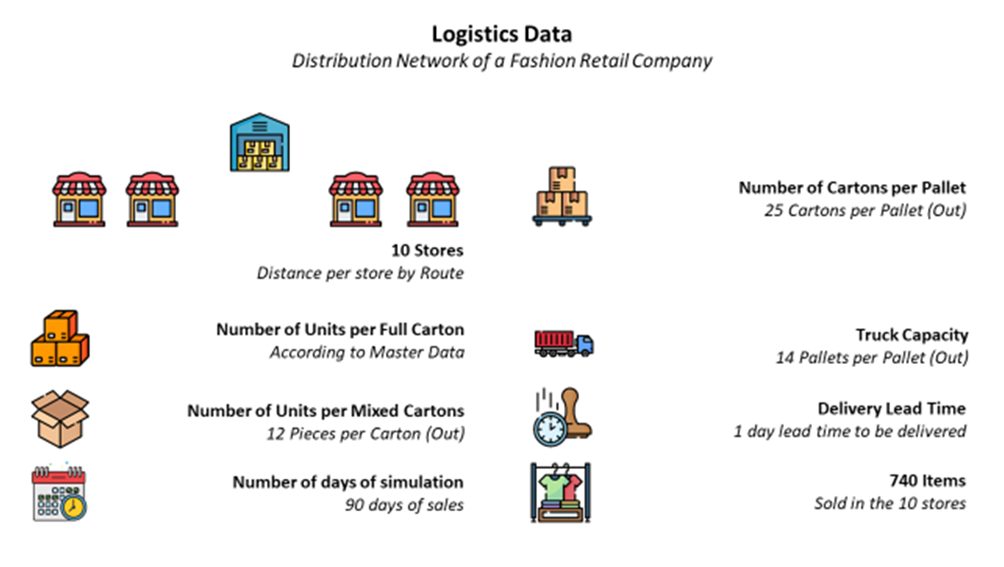
Users can adjust some of these parameters to simulate different scenarios.
class LaunchParamsGrinv(BaseModel):
    n_day: int = 30           # Number of days in the simulation
    n_ref: int = 20           # Number of SKUs in the simulation
    pcs_carton: int = 15      # Number of pieces per full carton
    cartons_pal: int = 25     # Number of cartons per pallet
    pallet_truck: int = 10    # Number of pallets per truck
    k: float = 3              # Safety factor for safety stock
    CSL: float = 0.95         # Cycle service level target
    LD: float = 1             # Lead time for delivery (days)
    R: float = 2              # Review period (days)
    carton_weight: float = 0.3    # Carton material weight (kg)
    plastic_weight: float = 0.173 # Plastic film weight per pallet (kg)
These parameters include:
n_dayandn_ref: define the scope of simulationpcs_carton,cartons_pal,LDandpallet_truck: parameters linked to warehousing and transportation operationscarton_weight,plastic_weight: sustainability parametersR,kandCSL: parameters set by the inventory team
I want our Supply Chain Director to sit with his teams (inventory, warehouse, transportation and sustainability) to challenge the status quo.
If they need to reach a specific target, our director can:
- Challenge his inventory teams to find better review periods (R), or cycle service level (CSL) targets
- Ask the sustainability team to find lighter carton materials
- Redesign his warehouse operations to reduce the lead time (LD)
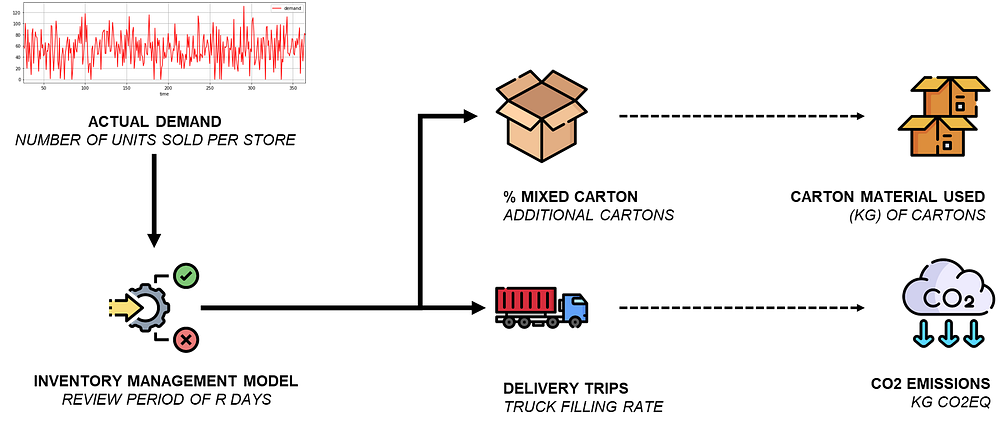
For that, we need to provide them with a tool to simulate the impact of specific changes.
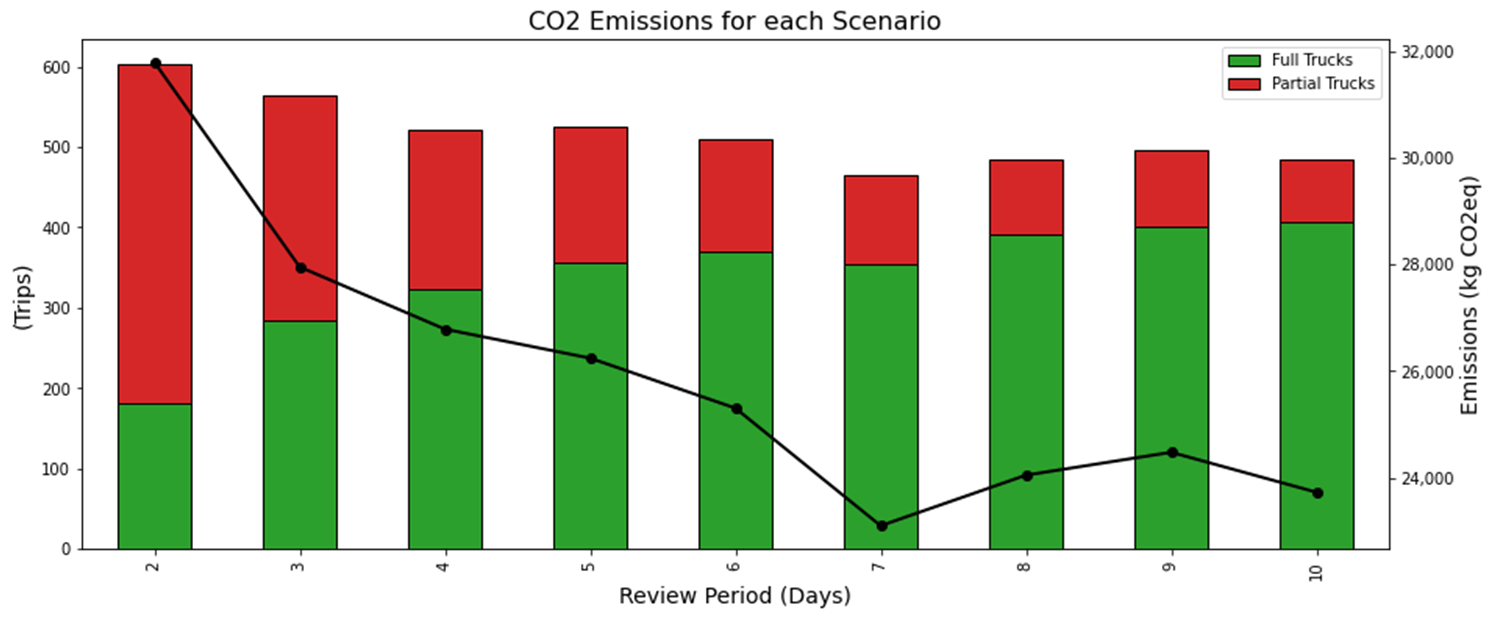
This is what we're going to do with the support of an MCP Server connected to Claude AI.
Demo of the Green Inventory Management AI Assistant
Now that we know how this simulation tool can add value to my customers, let me show you examples of analyses they have performed.
These tests were performed using customer data over a simulation horizon of up to 90 days.
I have replicated the questions and interactions using anonymised dummy data to avoid sharing confidential information here.
Onboarding of users
I have connected the MCP server to the Claude environment used by the Supply Chain managers to have them "play with the tool".
The majority did not take the time to review the initial case study and directly asked Claude about the tool.
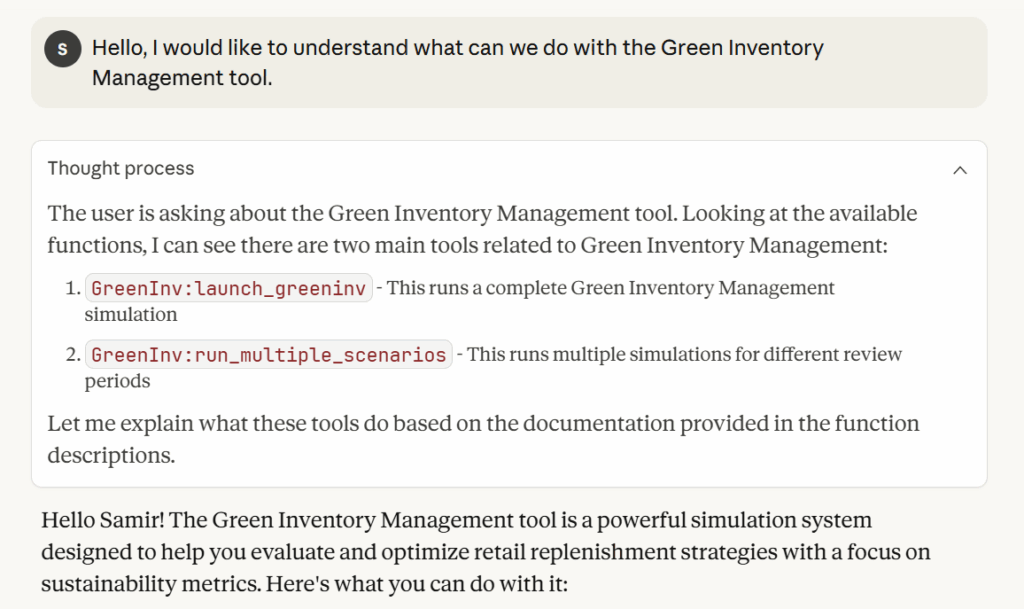
Hopefully, I have documented the MCP tools to provide context to the agent, like in the toot launch_greeninv shared below.
@mcp.tool()
def launch_greeninv(params: LaunchParamsGrinv):
    """
    Launch a complete Green Inventory Management simulation.

    This tool sends the input parameters to the FastAPI microservice
    (via POST /grinv/launch_grinv) and returns detailed sustainability
    and operational KPIs for the selected replenishment rule (Review Period R).

    -------------------------------------------------------------------------
    🌱 WHAT THIS TOOL DOES
    -------------------------------------------------------------------------
    It runs the full simulation described in the "Green Inventory Management"
    case study, reproducing the behavior of a real retail replenishment system
    using a (R, S) Periodic Review Policy.

    The simulation estimates:
      - Replenishment quantities and order frequency
      - Stock levels and stockouts
      - Number of full and mixed cartons
      - Number of pallets and truck deliveries
      - CO₂ emissions for each store and globally
      - Carton material and plastic usage
      - Operator productivity (orderlines and pieces per line)

    [REMAINDER OF DOC-STRING OMITTED FOR CONCISION]
    """
    logging.info(f"[GreenInv] Running simulation with params: {params.dict()}")

    try:
        with httpx.Client(timeout=120) as client:
            response = client.post(LAUNCH, json=params.dict())
            response.raise_for_status()

        result = response.json()
        last_run = result

        return {
            "status": "success",
            "message": "Simulation completed",
            "results": result
        }

    except Exception as e:
        logging.error(f"[GreenInv] Error during API call: {e}")
        return {
            "status": "error",
            "message": str(e)
        }
I was quite satisfied with Claude's introduction to the tool.
It starts with the introduction of the core capabilities of the tools from an operational point of view.
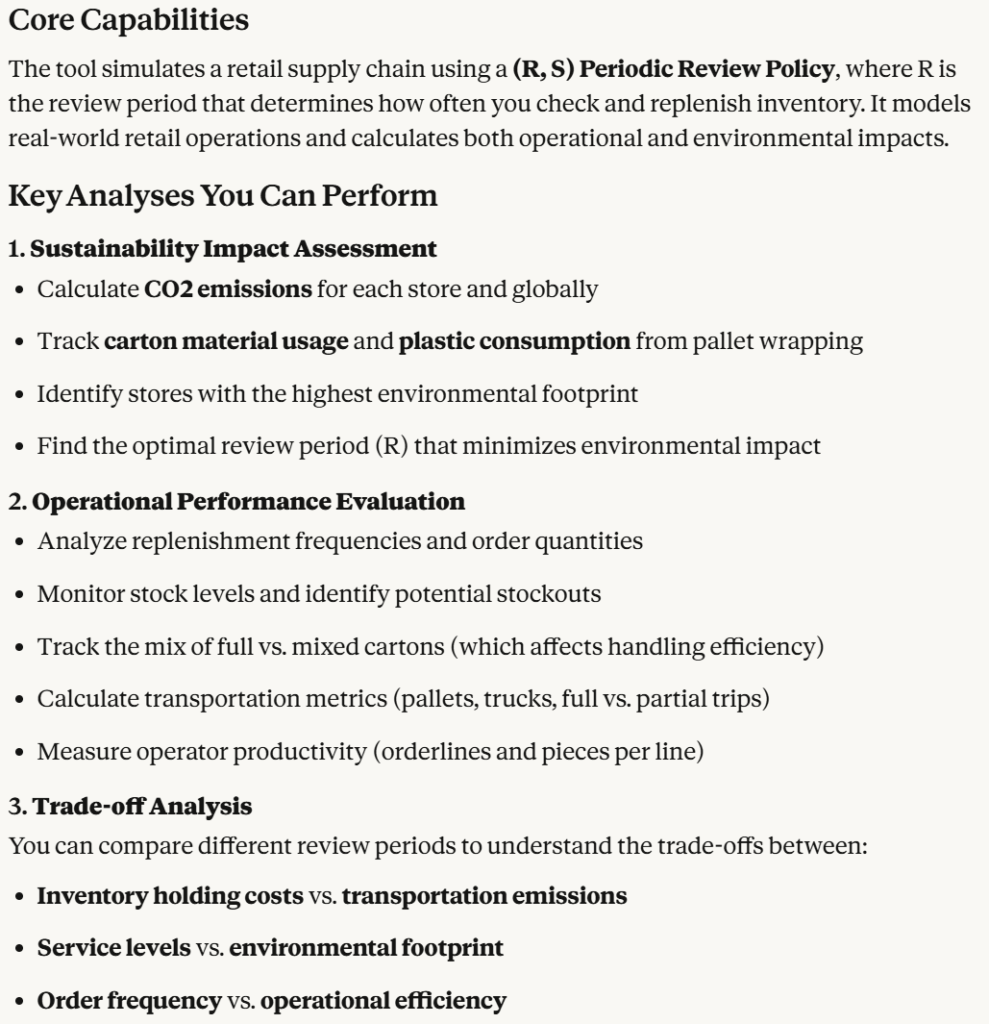
Quickly, our director started to send me long emails with questions on how to use the tool:
- How to set up the parameters?
- Who should I involve in this exercise?
My initial reflex was to answer: "Why don't you ask Claude?".
This is what they did, and the results are excellent. Claude proposed a framework of analysis.
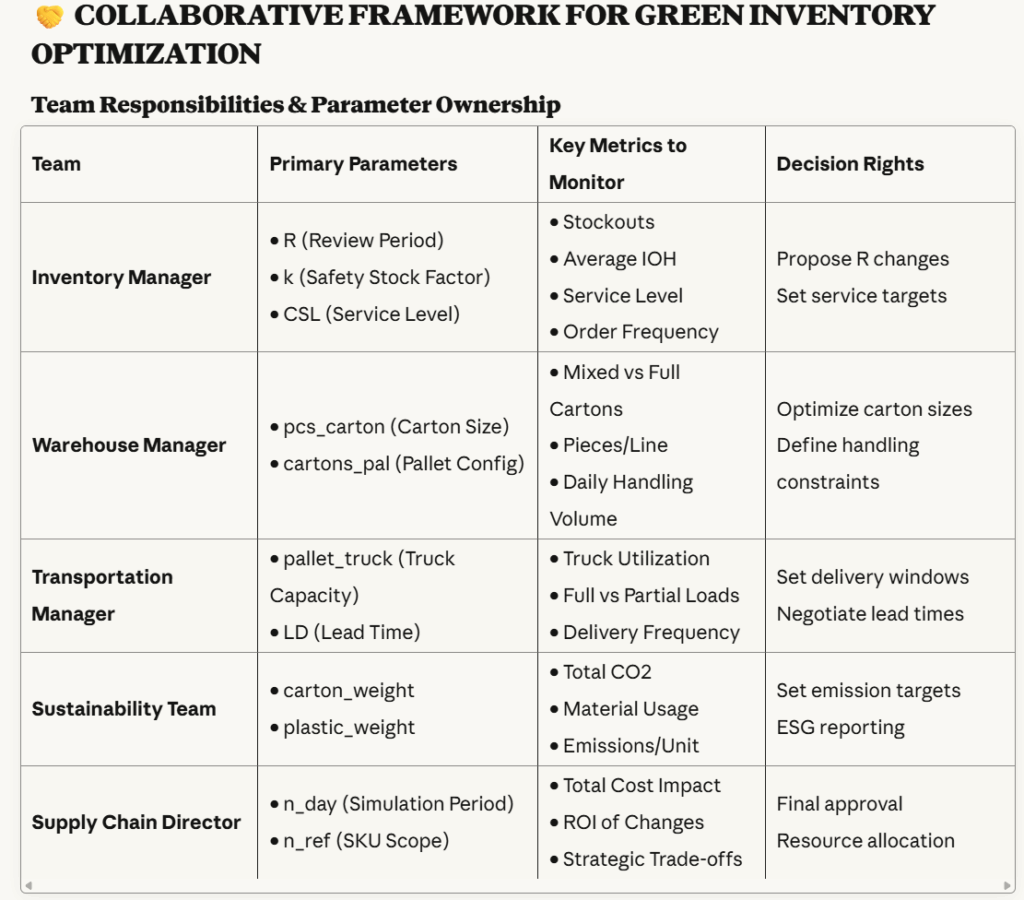
This framework is nearly perfect; I would just have put the lead time (LD) also in the scope of the Warehouse Manager.
However, I need to admit that I would never have been able to generate such a concise and well-formatted framework on my own.
Then, Claude proposed a plan for this study with multiple phases.
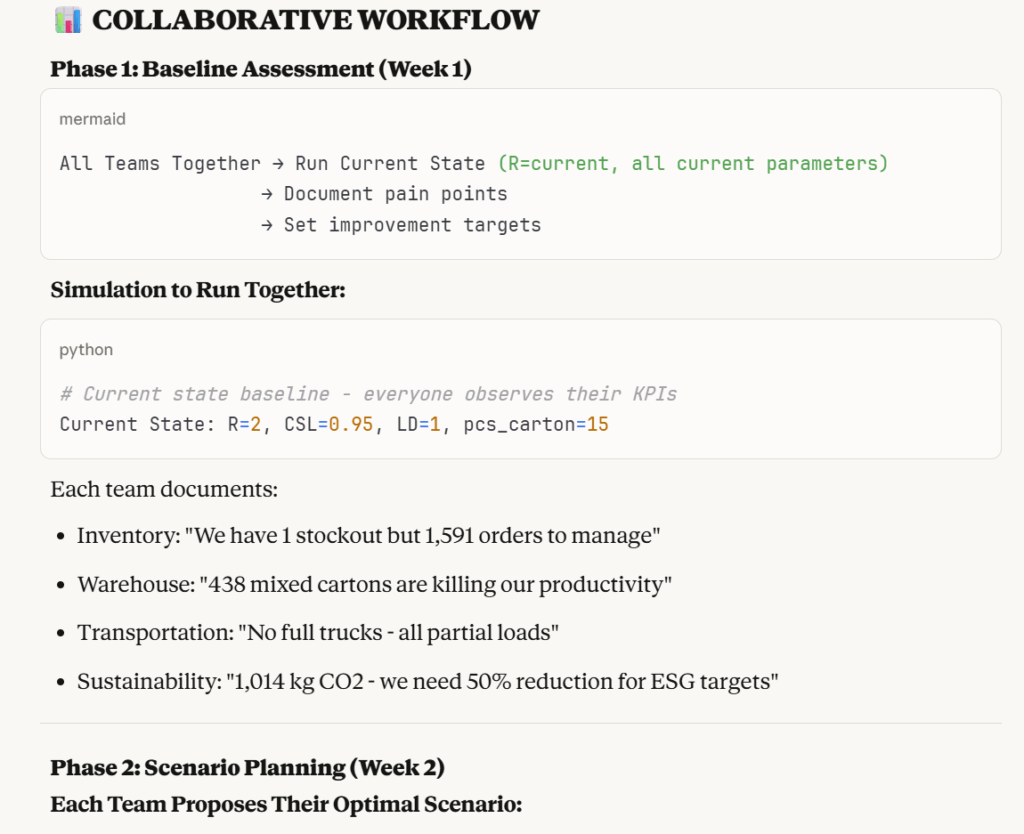
Let me take you through the different phases from the user's perspective.
Phase 1: Baseline Assessment
I advised the team to continually ask Claude for a nice dashboard with a concise executive summary.
That is what they did for Phase 1.
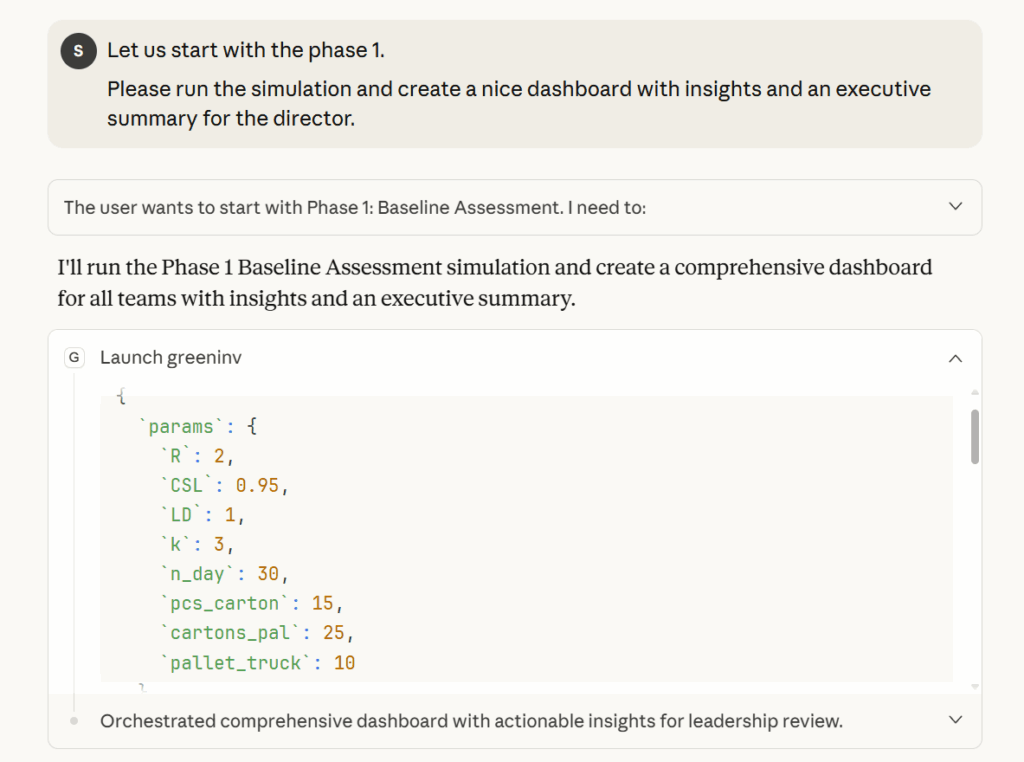
As you can see in the screenshot above, Claude used the MCP Server tool launch_greeninv to run an analysis with the default parameters defined in the Pydantic model.
With the outputs, it generated the Executive Summary for our director.
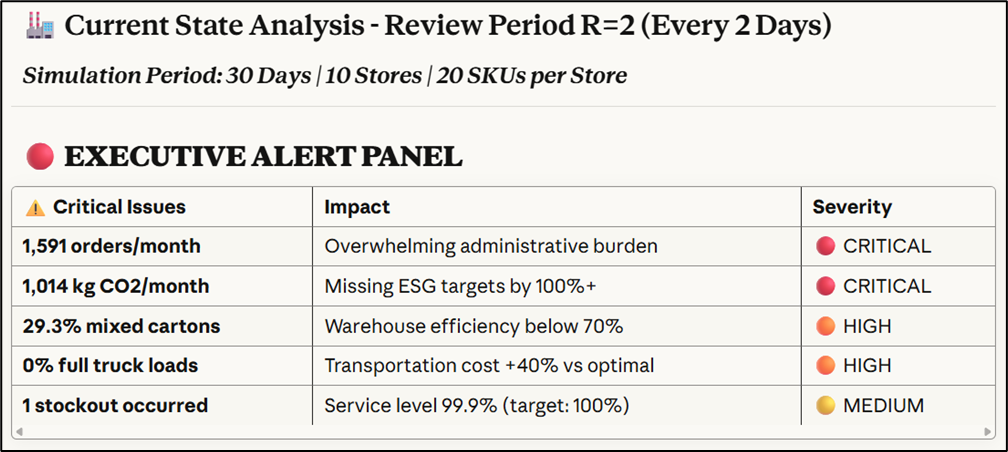
The summary is concise and straight to the point.
It compares the outputs (key performance indicators) to the targets shared in the MCP docstring and the master prompt.
What about the managers?
Then it generated team-specific outputs, including tables and comments that clearly highlighted the most significant issues, as shown in the example below.
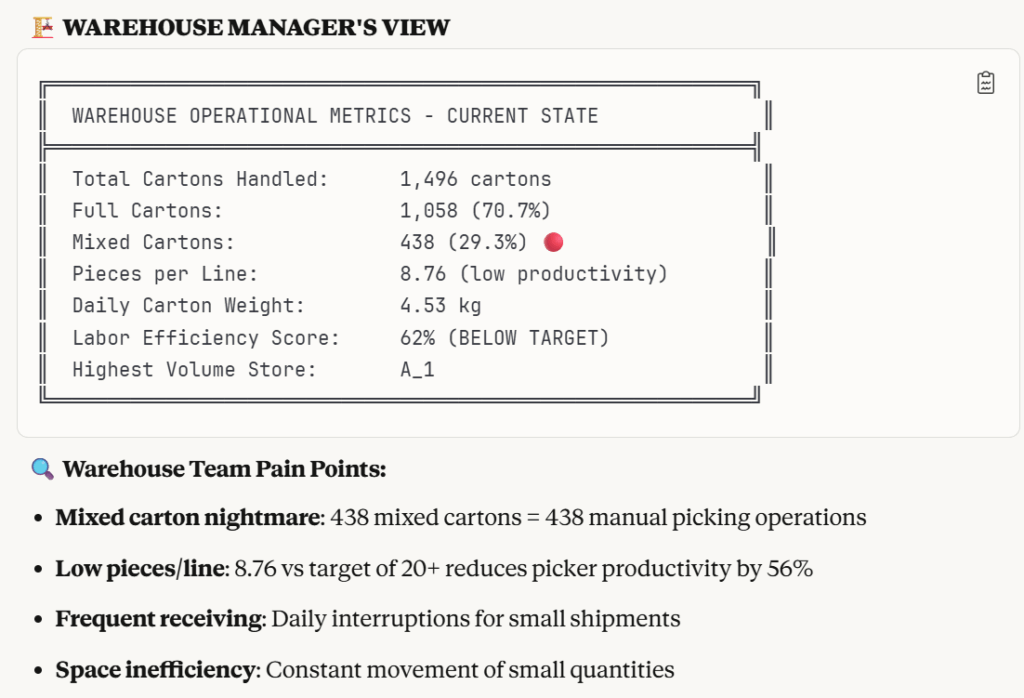
What is interesting here is that our warehouse manager only mentioned the target pieces per line in a previous message.
That means we can have the tool learn not only from the MCP's tools docstrings, master prompt, and Pydantic models, but also from user interactions.
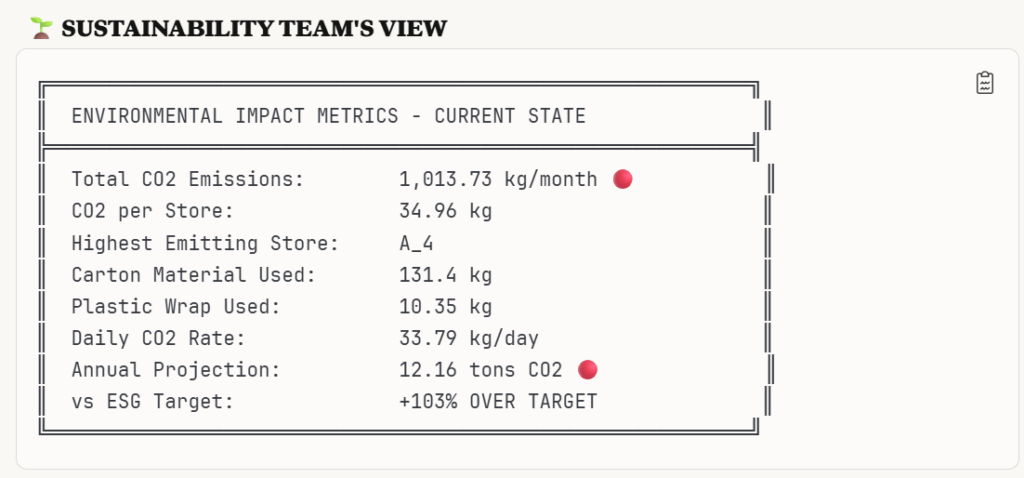
Finally, the tool demonstrated its ability to have a strategic approach, providing mid-term projections and alerting on the key indicators.
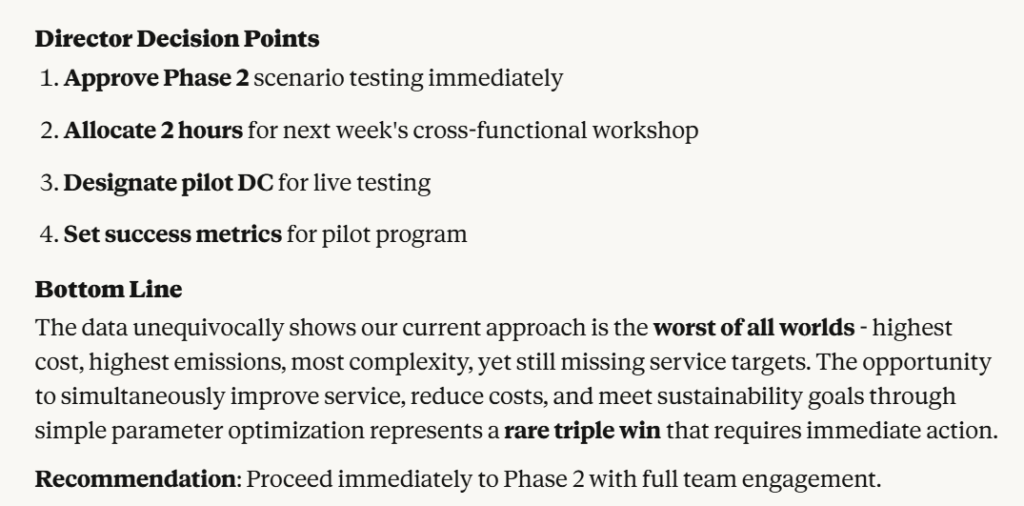
However, nothing is perfect.
When you have weak prompting, Claude never loses the opportunity to hallucinate and propose decisions outside the scope of the study.
Let us continue the exercise, following Anthropic's model, and proceed to Phase 2.
Phase 2: Scenario Planning
After brainstorming with its team, our director collected multiple scenarios from each manager.
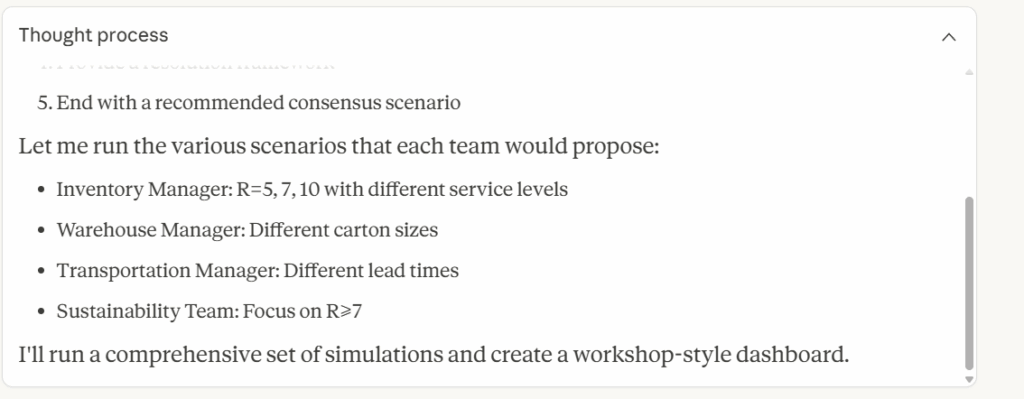
What we can see here is that each manager wanted to challenge the parameters focused on their scope of responsibility.
This thought process is then transcribed into actions.
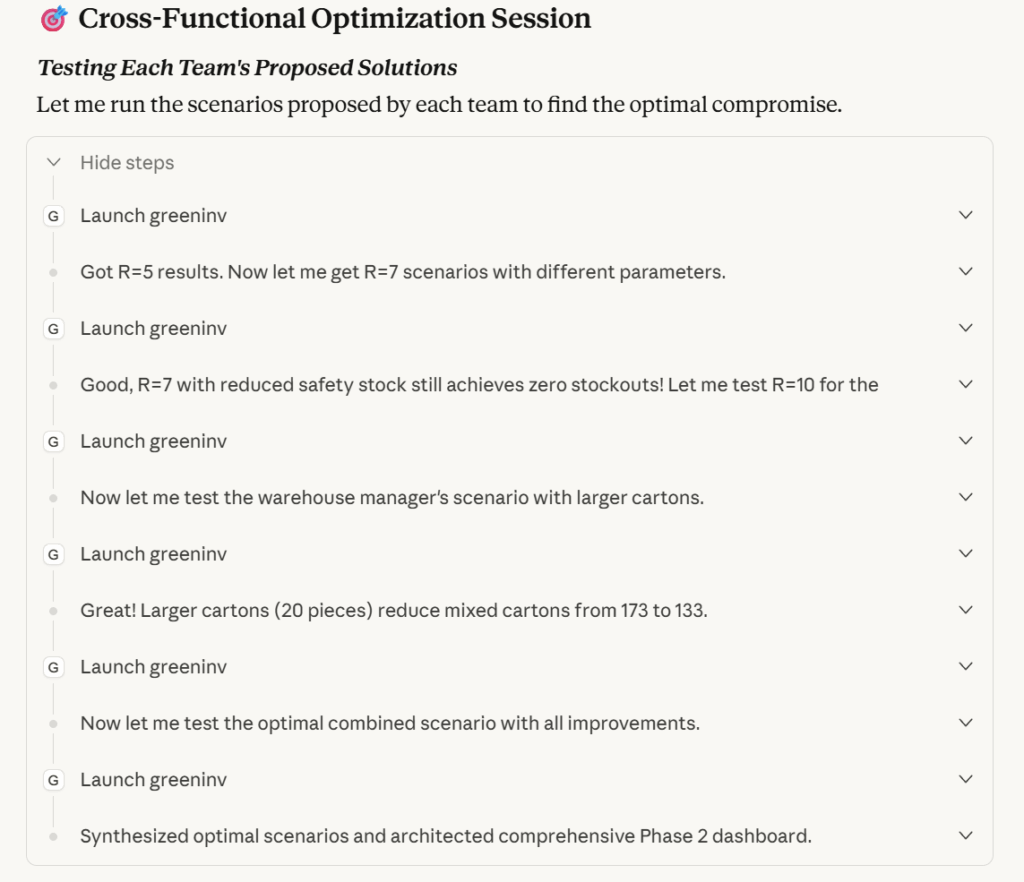
Claude decided to run the six scenarios listed above.
The challenge here is to compile all the results into a synthetic, insight-driven summary.
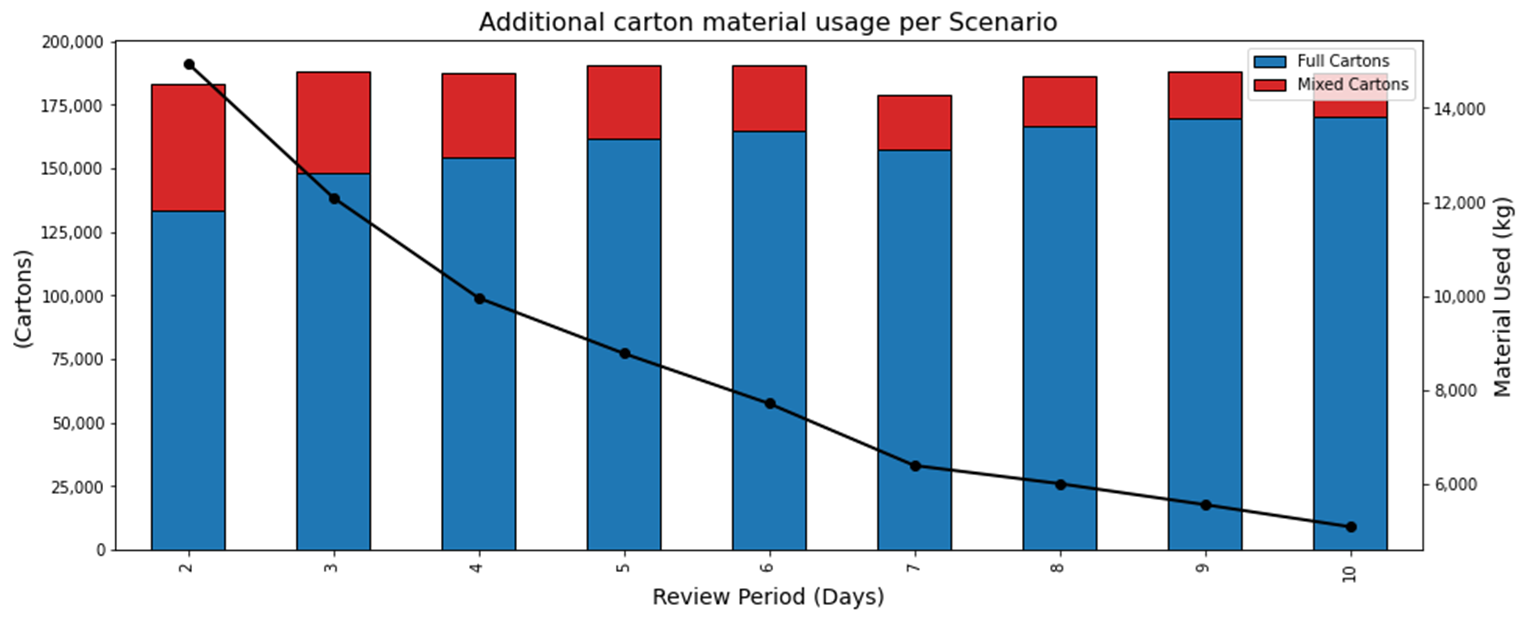
In the case study published in 2024, I focused only on the first three scenarios, examining each performance indicator individually.
What about Claude?
Claude was smarter.
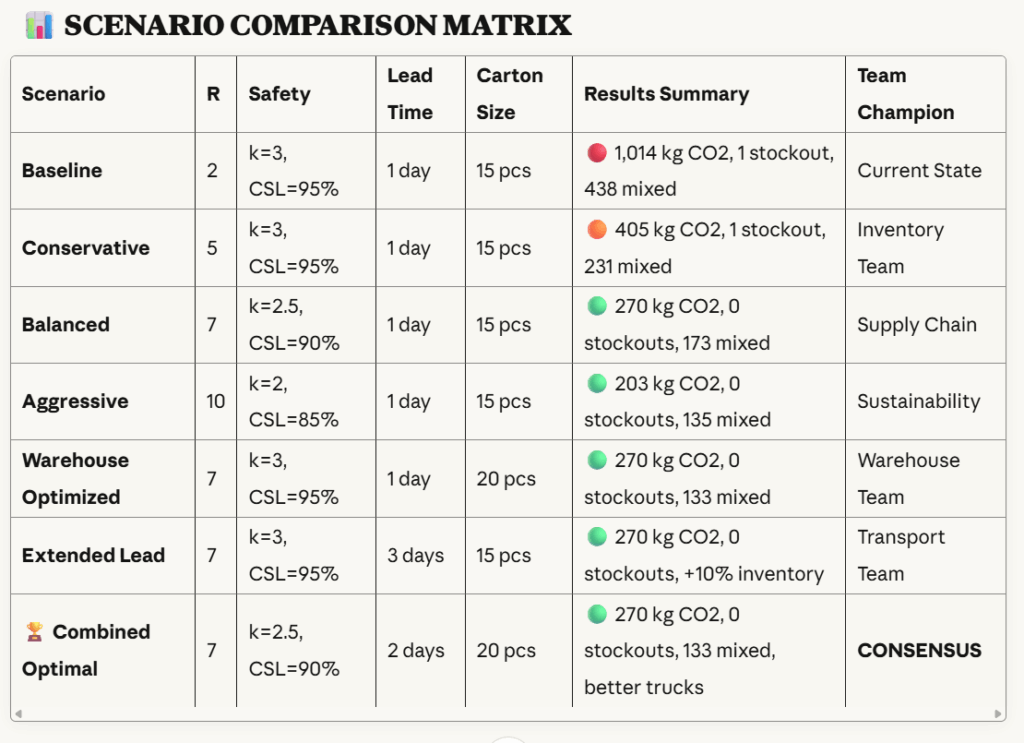
Although we had the same type of data on hand, it produced something more "cross-functional" and decision-driven.
- We have business-friendly names for each scenario that are understandable across functions.
- Each scenario is linked to the team that pushed for it.
Finally, it provided an optimal scenario that is a consensus between the teams.
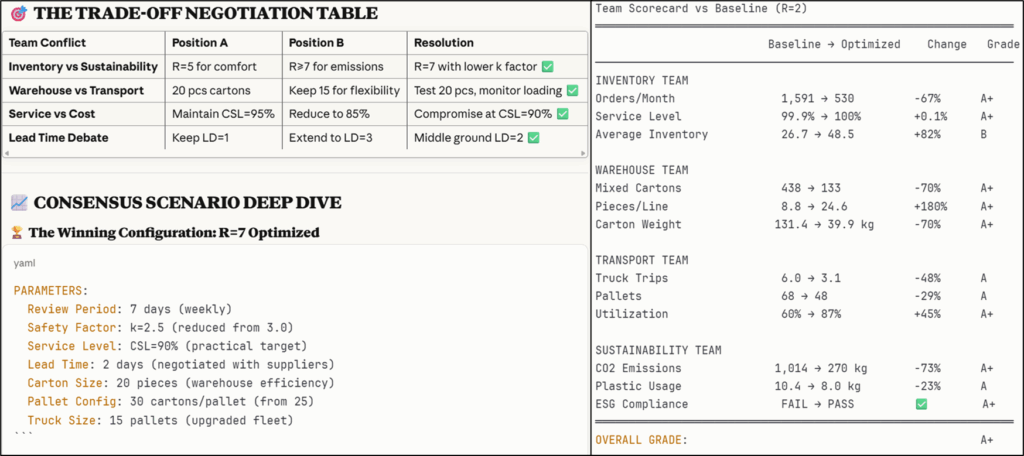
We are even provided with a scorecard that explains to each team why the scenario is best for everybody.
For a more detailed breakdown of the agent's outputs, feel free to have a look at this tutorial:
Conclusion
Where to go next
- Green Inventory Management for Fashion Retail - Case Study: Discover how to reduce the CO2 footprint of fashion retail logistics by optimising store replenishment policies.
- How I Deployed an AI Agent for Sustainable Supply Chain Optimisation: Use Claude with an MCP Server to help companies design cost-efficient and sustainable supply chain networks.
- I Simulated an International Supply Chain and Let OpenClaw Monitor It: Mario asked me why 18% of his shipments were late when every team hit their target.
A new hope for the concept of Green Inventory Management
After a couple of weeks of experimentation, the Supply Chain Director is convinced of the need to implement Green Inventory Management.
The only bottleneck here is on their side now.
With Claude's support, our four managers involved in the study understood the impact of their roles on the distribution chain's overall efficiency.
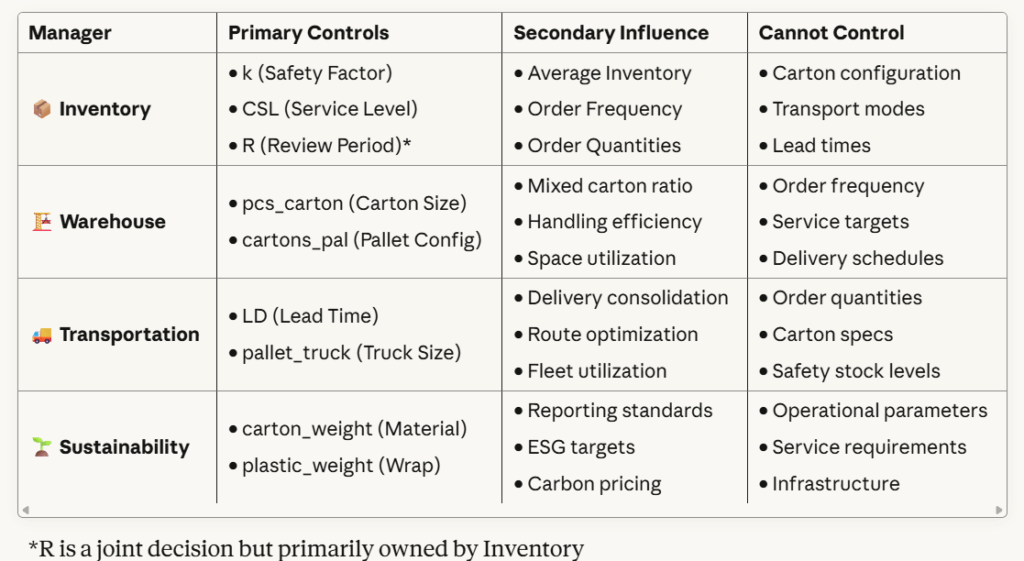
This helps us at LogiGreen onboard Supply Chain departments for complex optimisation exercises like this one.
In my opinion, it is easier to conduct a green transformation when all teams have ownership and sponsorship.
And the only way to get that is to make sure everybody understands what we are doing.
Based on the initial results of this modest experiment, I think we have found an excellent tool for that.
Do you want other case studies using MCP Server for Supply Chain Optimisation?
AI Agent for Supply Chain Network Optimisation
In another article published on Towards Data Science, I share a similar experiment focused on the Supply Chain Network Design exercise.
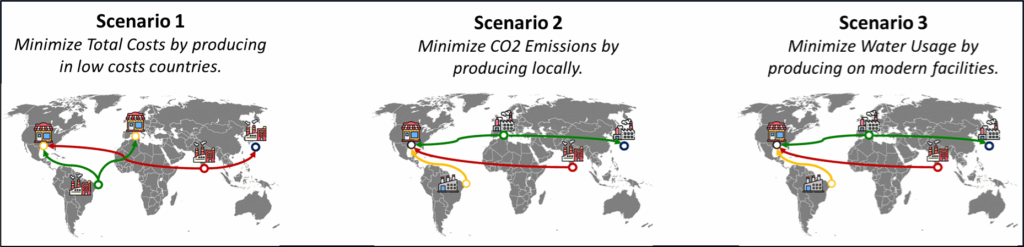
The objective here is more macro-level.
We want to determine where goods are produced to serve markets at the lowest cost in an environmentally friendly way.
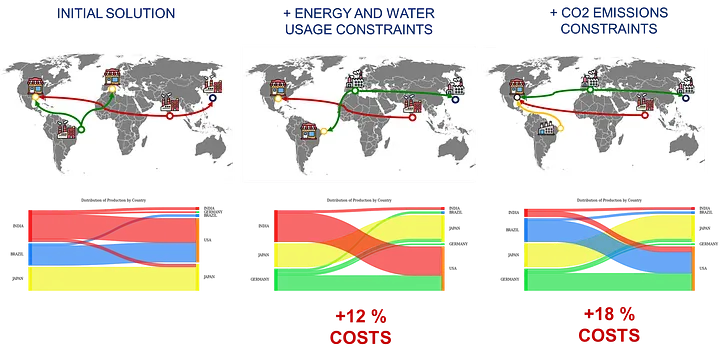
While the algorithm differs, the approach remains the same.
We try multiple scenarios with parameters that favour different teams (finance, sustainability, logistics, manufacturing) to reach a consensus.
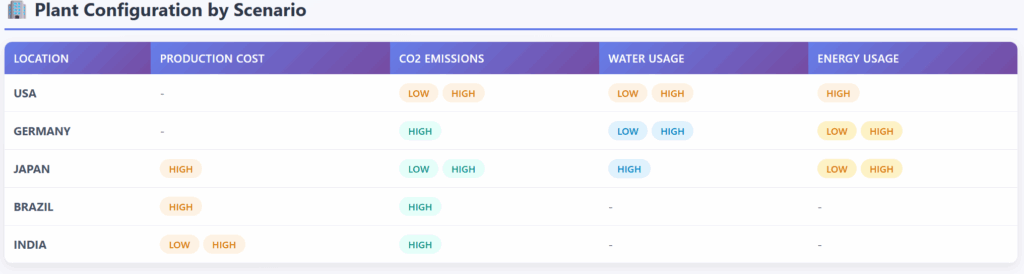
Like here, Claude does a great job in synthesising the results and providing data-driven recommendations.
For more details, you can watch this video.