Green Inventory Management for Fashion Retail - Case Study
Discover how to reduce the CO2 footprint of fashion retail logistics by optimising store replenishment policies.
Green inventory management can be defined as managing inventory in an environmentally sustainable way.
For the distribution network of a Fashion Retail company, this can involve a set of processes and rules that aim to reduce the environmental impact of order transmission, preparation and delivery.
For most retailers, inventory management systems take a fixed, rule-based approach to manage the frequency of store replenishment (and quantity) to ensure that stores’ inventory can cover the demand.
In this article, we will use data analytics to simulate variations in store replenishment frequency and measure their impact on overall environmental impact.
I. Scenario
1. Inventory Management for Retail
Manage store inventory using a periodic review policy.
2. What if we change the review period?
Impacts on truck filling rates and the percentage of mixed cartons.3. What are the impacts on CO2 emissions?
II. Experiment
1. Simulation Model
Simulate inventory management and warehouse operations.
2. Scenarios
Results for review periods between 2 and 10 days.
III. Results
1. Impact on Transportation emissions
Fewer deliveries and higher fill rate = CO2 emissions reductions
2. Carton Material Usage
Fewer mixed cartons = less cart
Higher productivity = higher bonus for operatorsIV. Conclusion
Scenario
Inventory Management for Retail
You support the inventory manager of a mid-size fashion retail chain.
He is responsible for setting the replenishment rules in the ERP.
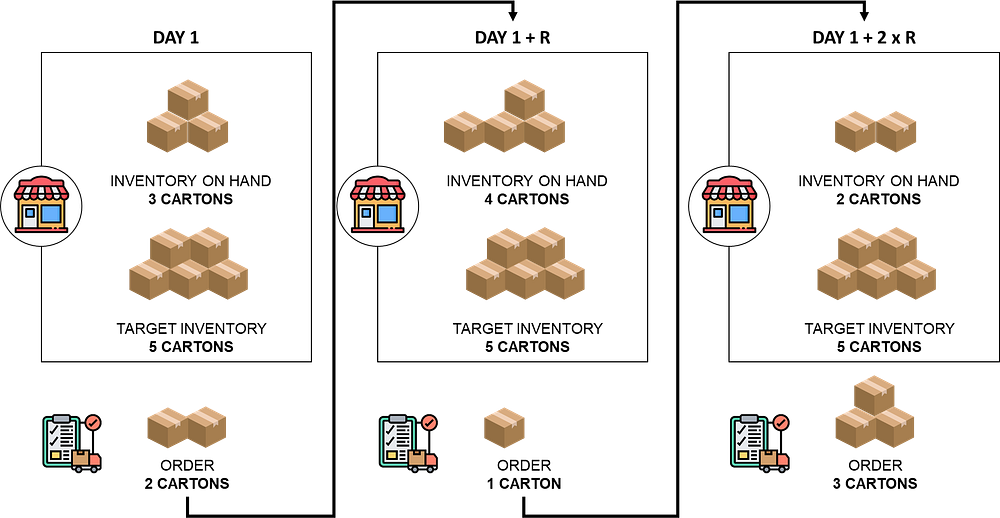
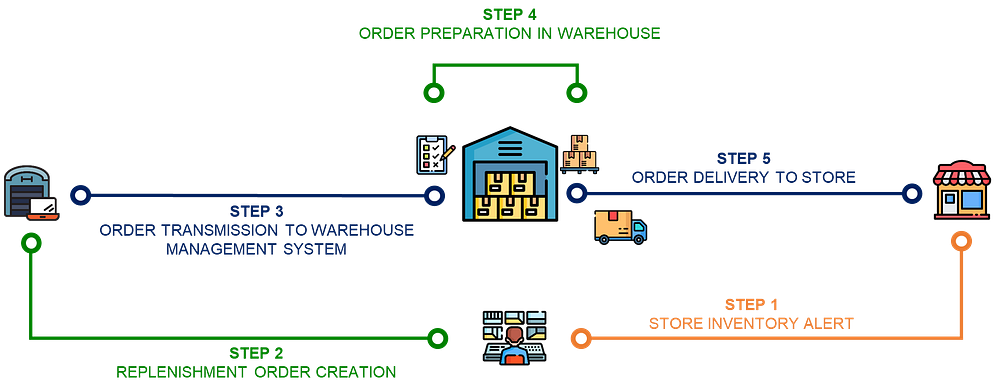
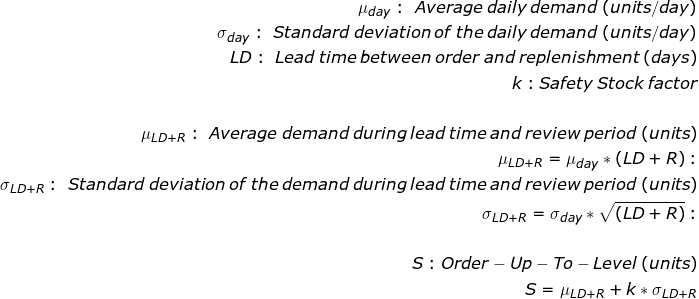
You have implemented a periodic review policy, Order-Up-To-Level (R, S)
- Your ERP is reviewing stores’ inventory levels (also called inventory on hand) every R days: IOH
- For each review, the gap between the inventory level and the target inventory S is calculated: S— IOH
- A Replenishment Order is created and transmitted to the warehouse with the quantity: Q = S — IOH
The idea is to deliver the missing quantity to reach this target level.

After transmission, the order is prepared at the warehouse and delivered to your store after a certain lead time LD (days).
You should set the target stock to absorb the demand variability and the replenishment lead time so your inventory remains positive until your order is delivered.
For more details, you can have a look at this article
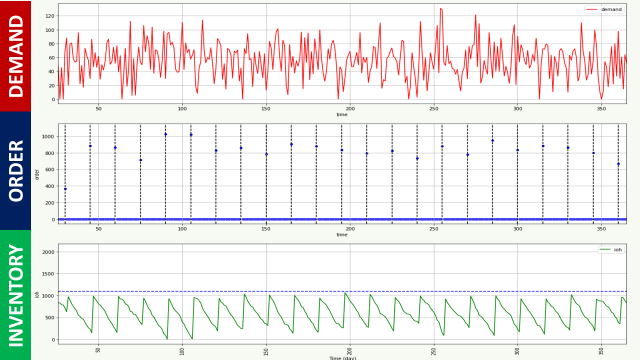
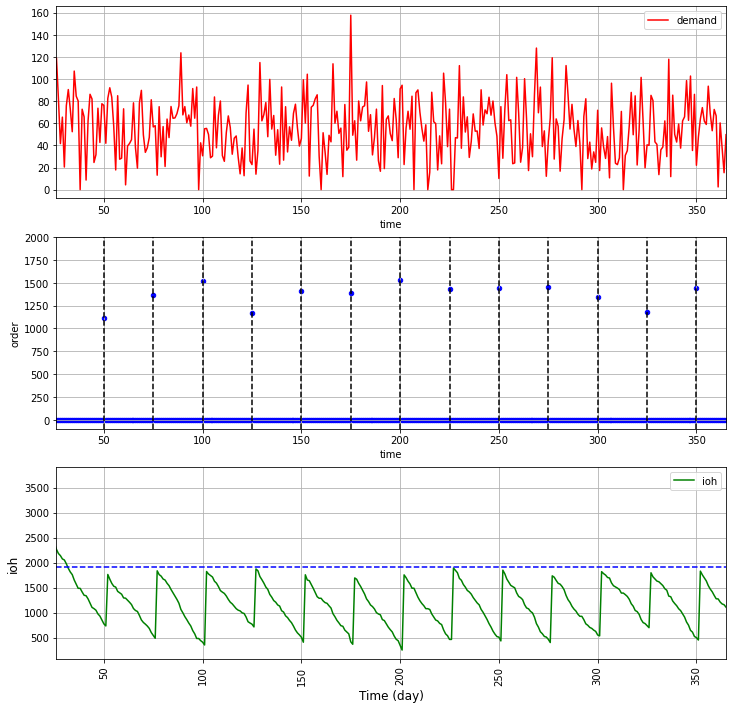
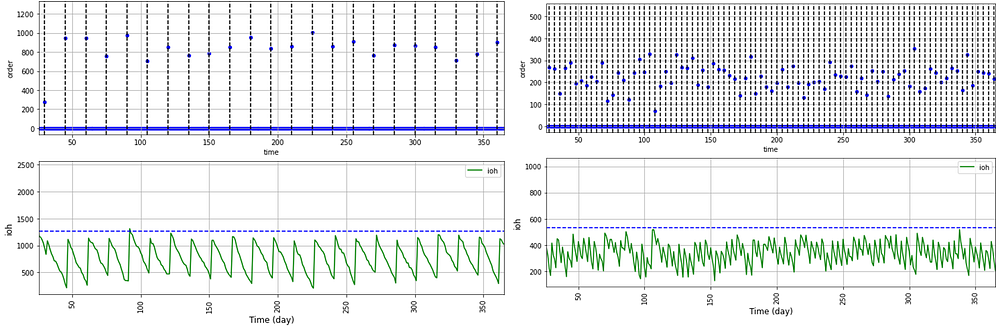
What if we change the review period?
The review period sets the frequency of store replenishment order creation.
- For R = 2 days, your store is replenished frequently, so you can set a lower target stock level to cover the demand during the review period.
- R = 15 days, the order quantity per replenishment is higher because your target stock level needs to absorb demand over a longer review period.
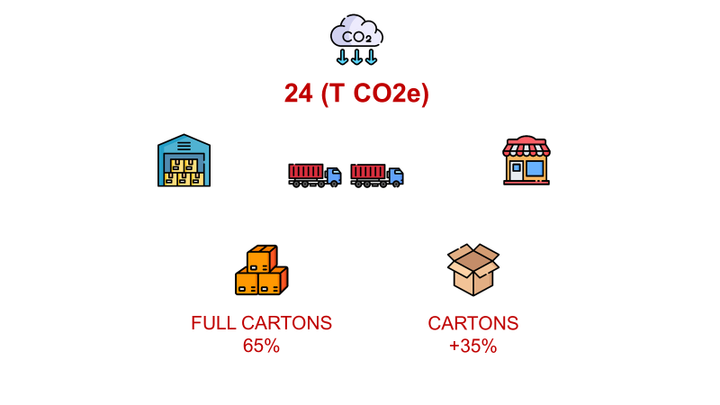
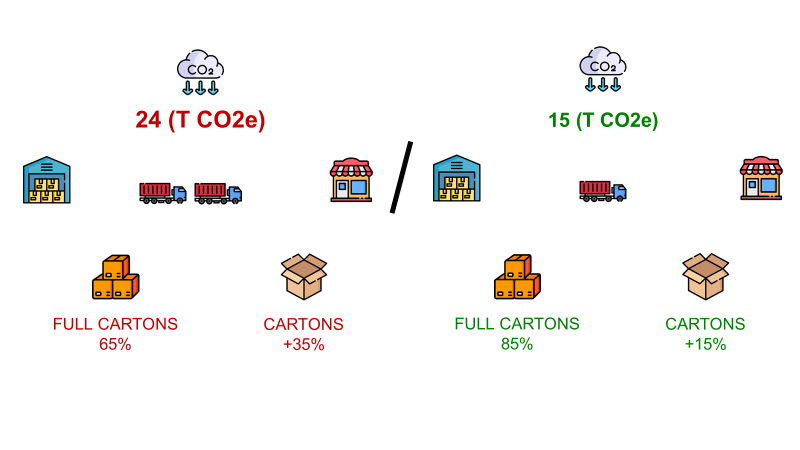
What are the impacts on CO2 emissions?
On the left, we can see that we have more store deliveries (with lower quantities per shipment) over the same time period.
Impact on the carton usage

Items are received in cartons containing units that can be picked individually.
If the order quantity is five, the operator will
- Open a box of 20 units and take five units
- Take a new box and put these pieces inside
- Complete the box with other items ordered by the store
The total number of mixed cartons can be easily computed using the formula below.
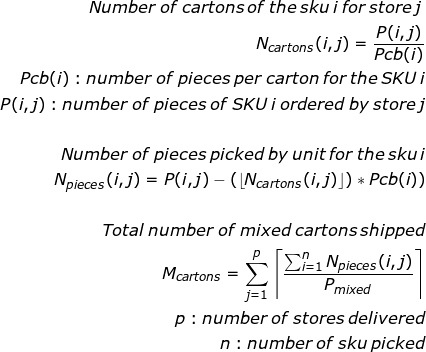
These boxes (or mixed cartons) will require additional packing material, which will increase your footprint.
With a high frequency, the quantity per replenishment is reduced, and this situation can occur more.
Impact on transportation emissions
The review period can also affect the number of deliveries during that period.
If you double the delivery frequency, you reduce the number of pallets per truck and impact the filling rate.
Thus, you may have to travel farther distances (and use more fuel) to replenish the same quantity of goods in the stores.
Experiment
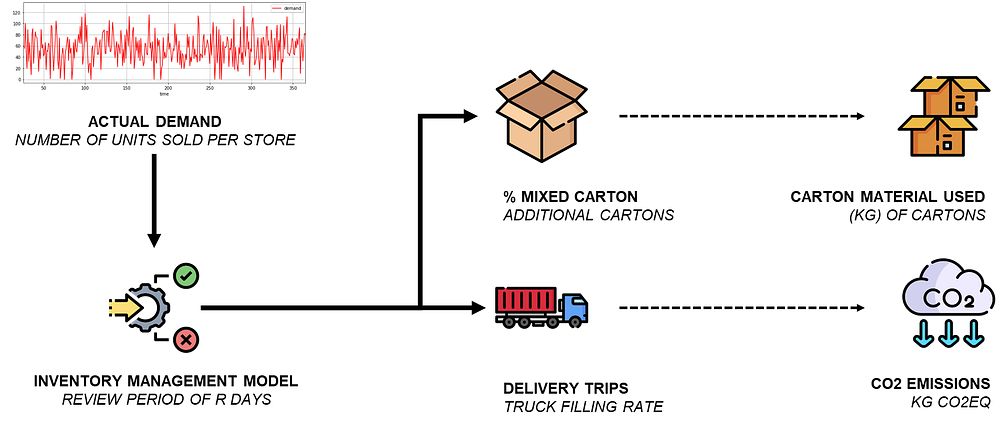
Simulation Model
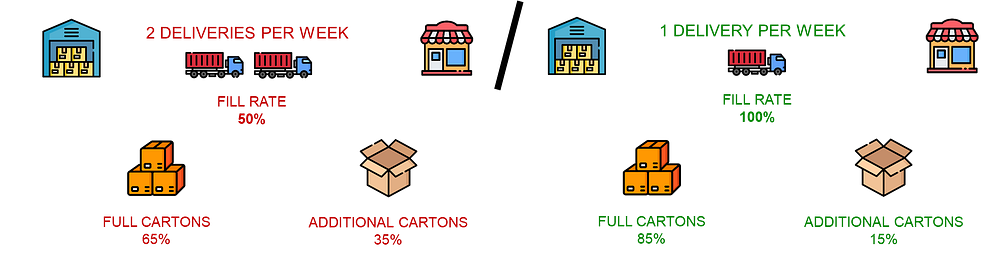
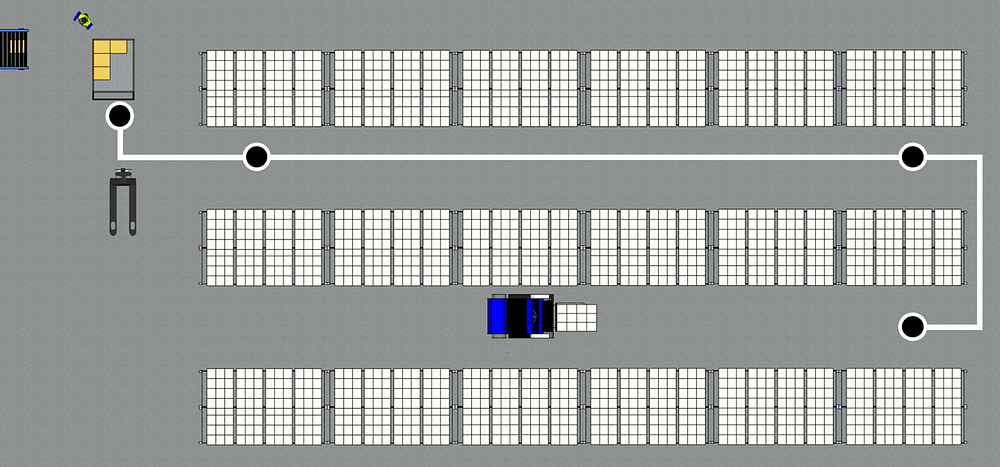
We will use the example of a logistics network that replenishes 10 fashion retail stores in the Shanghai region (PRC).
In this simulation, we will consider
- 90 days of sales of 10 stores located around the warehouse
- 740 unique items (SKU) sold in these 10 stores
- The number1-day of units per full carton provided by the master data
- 12 pieces per mixed carton
- 1-day lead time between order creation and store delivery
Based on these parameters, we can estimate the truck filling rates and the number of additional boxes needed. [Ref. 1, Ref. 2]

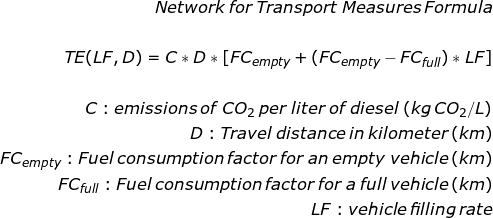
We can then estimate the environmental impact using the following parameters,
- CO2 emissions of trucks are estimated using the NTM (Network for Transport Measures) methodology, with the transportation distance and emissions factors
- Based on the mixed carton dimension and thickness, we can estimate the quantity of material per carton
💡 Insights
- NTM methodology can help us consider the impact of the truck filling on your overall emissions
- To improve the model, we can also consider the filling material (in your mixed cartons) and the wrapping film on your pallets.
Scenarios
We will simulate overall emissions and carton material usage over a review period of 2 to 10 days.
For each scenario, we will look at
- The percentage of mixed cartons prepared (%)
- The total quantity of carton material used to prepare these mixed cartons (kg)
- The percentage of partially filled trucks used to deliver the stores (%)
- The total CO2 emissions of road transportation (kg CO2eq)
Results
Transportation Emissions
The initial assumption was that a lower delivery frequency would improve truck filling rates and reduce emissions.
This is confirmed by the simulation results below.
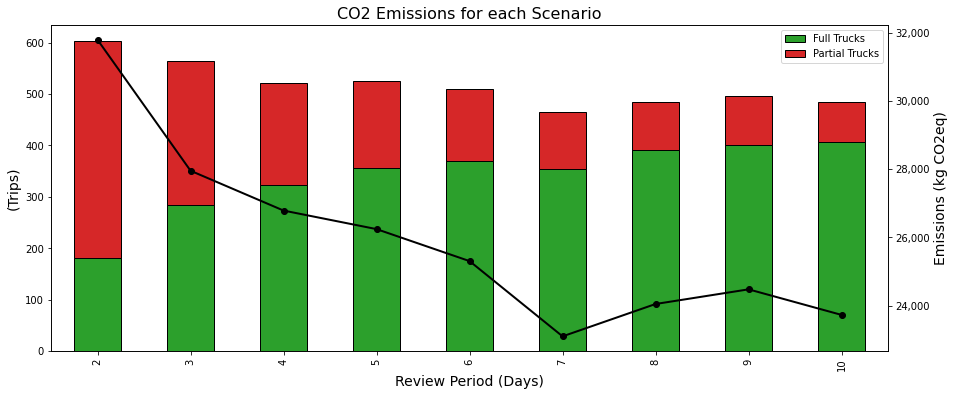
💡 Insights
- The minimum number of trips is reached for a review period of 7 days
- -27% of emissions between Scenario 1 (R =2) and Scenario 6 (R = 7)
- -51% of trips between Scenario 1 (R =2) and Scenario 6 (R = 7)
As we can see, emissions increase for R > 7, and the optimal rule appears to match the demand for weekly seasonality.
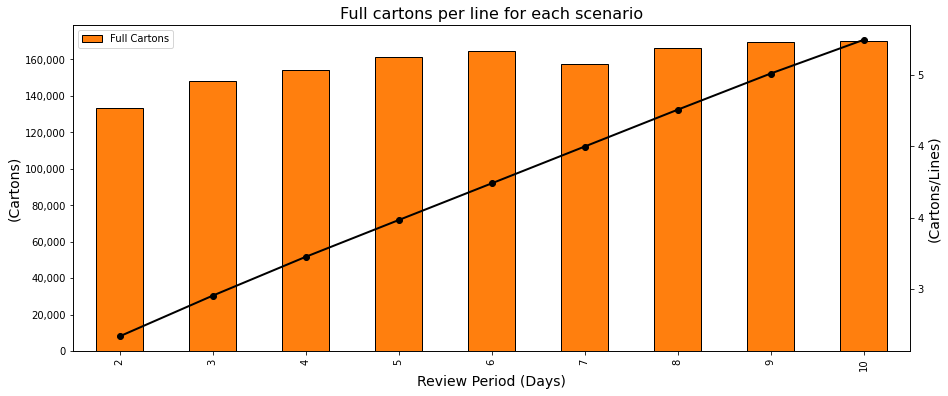
Carton Material Usage
For each scenario, we count the number of mixed cartons we need to prepare to fulfil the replenishment orders.
With fewer orders, we are supposed to increase the quantity per order and reduce the percentage of items picked by the piece.
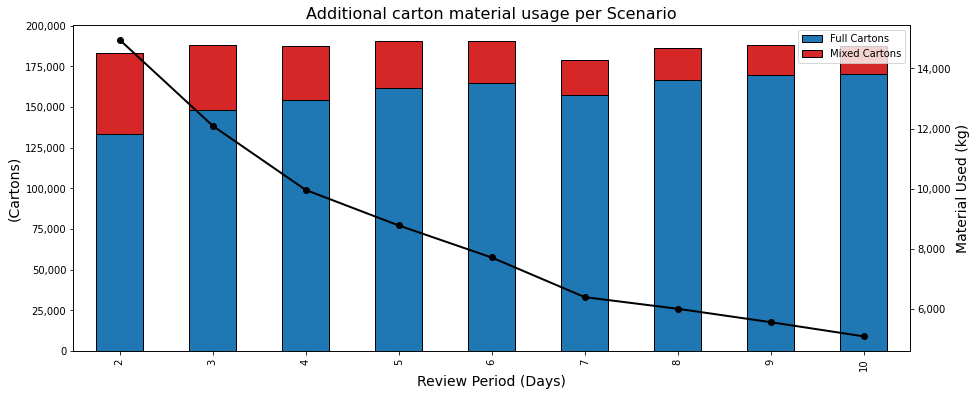
💡 Insights
- As expected, the total number of cartons prepared remains stable, as total demand during the simulation period remains the same across all scenarios.
- The percentage of mixed cartons is dropping from 27% (Scenario 1: R = 2) to 9% (Scenario 9: R = 10)
- -65% of carton usage between Scenario 1 (R= 2) and Scenario 9 (R= 10)
Productivity & Social Impact
In a Distribution Centre, walking time from one location to another during the picking route can account for 60% to 70% operator’s working time.
A major parameter influencing your operators' productivity is the number of cartons picked at each location.
Their productivity is measured by the number of cartons picked per hour paid.
And they can receive bonuses added on top of their base salary if they achieve their targets.
For example, with a target of 200 boxes/hour, the operator will need less effort to reach if he takes four cartons per stop than if he takes two cartons per stop.
💡 Insights
- +65% full cartons per replenishment order line
- Operators will prepare, on average, 2.07 boxes more for the same picking route distance.
This will reduce your human resources variable costs and help operators reach their targets with less effort.
Drawbacks: average store inventory level
As nothing is perfect, there are some drawbacks to increasing the review period.
When your replenishment frequency is lower, you need to increase stock coverage in your stores.
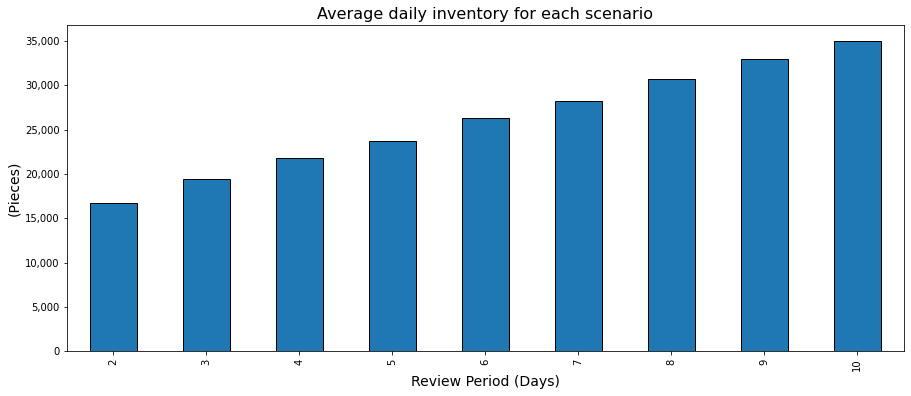
💡 Insights
- +108% of average inventory for all stores between Scenario 9 (R = 10) and Scenario 1 (R = 1)
That means you will need additional storage space in your stores.
Conclusion
A balanced approach is needed
Like everything in Supply Chain Management, it is a matter of balance.
Depending on the cost per sqm at your store locations, you can allocate more or less storage space.
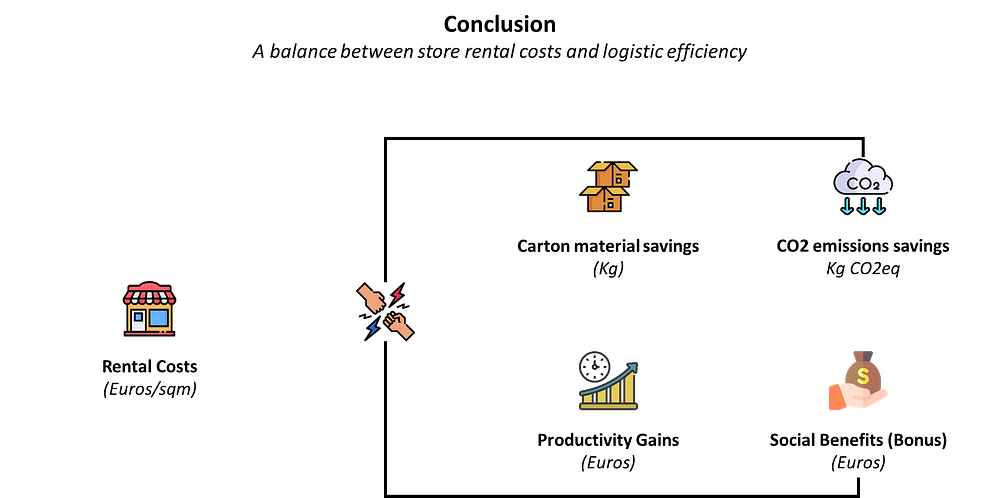
However, this additional cost should be put into perspective with the potential savings of warehousing and transportation.
What about the user experience?
When I adapted this solution to productise it in the LogiGreen Apps suite, I quickly understood that the approach may be too "complicated" for most users.
It requires some onboarding that can be easily done by AI.
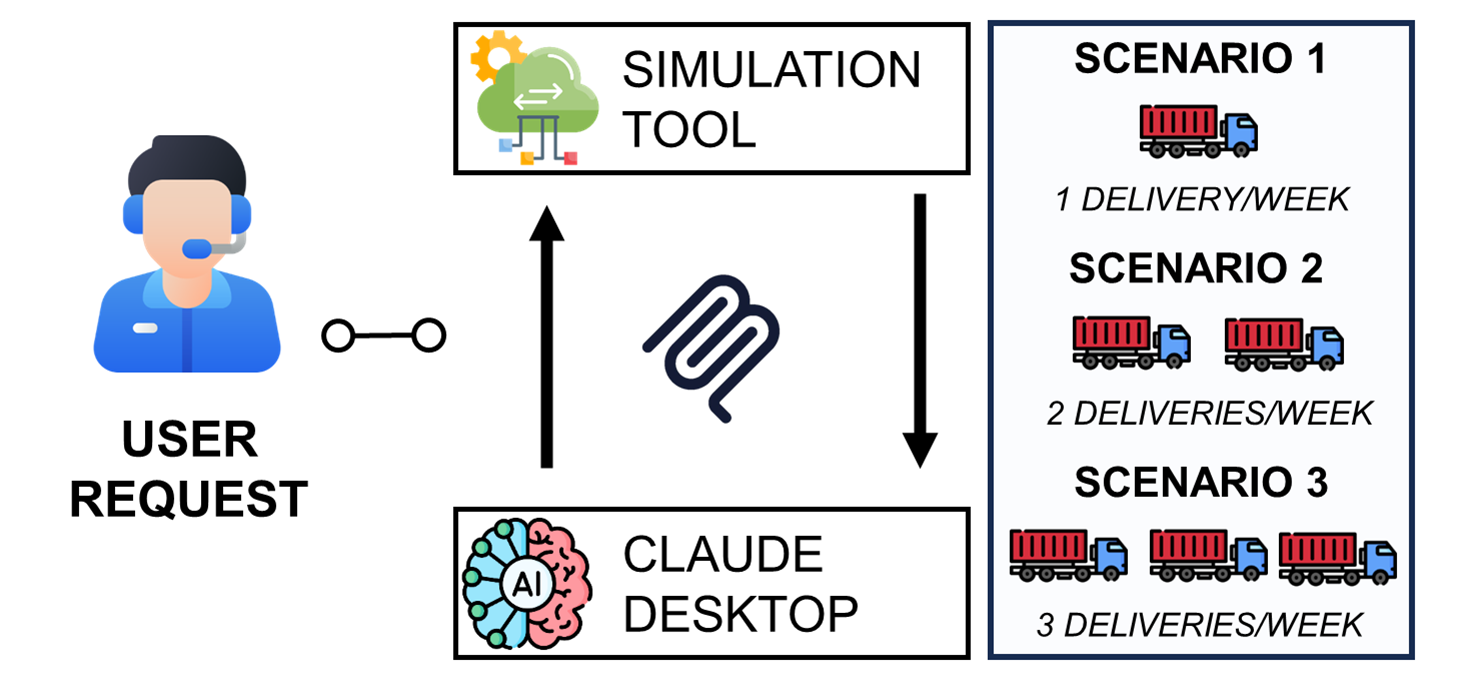
Therefore, we experimented with using MCP servers to connect this module to Claude AI.
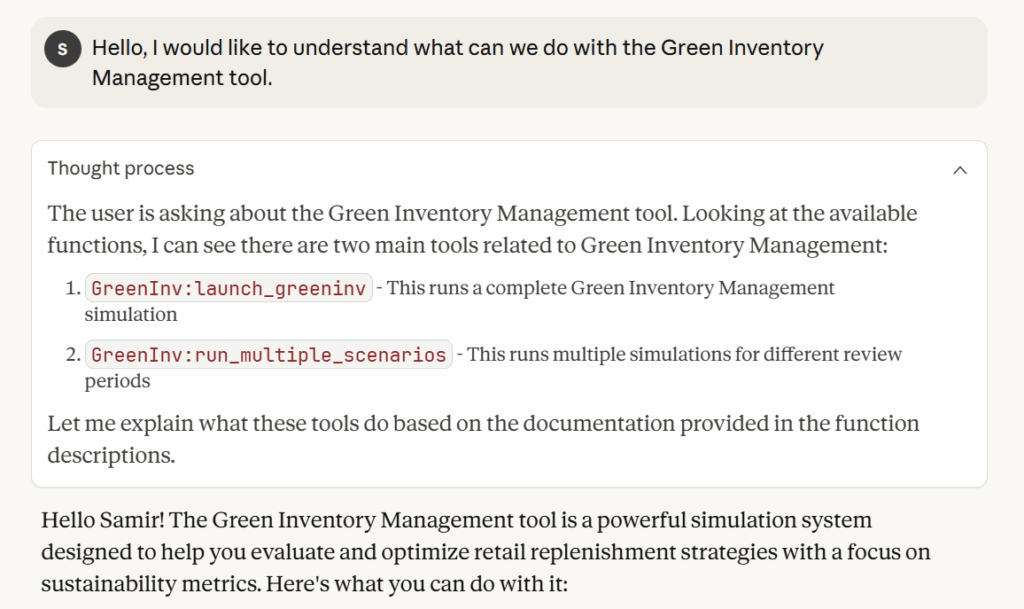
The result is quite satisfactory: beyond helping the user set up the parameters, Claude is very good at analysing and summarising results.
For more details, I share the complete experiment in this article.
Improve the simulation
If you need additional savings to convince your management, you can improve the model by bringing additional savings calculations.
- Goods handling processes in the warehouse: picking locations, replenishment, truck loading, carton packing
- Receiving at the store: truck unloading,
- Packing Material: filling material, labels, pallet wrapping
You can compare the ratio of emissions reductions per euro invested with other green solutions like e-trucks, renewable energy, or recycled packaging materials.
About Me
Let’s connect on LinkedIn and Twitter. I am a Supply Chain Engineer using data analytics for supply chain optimisation, sustainability and personal productivity.
If you’re looking for tailored consulting solutions to optimize your supply chain and meet sustainability goals, feel free to contact me.