What are the Challenges in Circular Economy for Fashion Retail?
Will your company implement a circular economy? Simulate a circular rental model to estimate store operations and logistics impacts.
The concept of a circular economy includes models aiming to reduce waste and improve resource efficiency.
For instance, some fashion retailers have implemented a subscription model with which customers pay a regular fee to rent a product for a specific period.
In a previous article, I introduced the simulation of a rental model implemented in 10 fashion retailer stores.
The approach focused on analyzing the environmental performance, i.e., reducing CO2 emissions and water usage.
What are the operational challenges of implementing this model?
To support this transition, logistic operations face additional challenges in collecting and processing rented items.
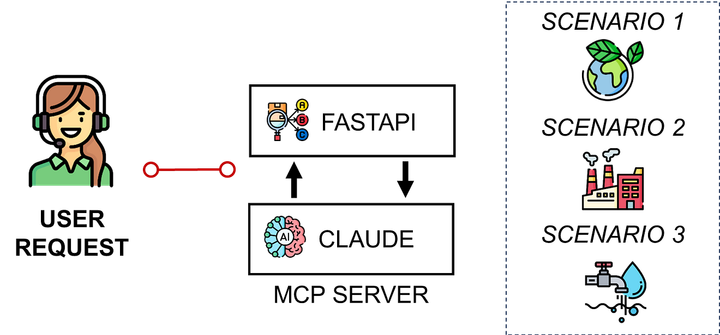
In this article, we will explore how to use analytics to estimate these challenges and understand which metrics are key to redesigning your logistics network.
After a quick introduction of the operational case, we will explore several indicators to estimate the additional workload for store operations and transportation management.
Circular Model for a Fashion Retailer
Introduction of the Rental Model
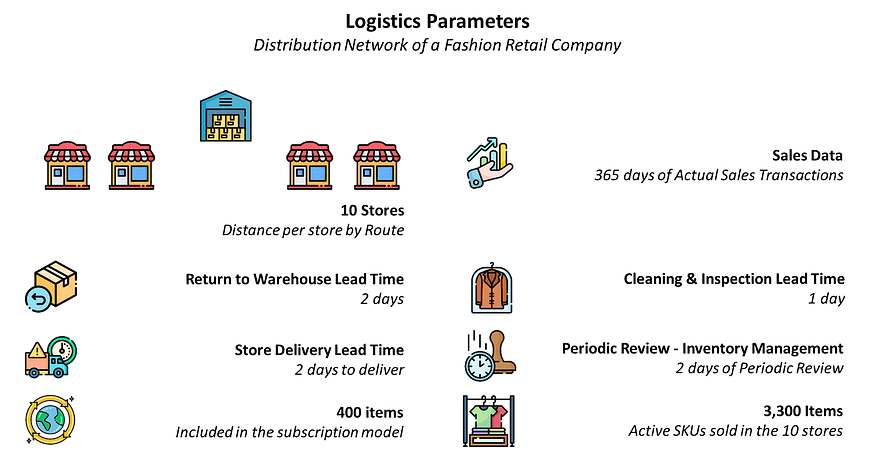
To reduce the environmental impact of its supply chain, a Fashion Retailer decided to experiment with a circular economy model in 10 stores.
These locations propose a rental subscription model to their customers for a limited scope of 400 items.
Before implementing this special service, logistics teams requested your support in designing the processes to handle these special flows.
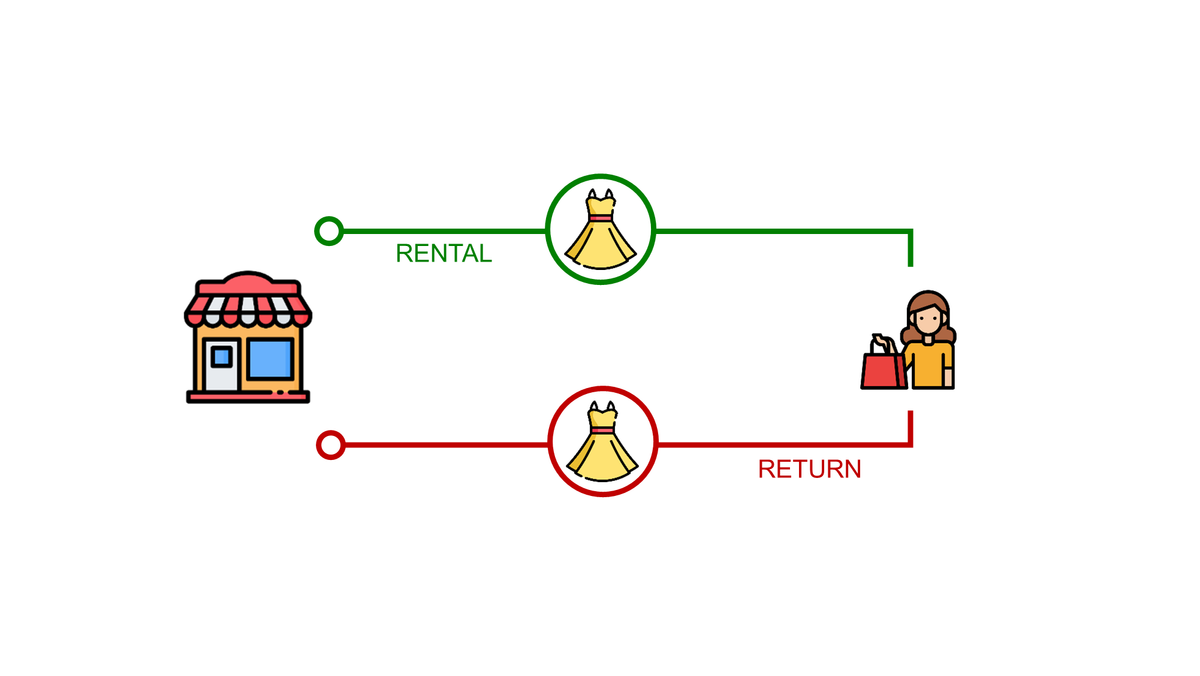
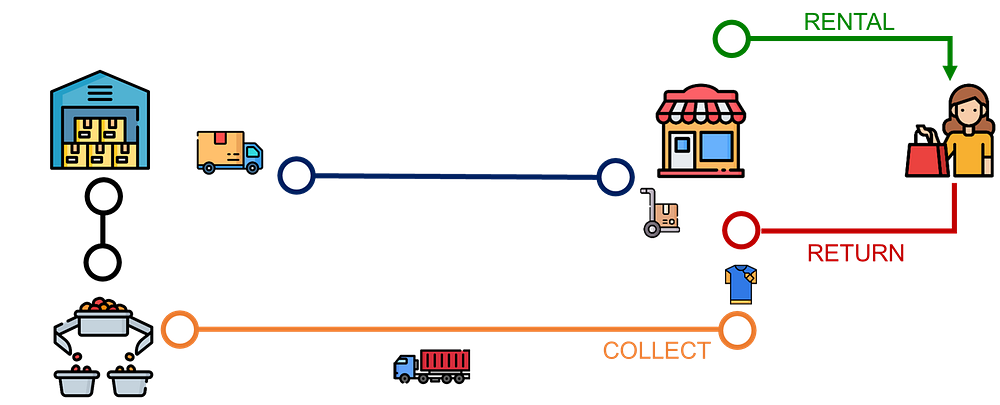
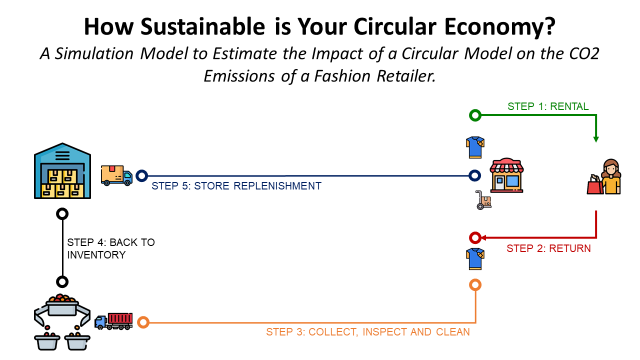
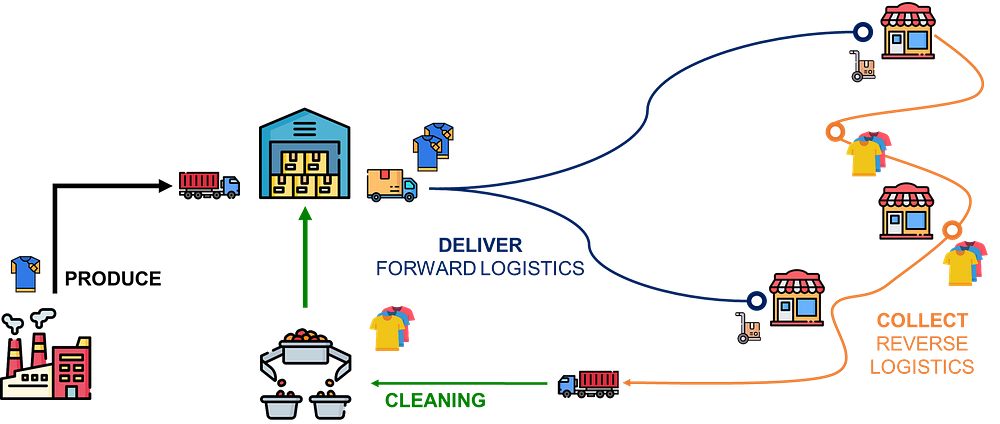
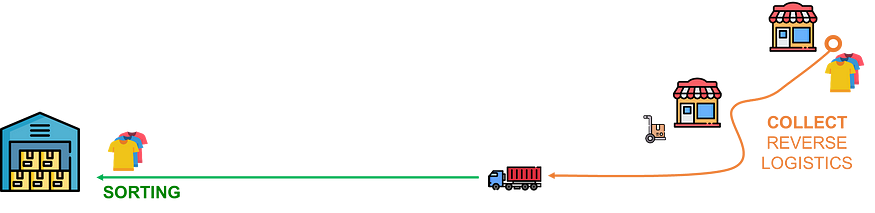
After the rental period ends, customers return the items to the store
- It takes 2 days to have these items collected from the stores.
- They go through inspection and cleaning at the warehouse for 1 day.
- It takes another day to have the cleaned items delivered to stores.
The simulations are based on actual sales transactions of 10 stores for a duration of 365 days.
We apply the First-In, First-out (FIFO) principle to manage these flows.
When a customer requests a specific item, we have two scenarios:
- Circular Transaction: TheI start by collecting the metrics and parameters needed to design transportation and warehouse solutions for store will rent out returned clothes if there is sufficient inventory.
- Linear Transaction: The store will rent out a new item if the inventory is insufficient.
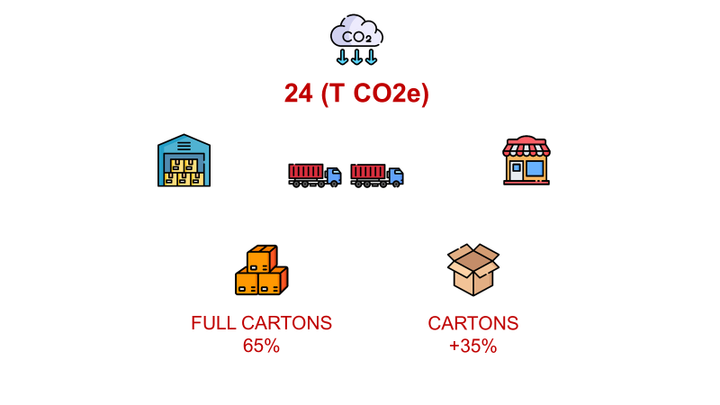
The focus was on the circular model's environmental performance, and several rental period scenarios (2, 7, 14, and 28 days) were explored.
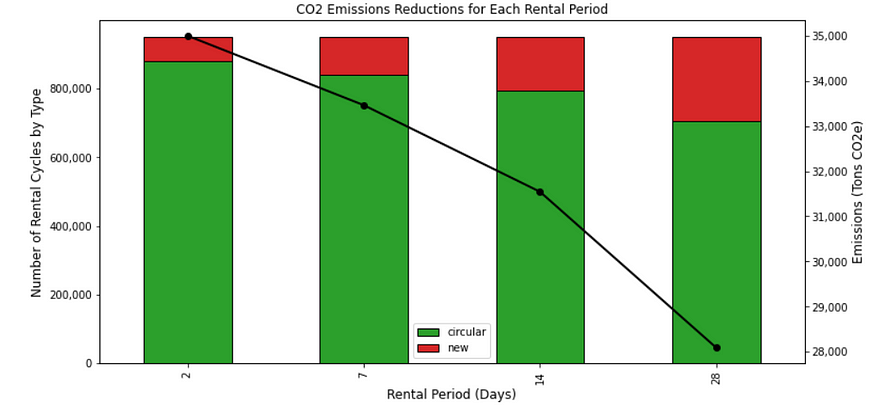
For each scenario, we calculate the percentage of circular transactions (items reused) and the impact on CO2 emissions reductions.
Conclusion: We can reach high emissions reductions that are maximized with short rental periods.
You will find more details in this article,
What are the additional challenges for the logistic operations?
How do we implement these processes?
Now that we know the potential environmental benefits, I want to focus on the operational implementation to support this model.
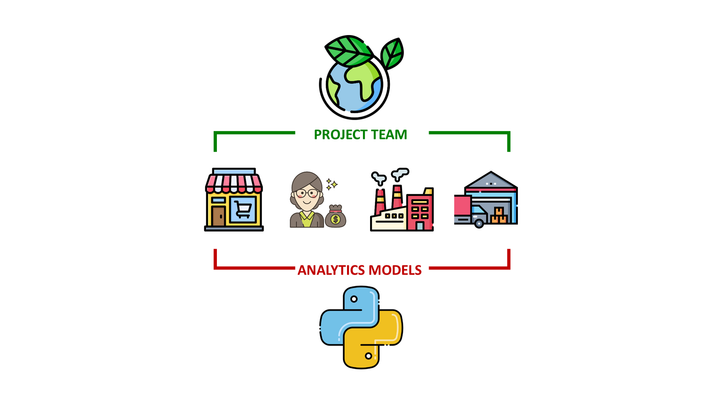
As a former Supply Chain Solution Designer, I start by collecting the metrics and parameters needed to design transportation and warehouse solutions for reverse flows.
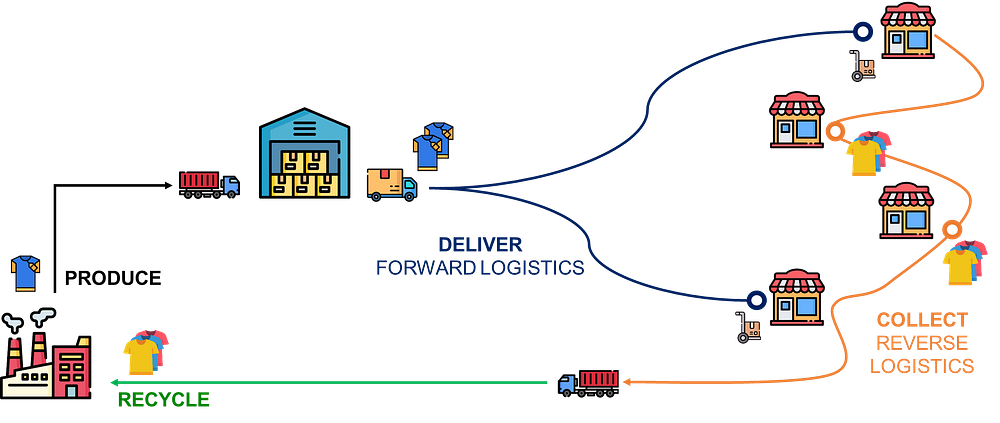
These solutions should cover
- The collection of returned items from stores with electric trucks.
Question: How many trucks are needed to collect items every day? - Receive and process items in the warehouse.
Question: How many operators are needed to receive and process items in the warehouse? - Deliver the cleaned (returned) items back to the stores.
Question: How many trucks are needed to manage these deliveries?
In the next section, I will show several examples of metrics and explain how they are important to designing the solution.
Logistics Network for a Rental Circular Model
Let us now explore the simulation model from a logistic perspective, focusing on goods flows.
We will assume that the rental period is 7 days.
First, we can monitor the rental transactions at the stores and the impact on returned items.
Focus on the store operations: daily transactions per type
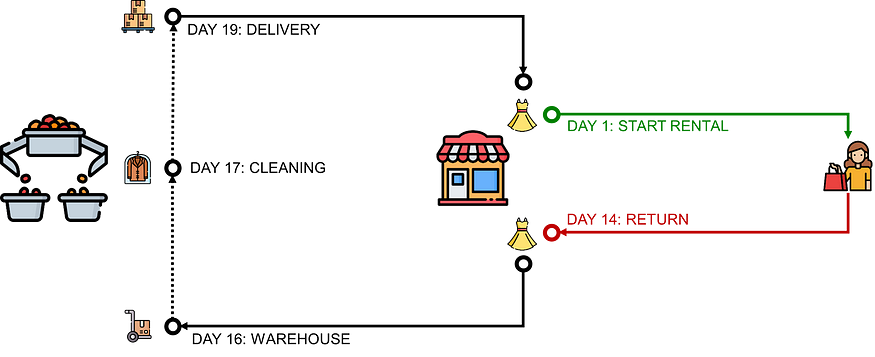
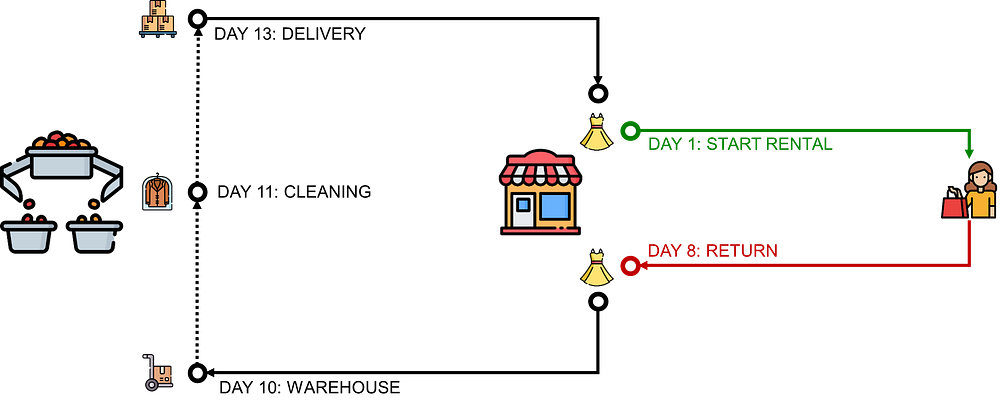
The circular model starts on day 1
- 100% of the items rented are new
- These items will be returned on day 8 to start a process of collection, processing and delivery, ending on day 13
What is the impact on store operations?
💡 Indicator 1: % of items reused or rented
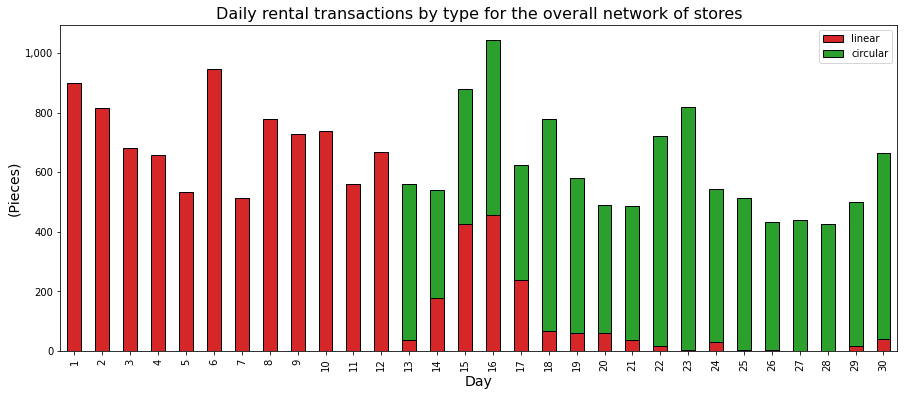
From Day 13, the percentage of circular rentals exploded.
The loop started with an inventory of rented items, built to avoid using new items.
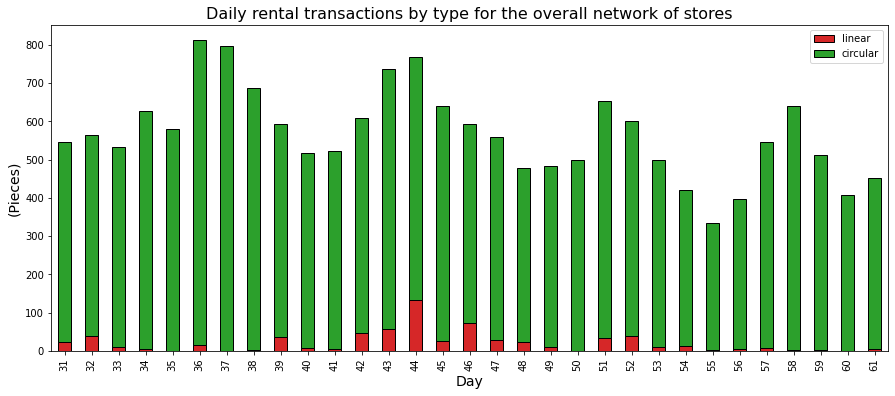
From the second month, less than 12% of new items (linear transactions) are used for rental transactions.
🚚 What does that mean from a logistics point of view?
- The inventory of new items coming from the factory should be reduced.
💡 This leads to the reduction of the storage space in the warehouse. - We need fewer replenishments from the factory.
for
This reduction in the upstream flow's workload is offset by the additional workload in the reverse flow.
💡 Indicator 2: number of items collected per day
After the end of the rental period, customers return their garments.
This creates an additional, measurable workload for store staff.
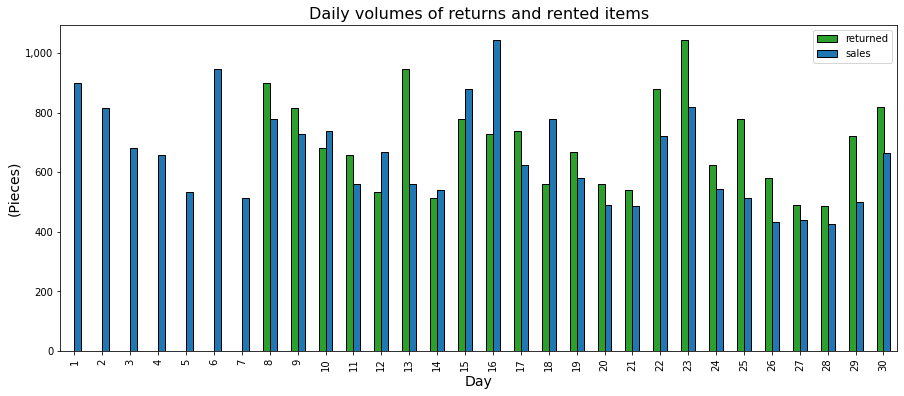
From Day 8, there is (nearly) the same daily amount of units rented and returned.
When rental sales peak (like on day 16), we observe the same peak in returns seven days later (day 23).
🏪 What is the impact on store operations?
- We doubled the number of interactions with customers.
💡 Additional staff are needed to process these returns. - Additional storage space is needed to store returned items.
As returning items may take up to two days to be collected, stores must allocate space to stock the equivalent of two days of rental transactions.
💡 Indicator 3: number of totes collected per day
Collected items are stored in plastic totes (10 pieces per tote) with fixed dimensions.
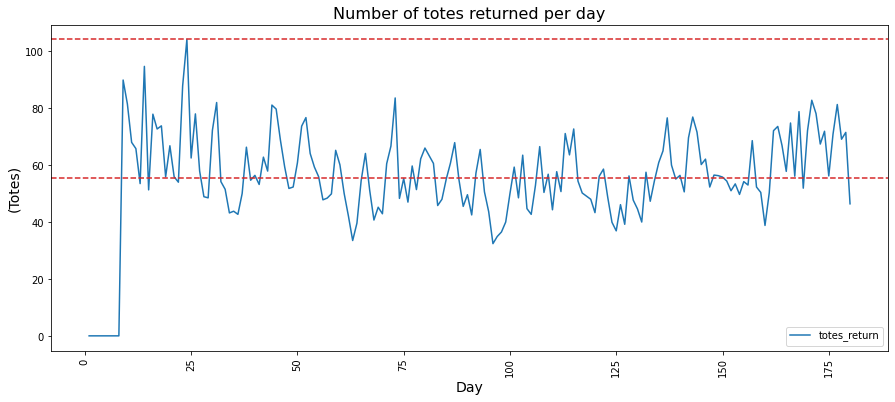
We have an average of 56 totes collected daily, with a peak of 105 totes for day 25.
🏪 What is the impact on store operations?
- We need to allocate storage locations for up to 210 totes.
💡 Do we have additional space for these totes? - There is a workload linked to the management of these 56 totes.
💡 Do we have enough staff to manage this internal logistics?
Now that we have returned items in totes let’s turn our attention to the collection process.
Focus on transportation management.
We need to analyze the daily volumes to collect per store to plan the collection routes.
The transportation teams will use trucks with a maximum pallet capacity.
These trucks can be collected from different stores.
💡 Indicator 4: number of pallets to collect per store
Totes are loaded on pallets with a maximum capacity of 25 totes per pallet.
The stores are located in three areas: Area A, with four stores, and Area B and Area C, with three stores each.
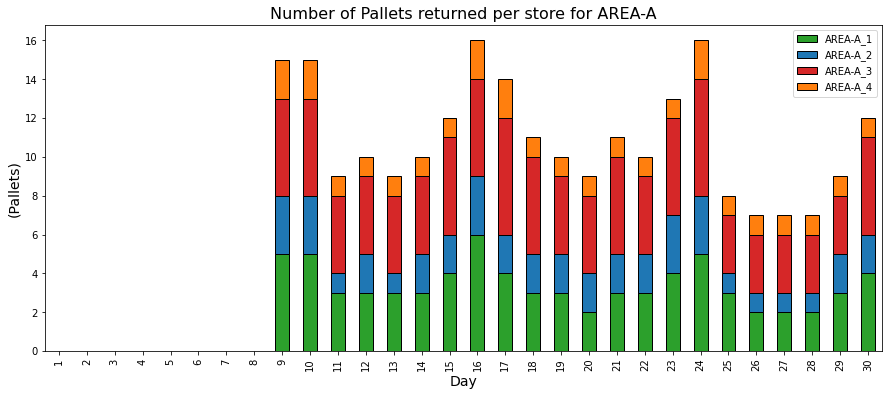
The stores in each area can share the same truck for collecting pallets of returned items.
💡 Indicator 5: Number of full trucks needed per store
The transportation teams allocated 14-pallet trucks.
How many trucks do we need per store?
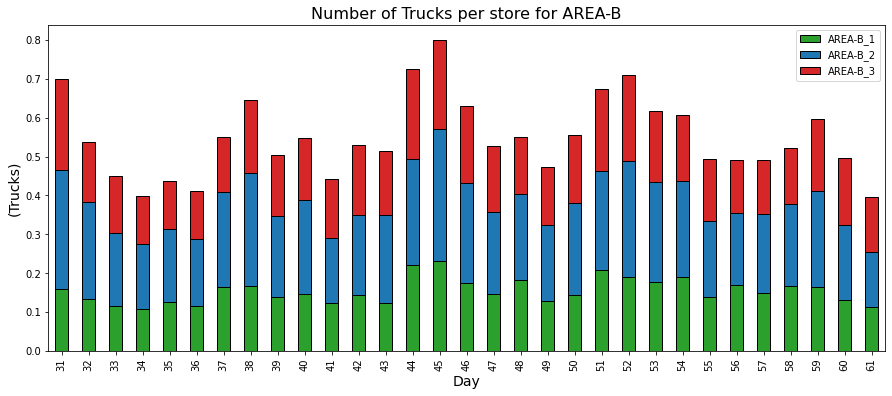
As you can observe, you cannot fill a full truck by only collecting a single store in Area B.
P.S: As you can reach only an 80% filling rate if you collected from the three stores, you may consider adding a store in the collection route.
🚚 What is the impact on transportation routing?
- Transportation planners must organize routes with several collection points to maximize the usage of trucks.
- Based on past rental transactions, they can forecast return volumes to create optimal routes.
These five examples of indicators give you an overview of how specific metrics can help engineers overcome future challenges and design solutions to manage complex flows.
Conclusion
This simple methodology can be applied to any retailer's business case for transitioning to a circular economy.
This starts with simulating circular transactions, like in the previous article.
- Use actual sales transactions for a specific period.
- Implement inventory management rules considering the rental periods and the reverse flow processes ;
- Estimate the impact on footprint reduction and the percentage of items reused.
Then, improve the model by adding specific metrics to estimate the additional workloads for store operations and transportation
- Take the angle of a Supply Chain Solution Designer that uses volumes and logistic ratios to design processes ;
- Use the insights to make decisions that will ensure smooth operations with high efficiency
The approach presented in this article provides the data I would ask a retailer requesting my support (as a supply chain solution designer) in designing this kind of solution.
About Me
Let’s connect on LinkedIn and Twitter. I am a Supply Chain Engineer using data analytics to improve logistics operations and reduce costs.
If you need consulting or advice for your supply chain transformation, please contact me via Logigreen Consulting.