How Sustainable is Your Circular Economy?
Use Data Analytics to Simulate the Impact of a Circular Model on the CO2 Emissions and Water Usage of a Fast Fashion Retailer.
A circular economy is an economic model that aims to minimize waste and maximize resource efficiency.
It involves designing products and processes focusing on longevity, reuse, and recycling.
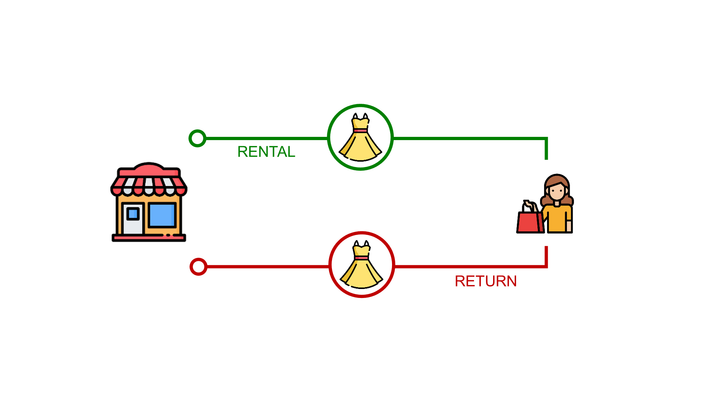
Some companies have implemented a subscription model in which customers pay a recurring fee to access a product or service for a specific period.
The objective is to reduce the environmental impact throughout your product's life cycle; a rented product is produced once and reused several times.
You reduce the resources and energy needed for manufacturing, but you may increase CO2 emissions associated with your rental service's logistics.
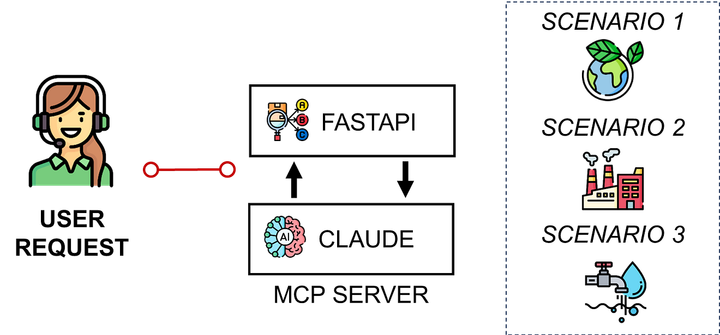
In this article, we will simulate the impacts of several circular subscription model scenarios on a fast fashion retailer's emissions reductions and water usage.
I. Scenario
1. Distribution Network of a Fast Fashion Retailer
A Warehouse to Replenish 10 Fashion Retail Stores
2. Inventory Management x Rental
How can you manage the inventory of items you rent to customers?3. Life Cycle Assessment: Linear vs. Circular Model
CO2 emissions cut we can reach by renting instead of selling garments
II. Simulation Model
1. Example with Rental Period = 7 days
% of rental with items reused is impacting the CO2 and Water cuts
2. Rental Period = 2, 7, 14, 21 and 28 days
What is the best scenario for footprint reduction?
III. Conclusion
1. Results
-60% CO2 emissions and -74% of water usage for the worst case
2. Impact of Demand Variability
Variability reduces % of rental transactions done with reused items
3. Next Steps
Optimal Rental Period x Logistics Solution Design x Stores Operations
Scenario
Distribution Network of a Fast Fashion Retailer
We will take the example of a Fast Fashion Retail company with 10 stores in the city of Shanghai (PRC).
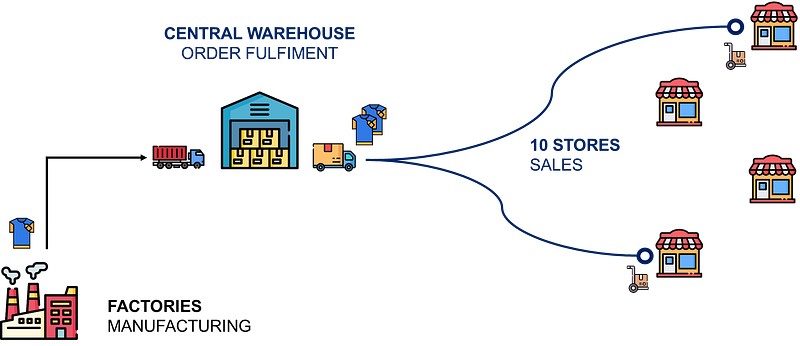
Their inventory is managed by distribution planners using an ERP
- Stores are replenished by a Central Warehouse
- Central Warehouse is replenished by factories
We will use the model designed for the previous article about Green Inventory Management considering the following assumptions
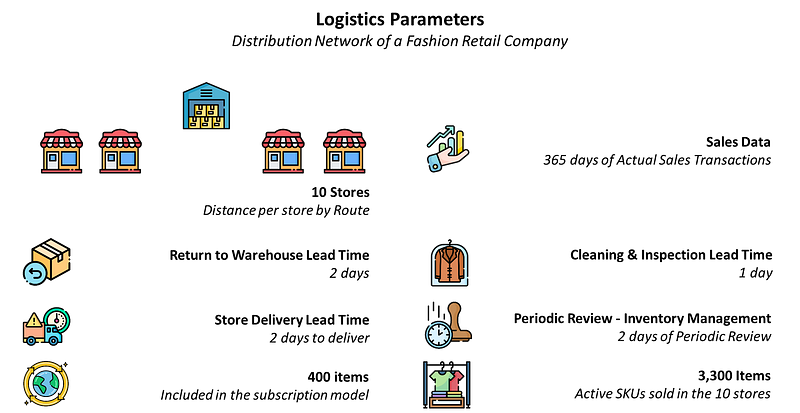
- 10 store locations
- 365 days of sales transactions
- 3,300 active SKUs with 400 SKUs included in the circular model
- Inventory Periodic Review Policy Rule: 2 days
- Delivery Lead Time from Warehouse for Circular Items: 2 days
- Cleaning & Inspection at Warehouse: 1 day
- Return to Warehouse Lead Time: 2 days
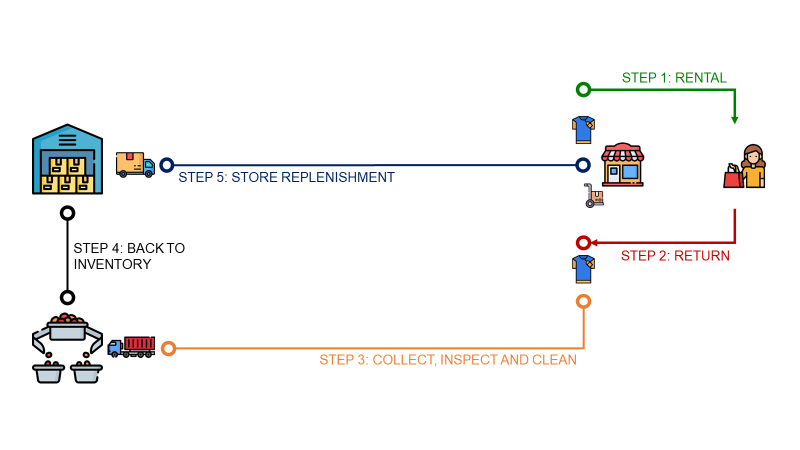
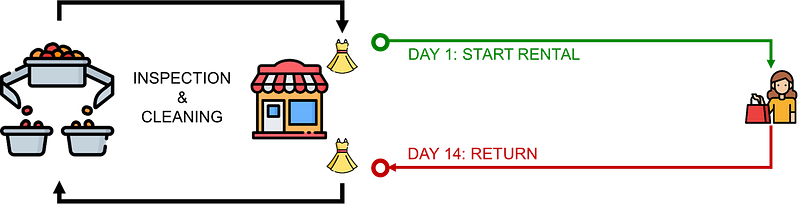
In short, that means your stores are replenished by the Central Warehouse every two days.
When an item is returned after the rental period, it takes 2 days to ship it back to the warehouse.
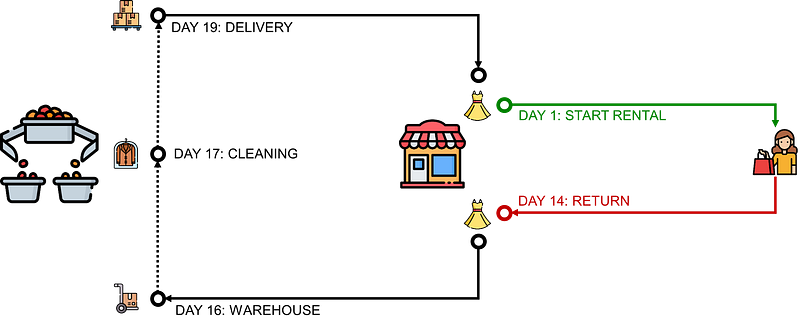
Another day is needed to inspect and clean.
And finally, it will be returned to a store after 2 additional days.
Inventory Management x Rental Model
We will apply the First-In, First-Out (FIFO) principle for every order coming from stores.
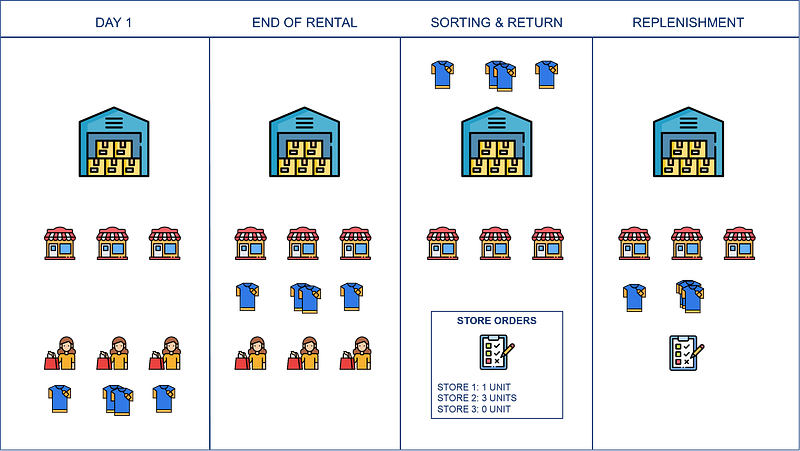
Taking the example above, these four items returned from stores are available for order after cleaning and inspection.
Because Store 2 ordered first, the first three units to arrive in the warehouse will be shipped to Store 2.
💡 Additional Insights
- That means an item can be rented in several stores along its life cycle.
- If the inventory of rented products is too low, orders are completed with new items.
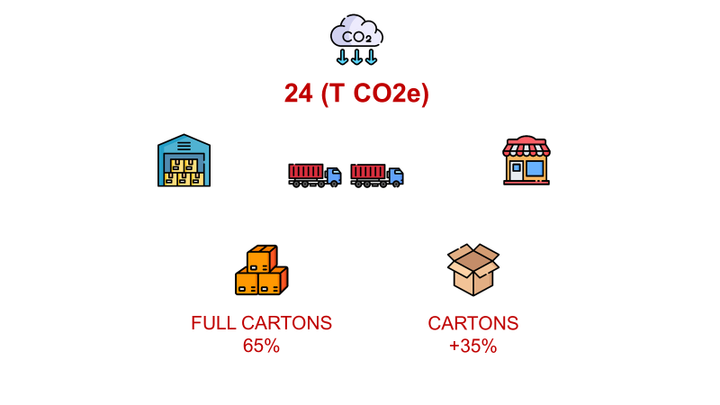
Life Cycle Assessment: Linear vs. Circular Model
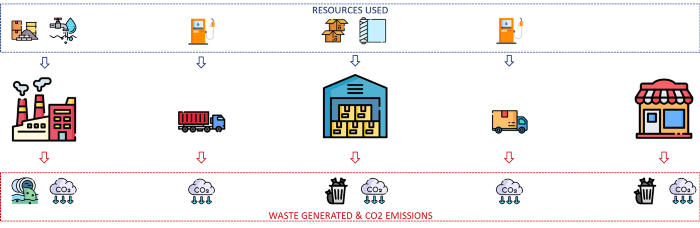
The objective is to estimate the impact of the circular model on
- Total CO2e emissions of your Supply Chain (kg CO2e)
- Quantity of water used to produce and deliver items to stores (L)
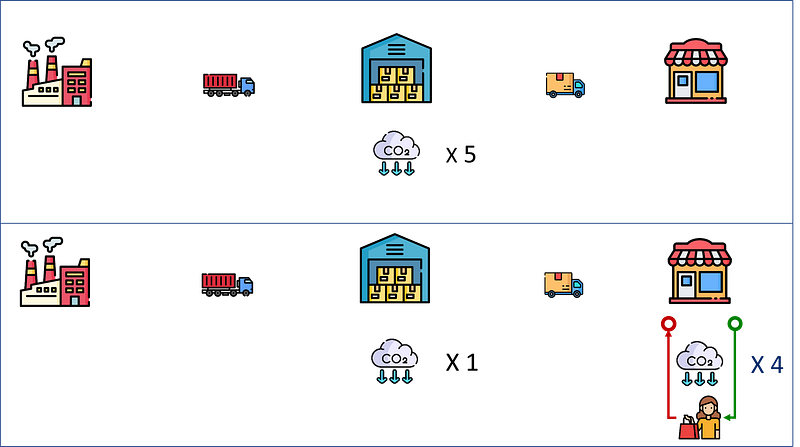
In the circular model example, a single item is purchased and used five times.
The total footprint includes a single full cycle and four return processes.
We can then estimate the savings using the formula below,
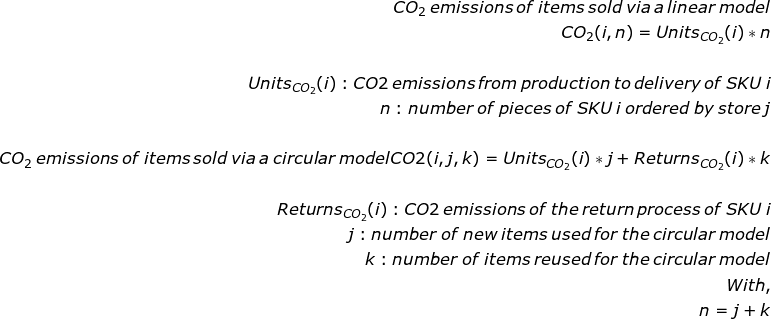
💡 Additional Insights
- Savings will be impacted by the percentage of items reused
- The same calculation will be done for water usage.
- Emissions and water are taken from the master data.
- The additional impacts are estimated using the parameters listed below.
- If no rented items areincludes in stock, new items are shipped to the store for replenishment.

Let us now simulate the distribution flows, no rented items are considered
- Rental durations of 2, 7, 14 and 28 days
- Sales period of 6 months
Simulation
Rental Period of 7 days
Now that we have built our model with the assumptions listed above.
We can start to explore the results with a rental period of one week and see the impacts on CO2 emissions and water usage.
What is the percentage of new items used?
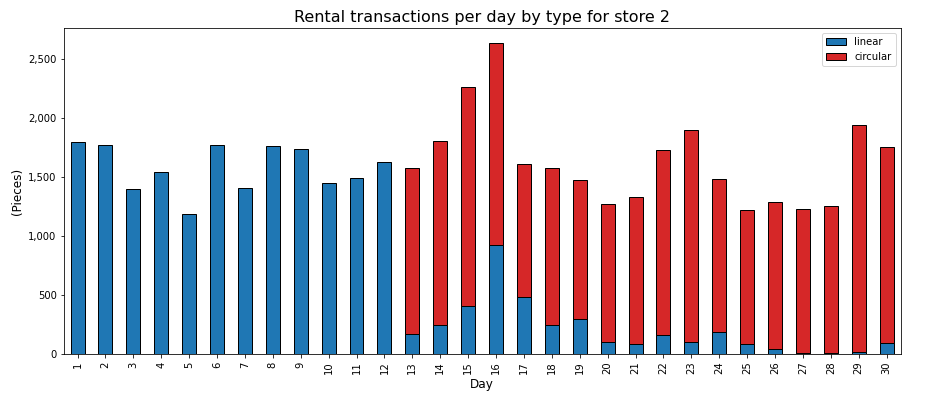
💡 Insights
- During the first 12 days, the inventory of returned items is zero, so the store is using new items for rental.
- When you have peaks of volume like on day 16, the accumulated inventory of returned items cannot meet the demand so you new items to meet the demand.
This ratio, which we’ll define as a new metric called the percentage of circularity (%), is an important parameter influencing the footprint of your circular model.
During the first 12 days, the footprint of your rental is the highest as we are using new items. This can be explained by looking at the volume of returned items.
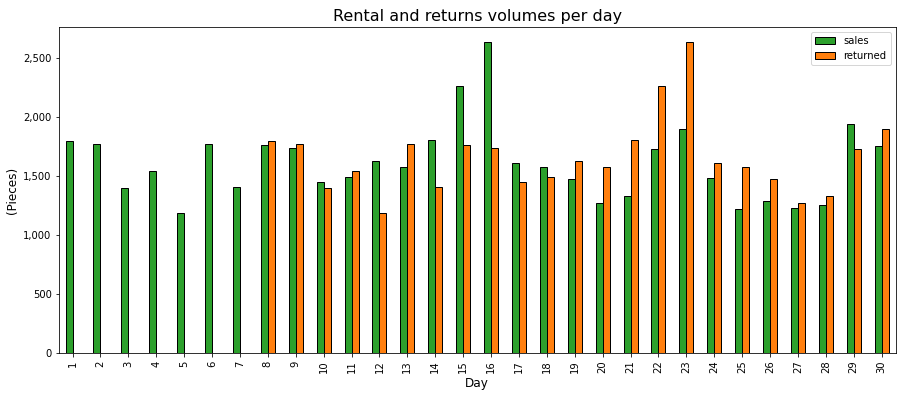
Indeed, we can see that the first batch of rented items are returned on day 8.
After 5 days of pick-up, warehouse delivery, cleaning, and store shipping.
When you have peaks of volume, like on day 16, the accumulated inventory of returned items cannot meet the demand, so you need new items to meet the demand.
They are available on day 13 for new sales.
From this day, we have a balanced distribution of rented and returned items which provides enough inventory to have >75% of items reused.
How many sales cycles per item on average?
In this doughnutof pick-up, warehouse delivery, cleaning, and store shipping, chart, we can visualize the distribution of items considering the number of rental cycles they are used during the 6-month period.
For instance, 9.8% of items have been used 10 times.
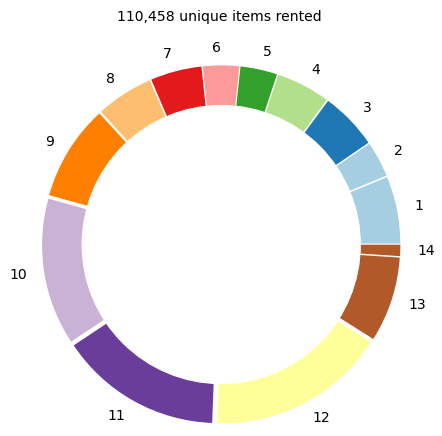
💡 Insights
- Only 110,458 unique items are used to fulfil 951,856 rental transactions, which makes an average of 8.61 rental cycles per item.
- The fact that some items can reach 14 cycles may raise the question of the maximum usage before disposal.
- A non-negligible part of the inventory is used only once.
What impacts on emissions reduction do we have for each item?
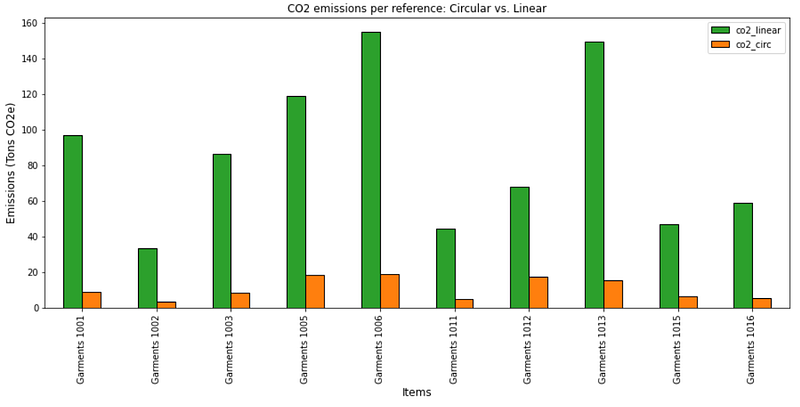
Take an example of a coat rented 35 times using ten unique pieces.
Linear model emissions (co2_linear in green) consider the total footprint if your customers purchase (co2_linear in green) these items. In this case, you’d need to produce and deliver 35 coats.
While the circular model’s emissions (co2_circ in orange) only include the production of 10 unique coats and the logistics for return management.
💡 Insights
- We can compare, for each item, the CO2 emissions if all items were used once (linear) with the circular model applied to this example.
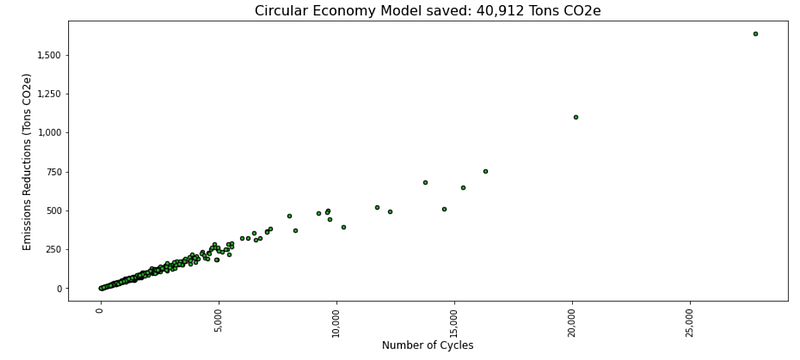
As expected, the amount of CO2e reduction is linearly linked with the number of cycles (i.e the number of times these items are reused).
What impacts the percentage of reused items?
Therefore, we would like (ideally) to reach 100% of rental transactions with reused items and limit the number of new items purchased.
When demand is extremely volatile, you usually face stock-outs in the inventory of rented products and you need to use newly produced items.
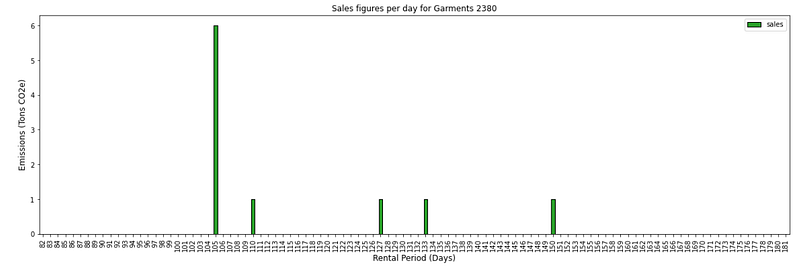
💡 Insights
- 60% of the total demand for this reference is on the peak of day 105 when zero inventory has been built.
- Therefore, the circularity percentage (the number of sales transactions fulfilled with reused items) is only 40%.
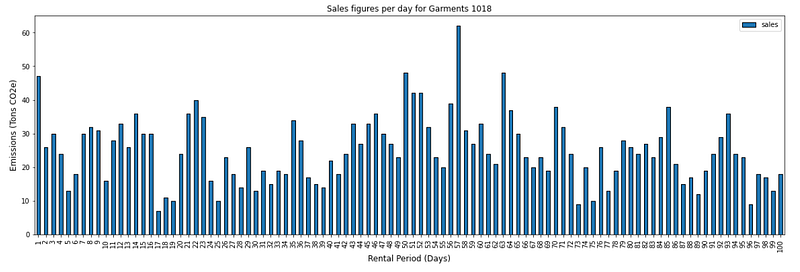
💡 Insights
- Except for the first days, the demand distribution provides enough flexibility to build an inventory of rented products (in your warehouse) to fulfil the demand with fewer new items.
- Therefore, we can reach 89% of sales transactions with reused products.
To sense the impact of the variability, we can introduce the Coefficient of Variation CV
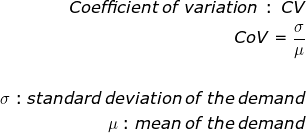
A demand distribution starts to be considered highly volatile for CV > 1,
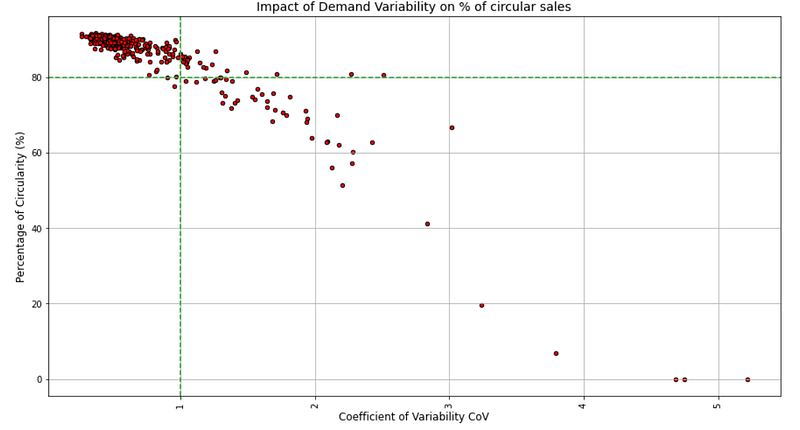
💡 Insights
- 99.9% of items with CV<1 have a percentage of circular sales higher than 80%
- As we can see some items with CV > 1.5 with a percentage higher than 70% we can sense that it’s not the only parameter impacting.
Logically, we can see the impact on the emissions reduction per item rented,
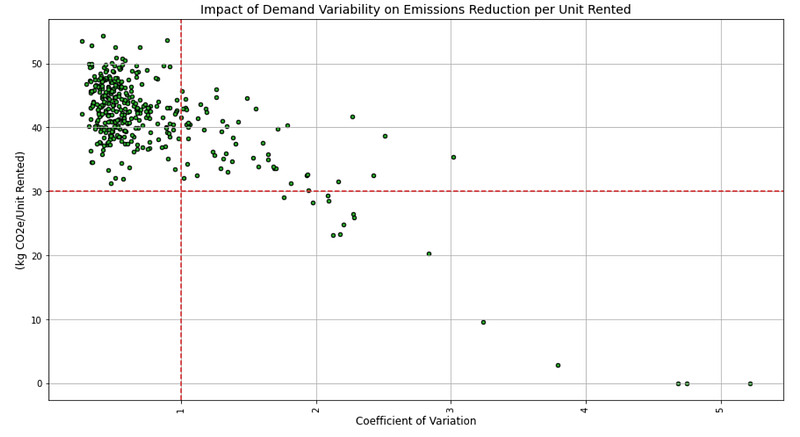
💡 Insights
- 100% of items with CV<1 have a reduction higher than 30 kg CO2e per Unit Rented.
Because we do not have control of the demand variability, let us see if we can improve the emissions reductions by changing the rental period.
Simulate for several rental periods.
In the previous section, we simulated a rental period of 7 days.
We can now run the model with rental periods ranging from 2 to 28 days.
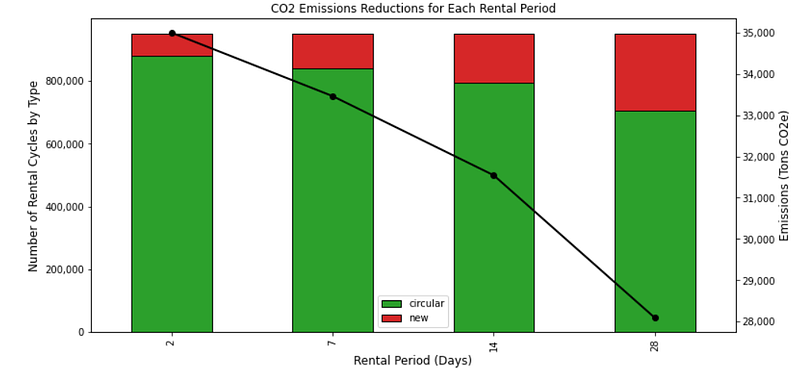
💡 Insights
- The reduction level decreases as the rental period increases.
- 2 days of the rental period: +4.5% of CO2 reductions vs. 7 days
- And we can see that it is directly linked to the percentage of rentals with reused items.
It can be verified by looking at the percentage of circularity of items with a rental period of 2 days,
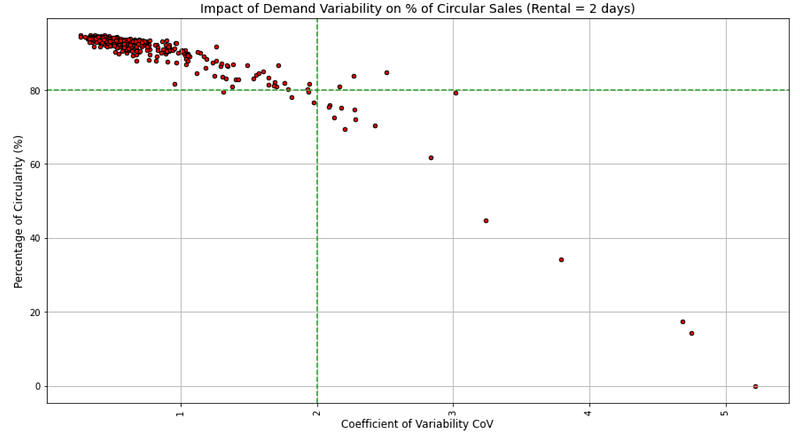
💡 Insights
- 99% of items with CV < 2 have more than 80% of their rental transactions fulfilled with reused items (versus CV<1 for rental period = 7 days)
A short rental period provides greater flexibility in dealing with demand variability.
Without any surprise, we can see the same trend with the amount of water saved,
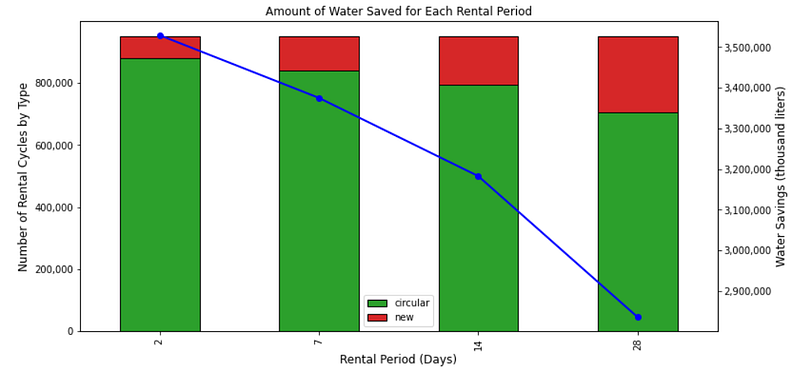
With longer rental periods, items' availability for rental is dropping.
You are then losing the flexibility needed to absorb demand's variability.
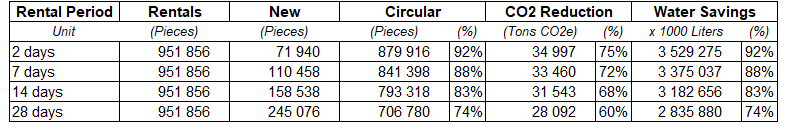
That’s why, as shown in the table above, your model requires more new items to meet your customers' demand.
And the impact is directly seen in CO2 emissions and water usage.
Conclusion
Results
Even in the worst-case scenario, a rental period of 28 days, we can reach a 60% of CO2 reduction and -74% of water usage.
That means the additional emissions from the logistics of returned products are not offsetting the savings from product reuse.
However, this is because your stores and logistics operations can manage this rental process for 400 items.
Additional parameters would be needed to have a complete assessment.
- Additional staff and systems to manage the return flows
- Additional packaging or handling material needed?
Impact of Demand Variability
We can see that the percentage of rental transactions involving reused items is linked to the variability of your demand.
Assuming we want to maximise this score, we should probably explore a solution that adapts the rental period to demand variability.
We can have longer rental periods for items in stable demand without impacting performance.
Next Steps
To improve our analysis, we will focus the next steps of this analysis on
- Solution Design of the Logistics Operations to Manage these Flows
- Build an Optimal Policy to Set the Rental Period = f(Demand Variability)
- Investigate the Impact on Store Operations and Estimate the Capacity of Managing a Large Portfolio of Items
About Me
Let’s connect on LinkedIn and Twitter. I am a Supply Chain engineer using data analytics to improve logistics operations and reduce costs.
If you’re looking for tailored consulting solutions to optimize your supply chain and meet sustainability goals, feel free to contact me.