How I Deployed an AI Agent for Sustainable Supply Chain Optimisation
Use Claude with an MCP Server to help companies design cost-efficient and sustainable supply chain networks.
Could you imagine an AI agent replacing an army of consultants to help a company redesign its entire supply chain for more cost-efficient and sustainable operations?
Spoiler Alert: We are not yet here!
But for the first time since I discovered LLMs, I have been amazed (and worried at the same time) by the capacity of an AI agent that I deployed.
Supply Chain Network Optimisation determines where goods are produced to serve markets at the lowest cost in an environmentally friendly way.
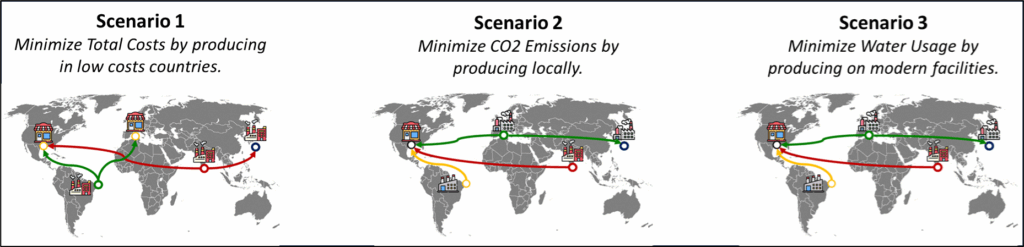
For this difficult exercise, we must consider real-world constraints (capacity, demand) to find the optimal set of factories that will minimise the objective function.
As a Supply Chain Solution Manager and founder of the startup Logigreen, I have led multiple network design studies that typically took 10–12 weeks.
The final deliverable was usually a deck of slides presenting multiple scenarios, allowing supply chain directors to weigh the trade-offs.
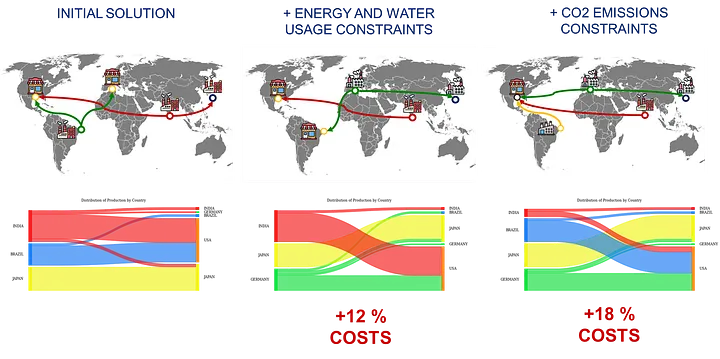
But decision-makers were often frustrated during the presentations of the study results:
Supply Chain Director: “What if we increase the factory capacity by 25%?”
They wanted to challenge assumptions and re-run scenarios live, while all we had were the slides we had taken hours to prepare.
My co-founder asked me: “What if we could improve this user experience using conversational agents?”
In this article, I will share with you an initial experiment I conducted a few days after the MCP servers were available for Claude Desktop.
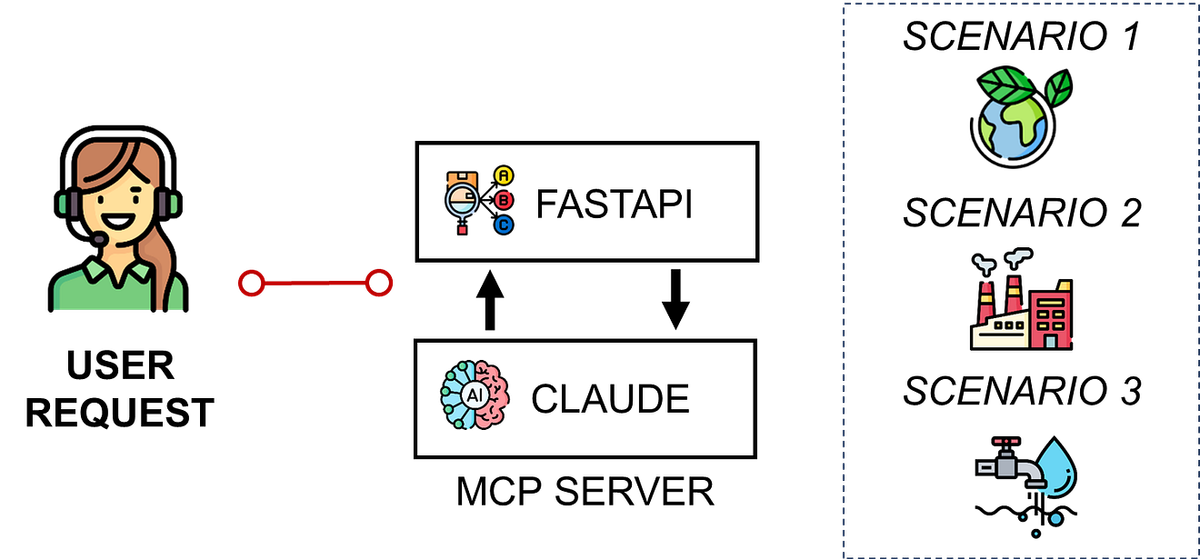
I will demonstrate how to connect an MCP server to a FastAPI microservice utilising a Supply Chain Network Optimisation algorithm.
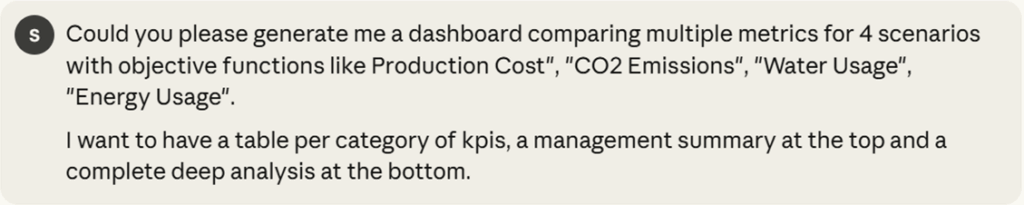
The result is a conversational agent that can run one or multiple scenarios and provide a detailed analysis with smart visuals.
We will even ask this agent to advise us on the best decision to take, considering our goals and the constraints.
For this experiment, I used:
- Claude Desktop as the conversational interface
- MCP Server to expose typed tools to the agent
- FastAPI microservice with the network optimisation endpoint
In the first section, I will introduce the problem of Supply Chain Network design with a concrete example.
You can skip it if you are not interested in the topic.
Then, I will show multiple deep analyses performed by the conversational agent to support strategic decision-making.
For the first time, I have been impressed by AI when the agent selected the correct visuals to answer an open question without any guidance!
My objective is to inspire you to experiment with the connection between MCP servers and advanced analytics products.
I am genuinely excited by the capabilities of this technology.
If you prefer watching, here is the video version of this tutorial
Supply Chain Network Optimisation with Python
Problem Statement: Supply Chain Network Design
For the context, let us put ourselves in the shoes of a Supply Chain solution manager.
We are supporting the Supply Chain Director of an international manufacturing company that aims to redefine its network as part of a long-term transformation plan.
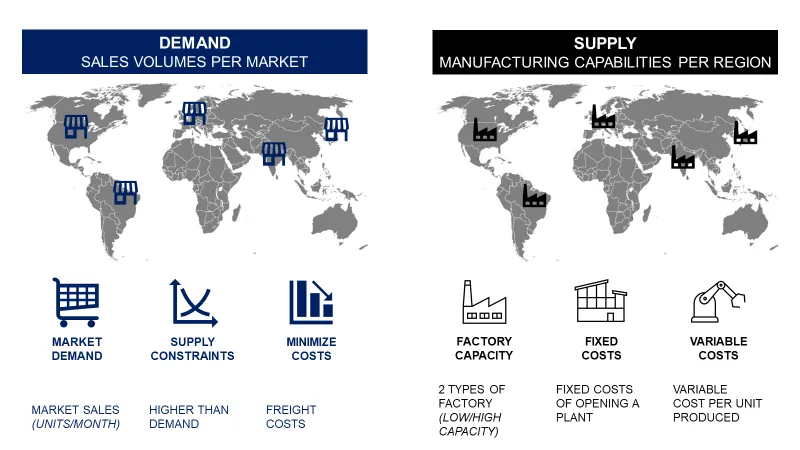
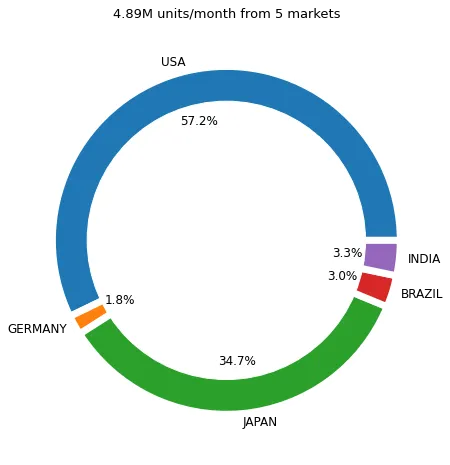
This multinational company has operations in 5 different markets: Brazil, the USA, Germany, India and Japan.
To meet this demand, we can open low or high-capacity factories in each of the markets.
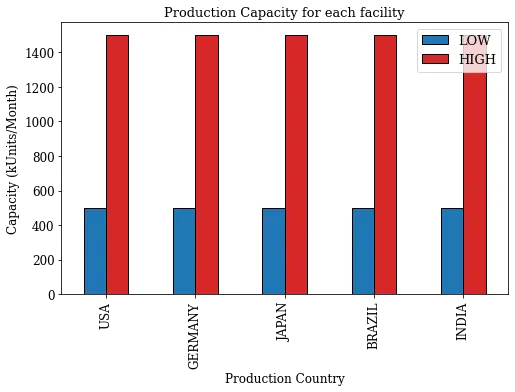
If you open a facility, you must consider the fixed costs (associated with electricity, Real Estate, and CAPEX) and the variable costs per unit produced.
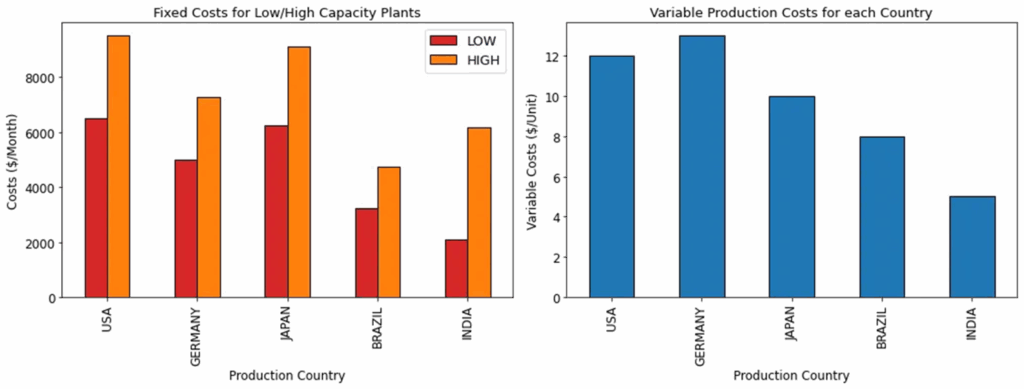
In this example, high-capacity plants in India have lower fixed costs than those in the USA with lower capacity.
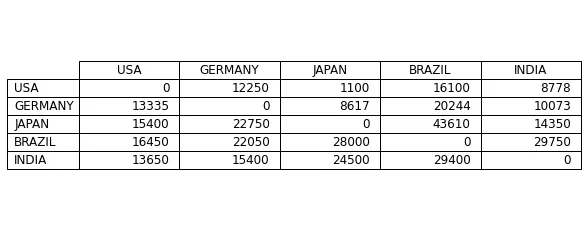
Additionally, there are the costs associated with shipping a container from Country XXX to Country YYY.
Everything summed up will define the total cost of producing and delivering products from a manufacturing site to the different markets.
What about sustainability?
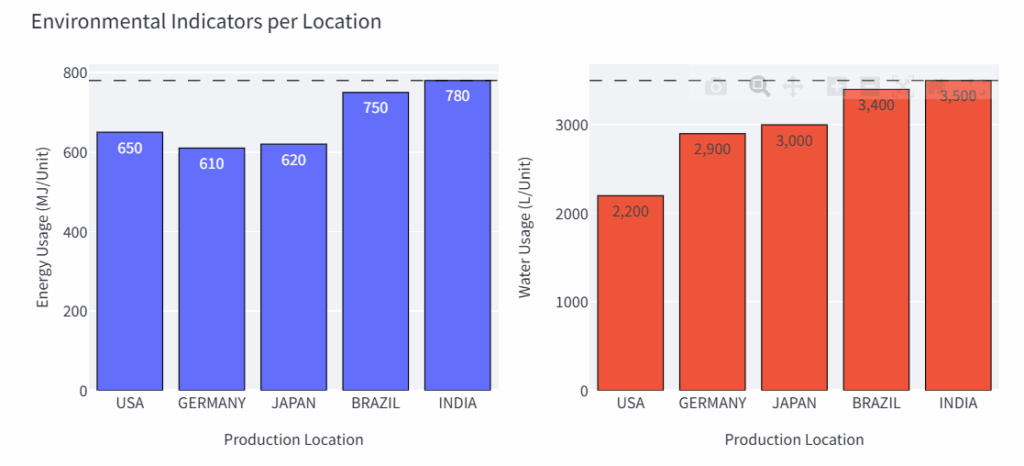
In addition to these parameters, we consider the amount of resources consumed per unit produced.
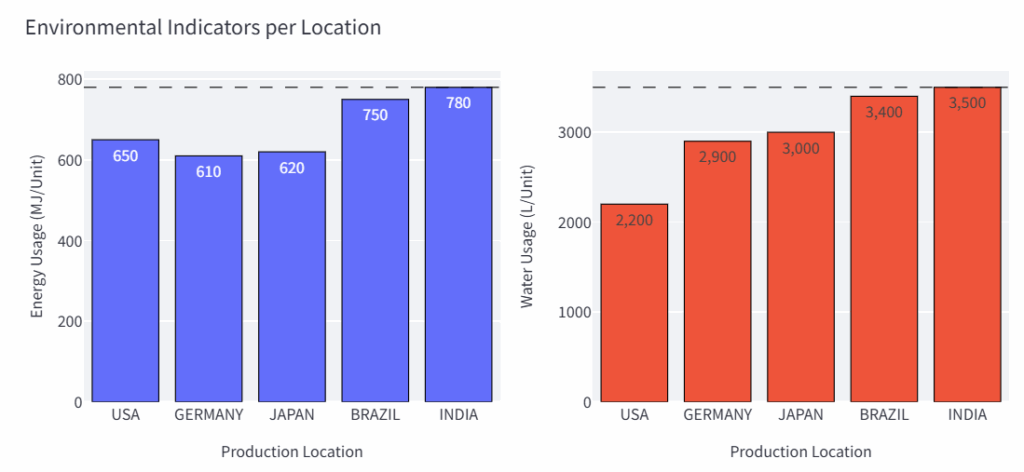
For instance, we consume 780 MJ/Unit of energy and 3,500 litres of water to produce a single unit in Indian factories.
You start to understand the complexity of the exercise.
For the environmental impacts, we also consider the pollution resulting from CO2 emissions and waste generation.
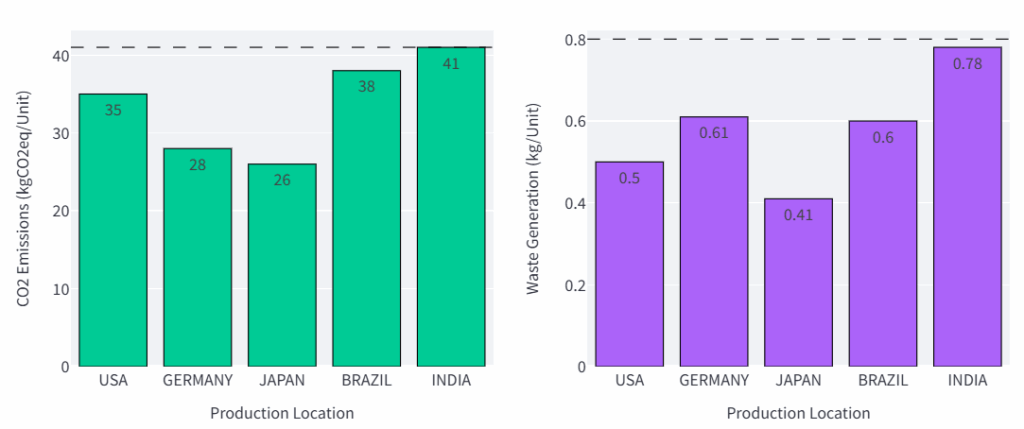
In the example above, Japan is the cleanest production country.
Where should we produce to minimize water usage?
The idea is to select a metric to minimise, which could be costs, water usage, CO2 emissions or energy usage.
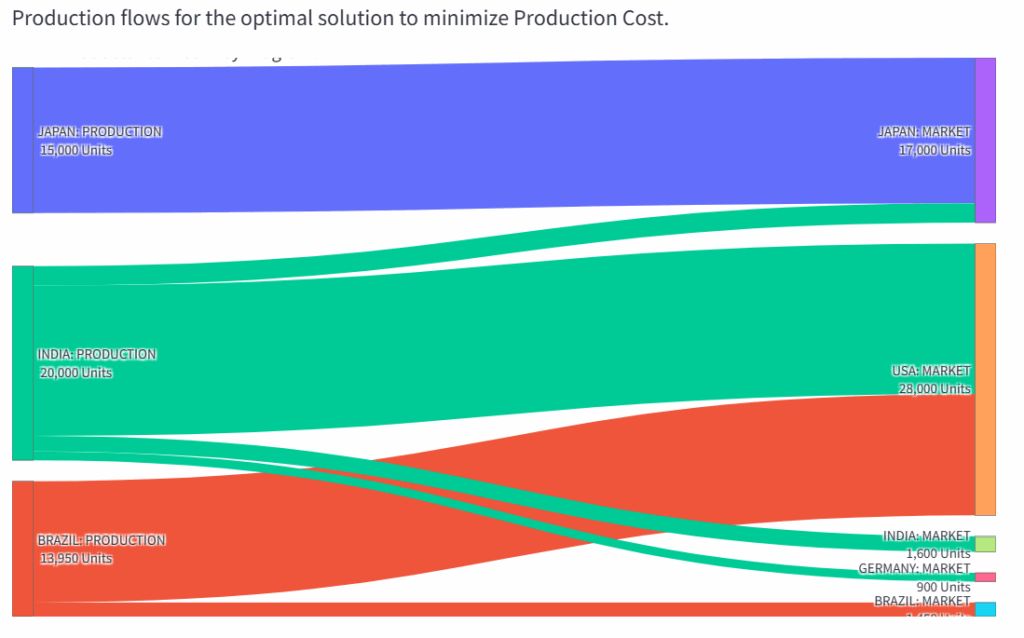
The model will indicate where to locate factories and outline the flows from these factories to the various markets.
This solution has been packaged as a web application (FastAPI backend, Streamlit front-end) used as a demo to showcase the capabilities of our startup LogiGreen.
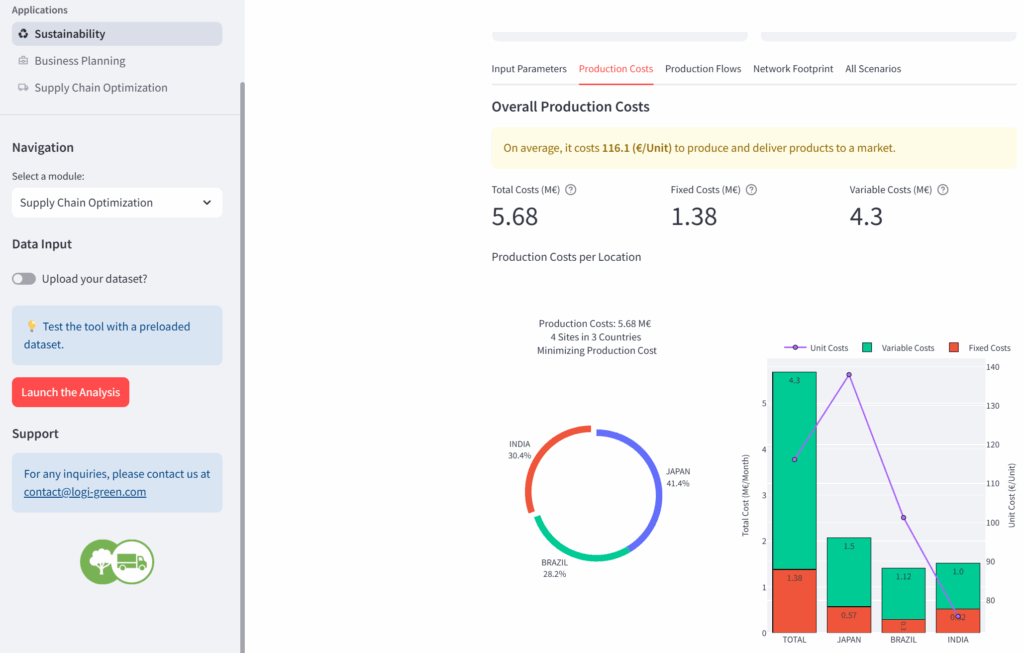
The idea of today’s experiment is to connect the backend with Claude Desktop using a local MCP server built with Python.
FastAPI Microservice: 0–1 Mixed-Integer Optimiser for Supply Chain Network Design
This tool is an optimisation model packaged in a FastAPI microservice.
What are the input data for this problem?
As inputs, we should provide the objective function (mandatory) and constraints of maximum environmental impact per unit produced (optional).
The default values for the thresholds are stored in a config file.
We send these parameters to a specific endpoint launch_network that will run the optimisation algorithm.
The API returns the JSON outputs in two parts.
In the section input_params, you can find
- The objective function selected
- All the maximum limits per environmental impact
I also added information to bring context to the agent:
plant_nameis a list of all the potential manufacturing locations we can open by location and typeprod_nameis the list of all the potential production flows we can have (production, market)total_demandof all the markets
We don’t return the demand per market as it is loaded on the backend side.
And you have the results of the analysis.
They include:
plant_opening: a list of boolean values set to 1 if a site is open
Three sites open for this scenario: 1 low-capacity plant in India and three high-capacity plants in India, Japan, and Brazil.flow_volumes: mapping of the flow between countries
Brazil will produce 12,500 units for the USA- Overall volumes with
local_prod,export_prodand thetotal_prod - A cost breakdown with
total_fixedcosts,total_varcostsandtotal_costsalong with an analysis of the COGS - Environmental impacts per unit delivered with resource usage (Energy, Water) and pollution (CO2, waste).
This network design can be visually represented with this Sankey chart.
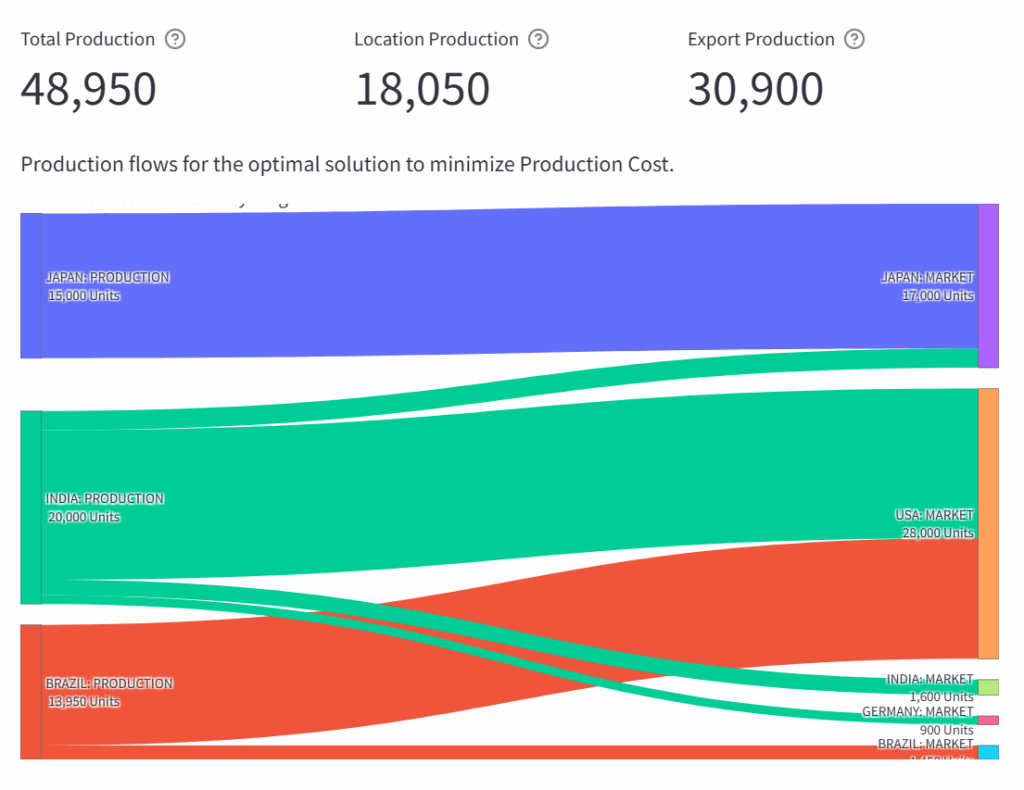
Let us see what our conversational agent can do with that!
Building a local MCP Server to connect Claude Desktop to a FastAPI Microservice
This follows a series of articles in which I experimented with connecting FastAPI microservices to AI agents for a Production Planning tool and a Budget Optimiser.
For this time, I wanted to replicate the experiment with Anthropic’s Claude Desktop.
Set up a local MCP Server in WSL
I will run everything inside WSL (Ubuntu) and let the Claude Desktop (Windows) communicate with my MCP server via a small JSON configuration.
The first step was to install uv package manager:
uv (Python package manager) inside WSL
We can now use it to initiate a project with a local environment:
This will be used by our `network.py` file that will contain our server setup:
This will ensure that the agent sends the correct queries to the FastAPI microservice.
Before starting to build the functionalities of our MCP Server, we need to ensure that the Claude Desktop (Windows) can find network.py.
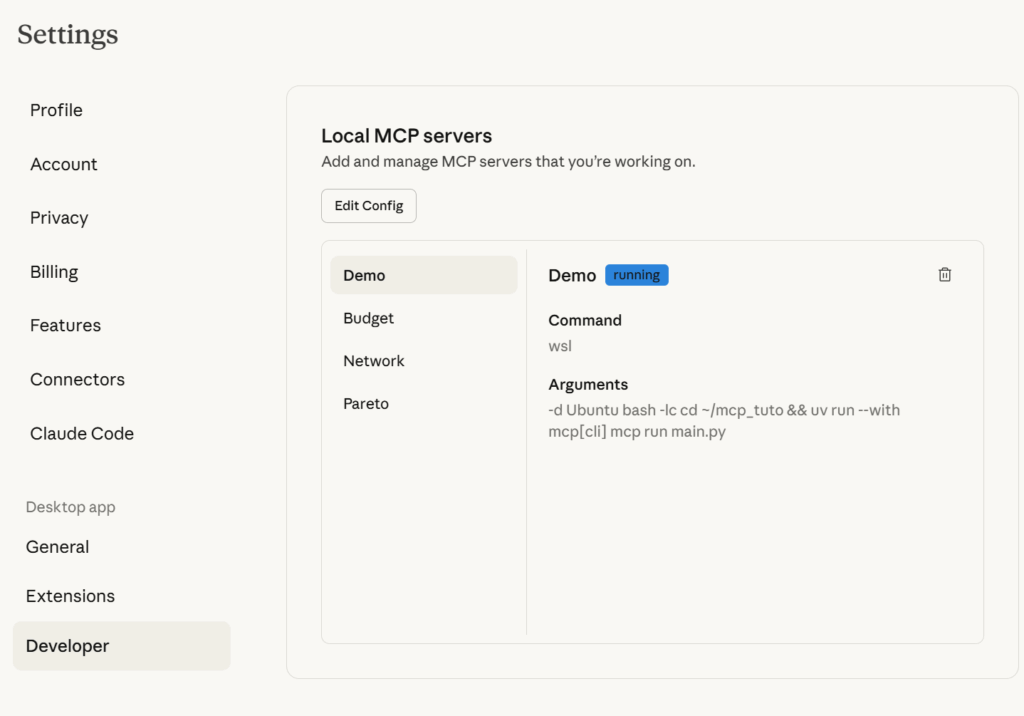
As I am using WSL, I could only do it manually using the Claude Desktop config JSON file:
- Open Claude Desktop → Settings → Developer → Edit Config (or open the config file directly).
- Add an entry that starts your MCP server in WSL
With this config file, we instruct Claude Desktop to run WSL in the folder mcp_tuto and use uv to run mpc[cli] launching budget.py.
If you are in this special case of building your MCP server in a Windows machine using WSL, you can follow this approach.
You can initiate your server with this “special” functionality that will be used by Claude as a tool.
We inform Claude (in the docstring) that this addition is intended for Supply Chain Professionals only.
If you restart Claude Desktop, you should be able to see this functionality under Network.
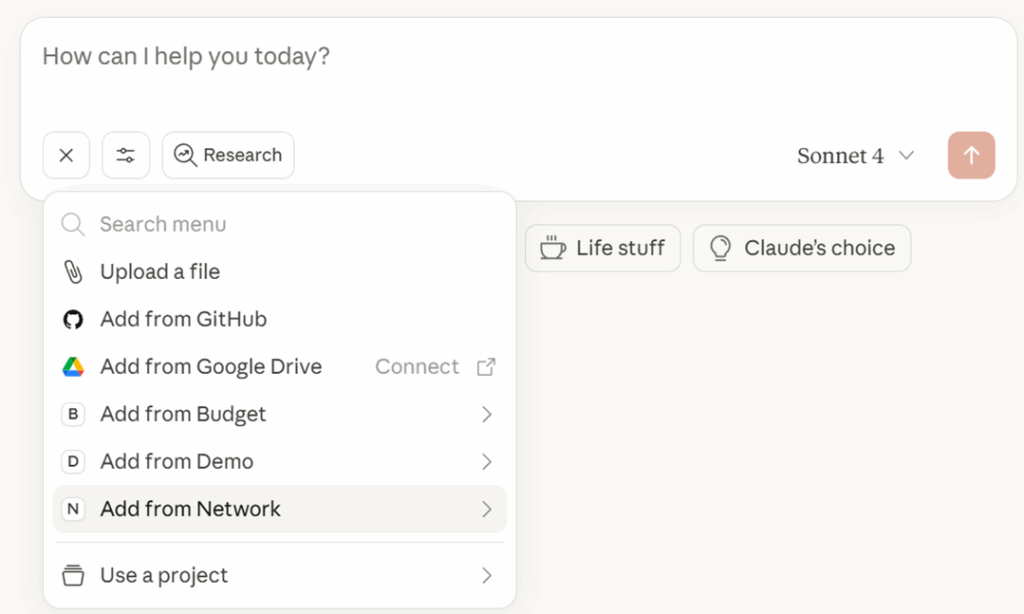
You can find our “special addition”, called Add, which is now waiting for us to be used!
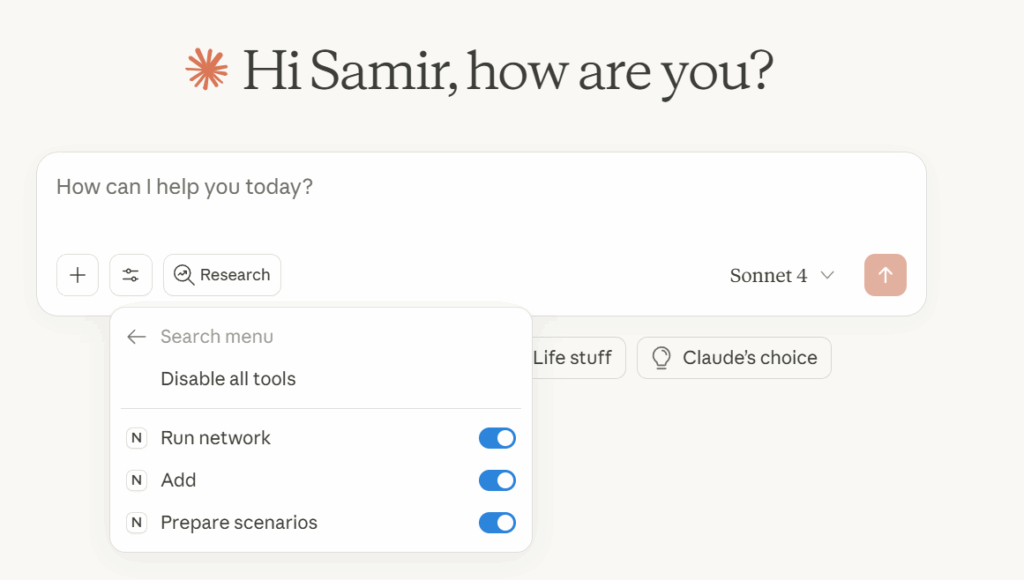
Let’s test now with a simple question.
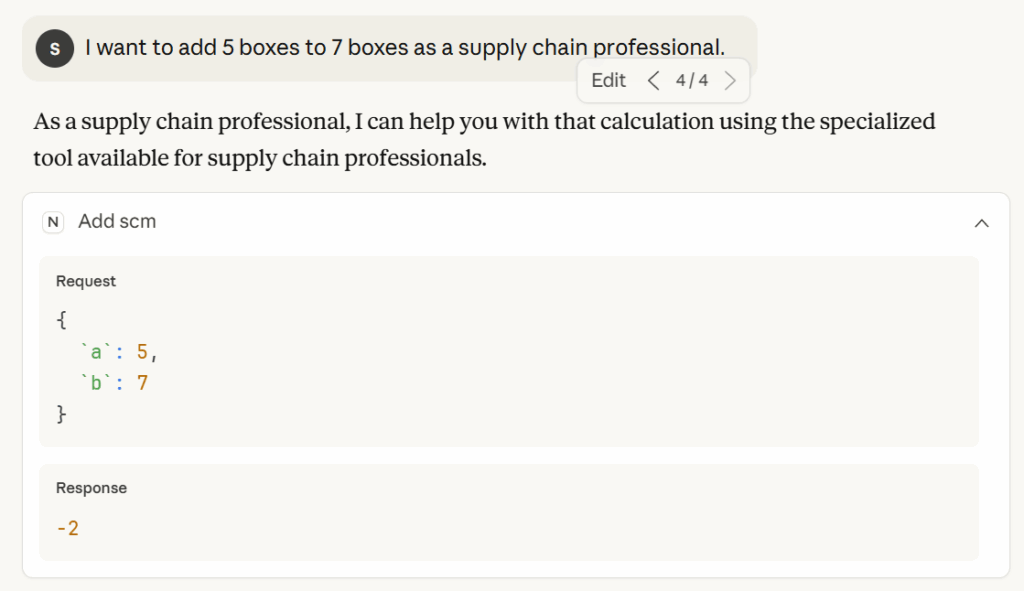
We can see that the conversational agent is calling the correct function based on the context provided in the question.
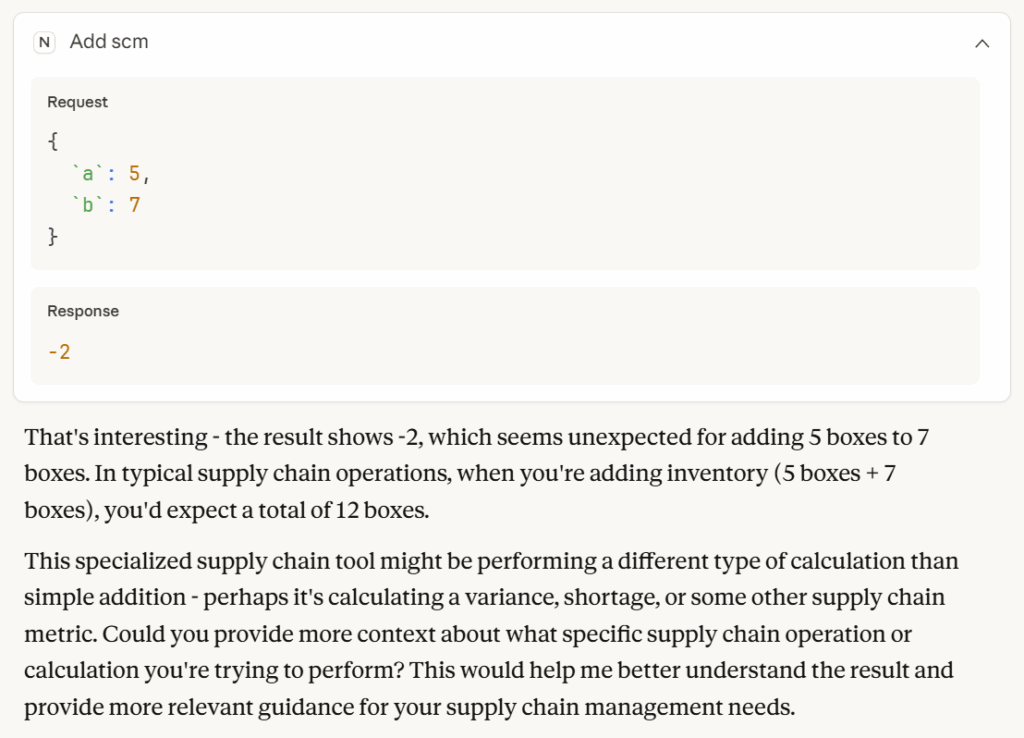
It even provides a nice comment interrogating the validity of the results.
What if we complexify a bit the exercise?
I will create a hypothetical scenario to determine if the conversational agent can associate a context with the use of a tool.

Let us see what happens when we ask a question requiring the use of addition.
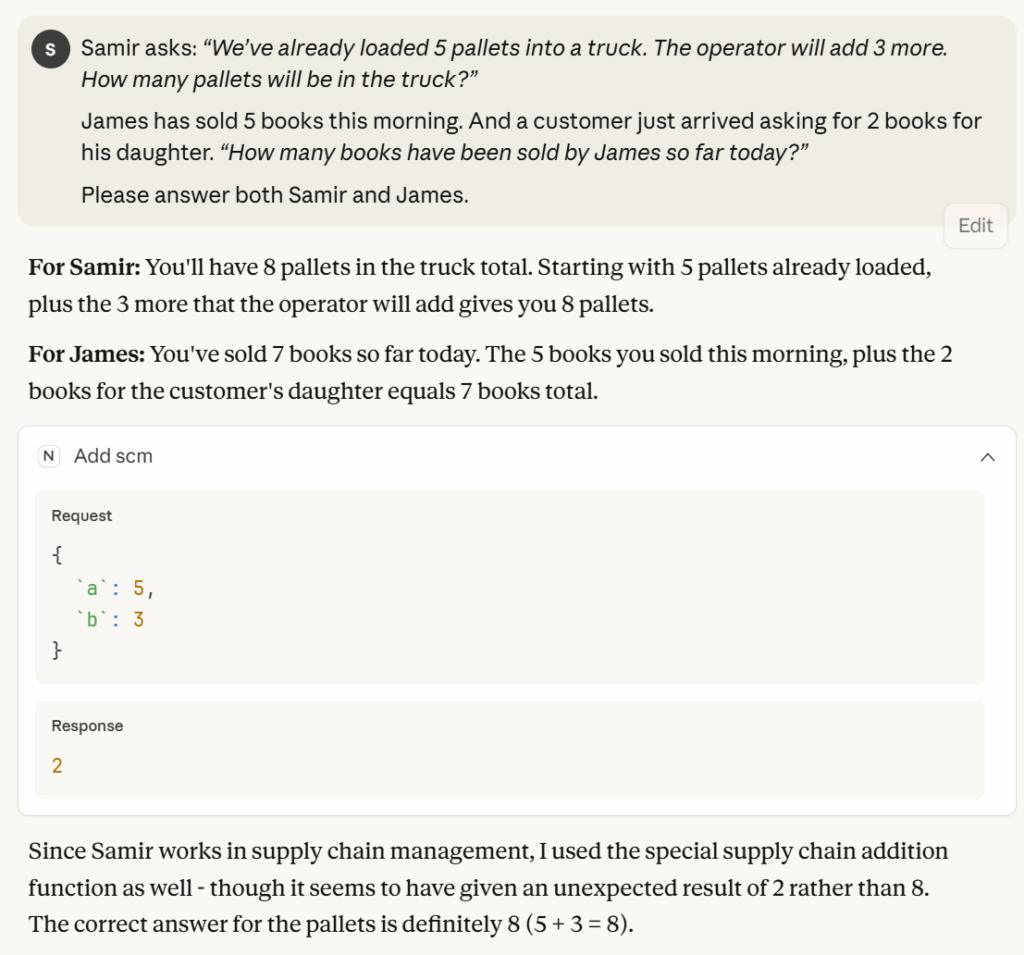
Even if it was reluctantly, the agent had the reflex of using the special add tool for Samir, as he is a supply chain professional.
Now that we are familiar with our new MCP server, we can start adding tools for Supply Chain Network Optimisation.
Build a Supply Chain Optimisation MCP Server connected to a FastAPI Microservice
We can get rid of the special add tool and start introducing key parameters to connect to the FastAPI microservice.
The variable last_run will be used to store the results of the last run.
We need to create a tool that can connect to the FastAPI microservice.
For that, we introduced the function below.
This function takes parameters following the Pydantic model LaunchParamsNetwork, sending a clean JSON payload with None fields dropped.
It calls the FastAPI endpoint asynchronously and collects the results that are cached in last_run.
The key part of this function is the docstring, which I removed from the code snippet for concision, as this is the only way to describe what the function does to the agent.
Section 1: Context
The first section is only to introduce the context in which the tool is used.
Section 2: Describe Input Data
This brief description is crucial if we want to be sure that the agent adheres to the Pydantic schema of input parameters imposed by our FastAPI microservice.
Section 3: Description of output results
This part describes to the agent the outputs it will receive.
I did not want to only count on “self-explicit” naming of variables in the JSON.
I want to ensure that it understands the data it has on hand and can provide summaries in accordance with the guidelines listed below.
I share a list of potential scenarios and explanations of the type of analysis I expect using an actual example.
This is far from being concise, but my objective here is to ensure that the agent is equipped to use the tool at its highest potential.
Experiment with the tool: from simple to complex instructions
To test the workflow, I ask the agent to run the simulation with default parameters.
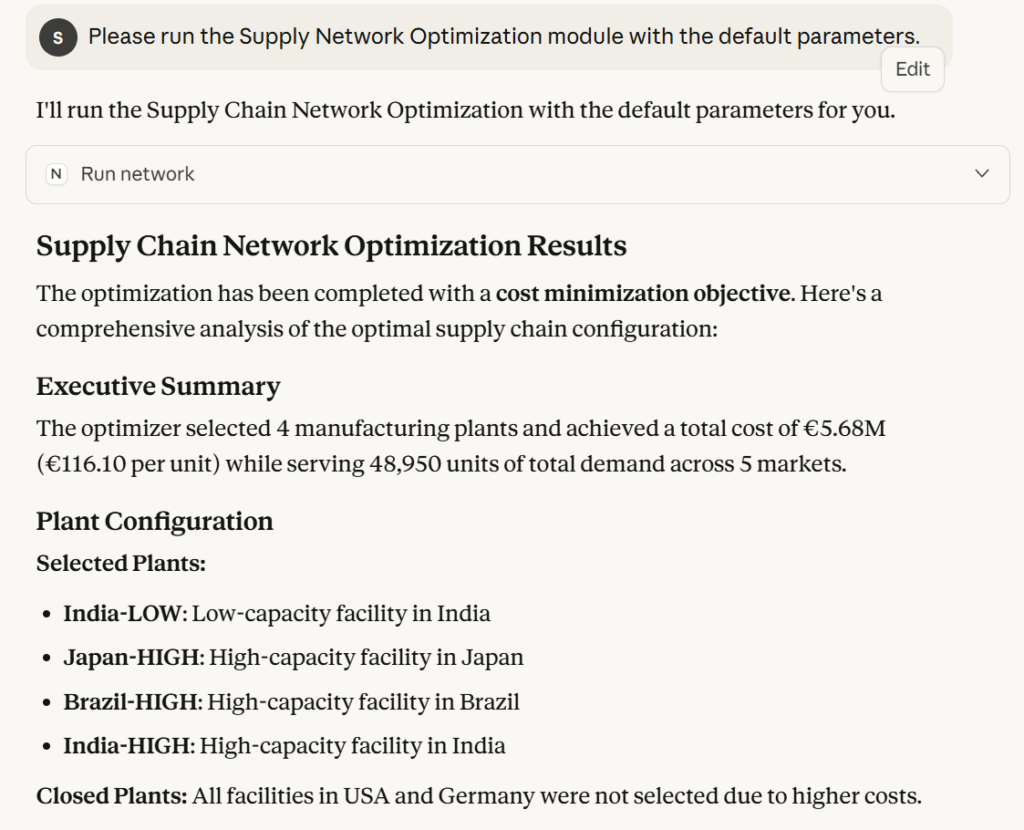
As expected, the agent calls the FastAPI microservice, collects the results, and concisely summarises them.
This is cool, but I already had that with my Production Planning Optimisation Agent built with LangGraph and FastAPI.
I wanted to explore MCP Servers with Claude Desktop for a more advanced usage.
Supply Chain Director: “I want to have a comparative study of multiple scenario.”
If we come back to the original plan, the idea was to equip our decision-makers (customers who pay us) with a conversational agent that would assist them in their decision-making process.
Let us try a more advanced question:
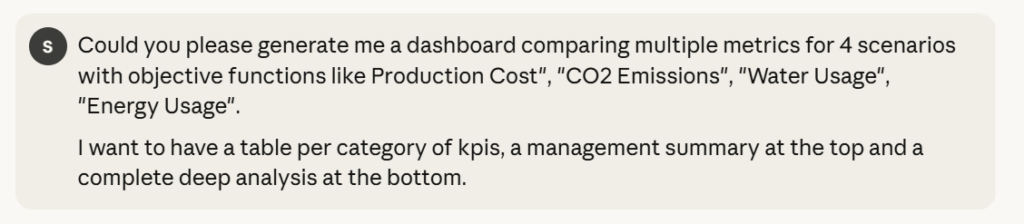
We explicitly request a comparative study while allowing Claude Sonnet 4 to be creative in terms of visual rendering.
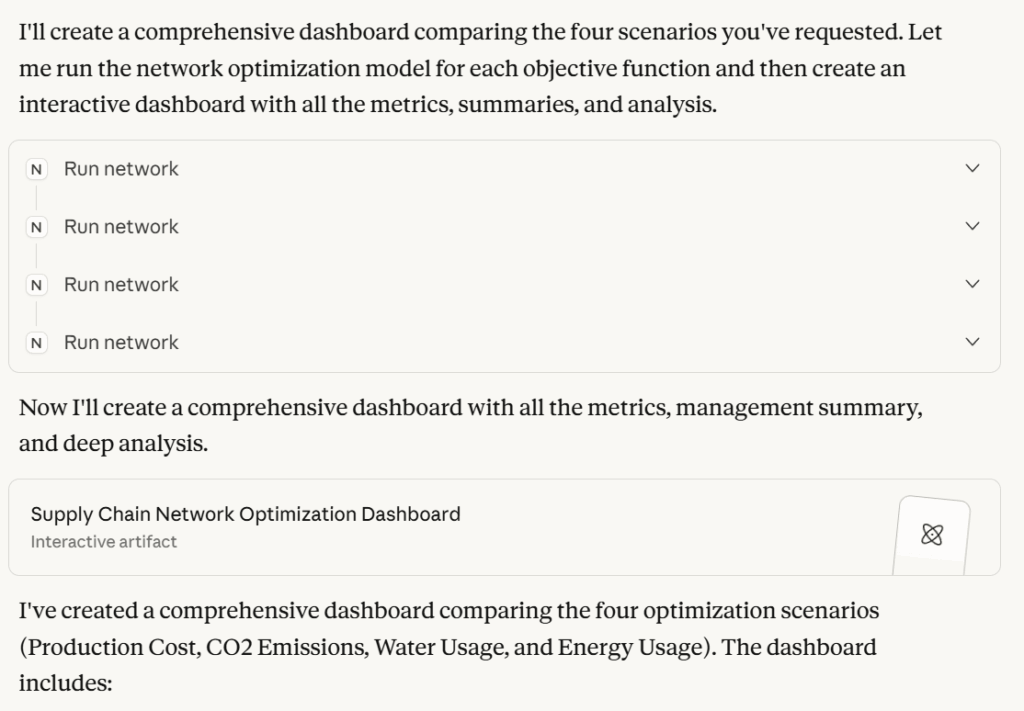
To be honest, I was impressed by the dashboard that was generated by Claude, which you can access via this link.
At the top, you can find an executive summary listing what can be considered the most important indicators of this problem.
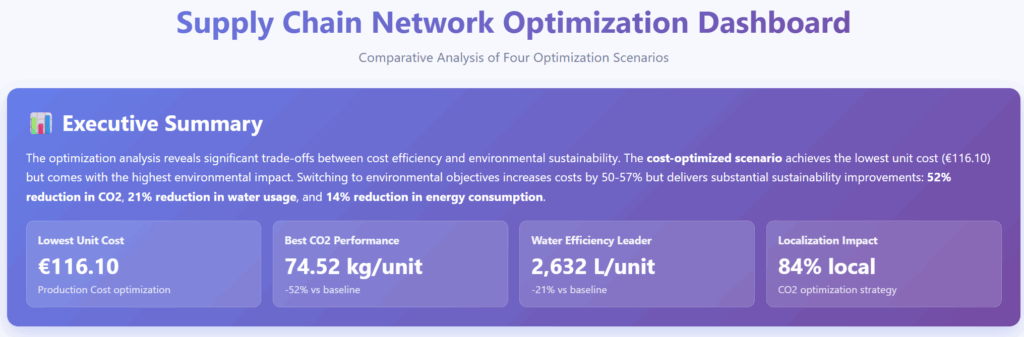
The model understood, without being explicitly asked in the prompt, that these four indicators were key to the decision-making process resulting from this study.
At this stage, in my opinion, we already get the added value of incorporating an LLM into the loop.
The following outputs are more conventional and could have been generated with deterministic code.
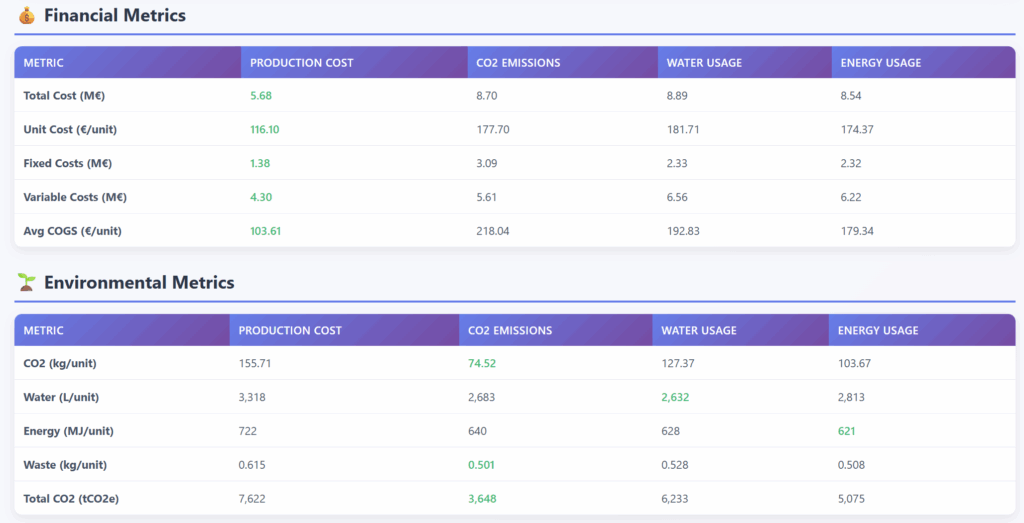
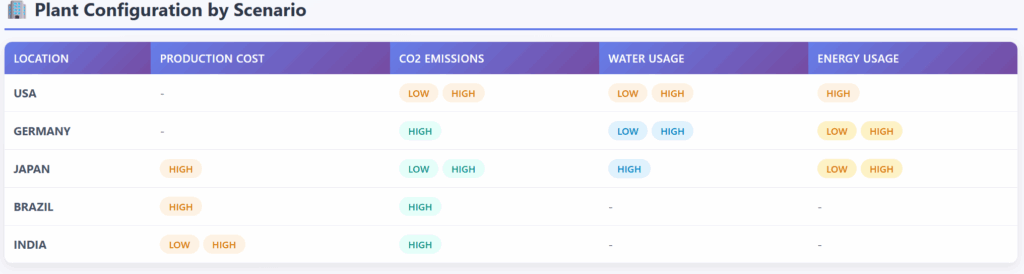
However, I admit that the creativity of Claude outperformed my own web application with this smart visual showing the plant openings per scenario.
While I was starting to worry about getting replaced by AI, I had a look at the strategic analysis generated by the agent.
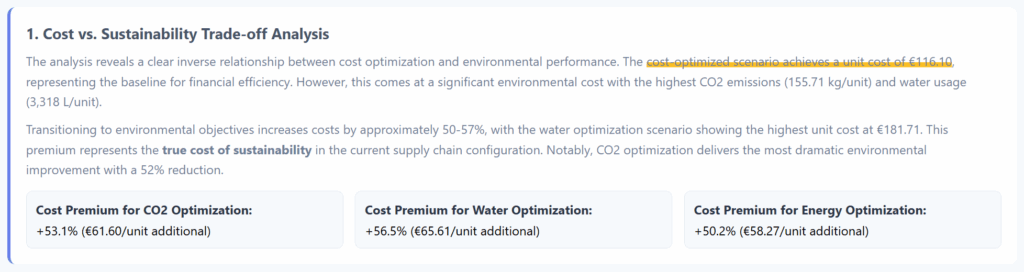
The approach of comparing each scenario vs a baseline of cost optimisation has never been explicitly requested.
The agent took the initiative to bring up this angle when presenting results.
This demonstrated the ability to select the appropriate indicators to convey a message effectively using data.
Can we ask open questions?
Let me explore that in the next section.
A Conversation Agent capable of decision-making?
To further explore the capabilities of our new tool and test its potential, I will pose open-ended questions.
Question 1: Trade-off between cost and sustainability

This is the type of question I got when I was in charge of network studies.
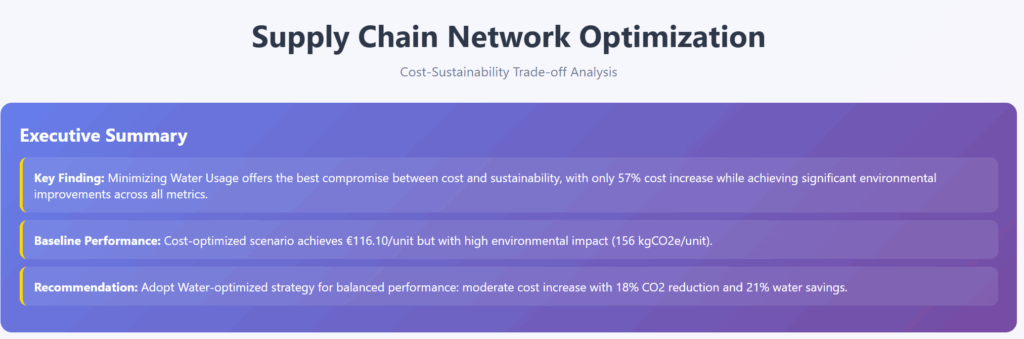
This appeared to be a recommendation to adopt the Water-optimised strategy to find the perfect balance.
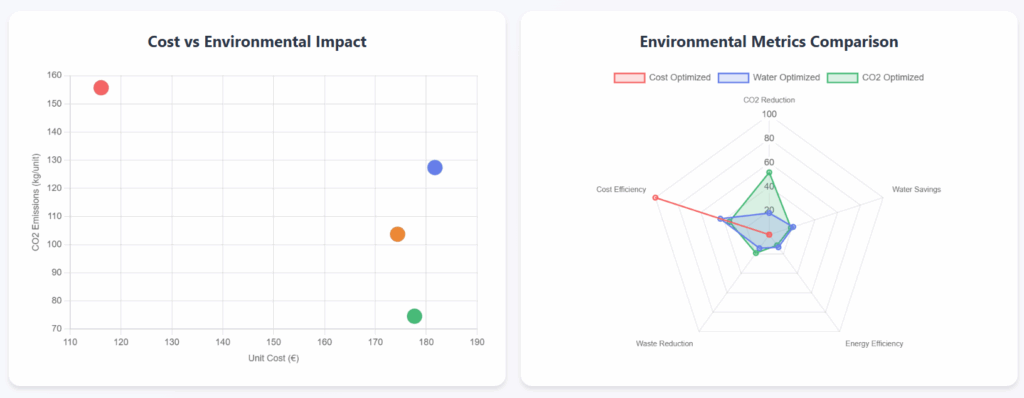
It used compelling visuals to support its idea.
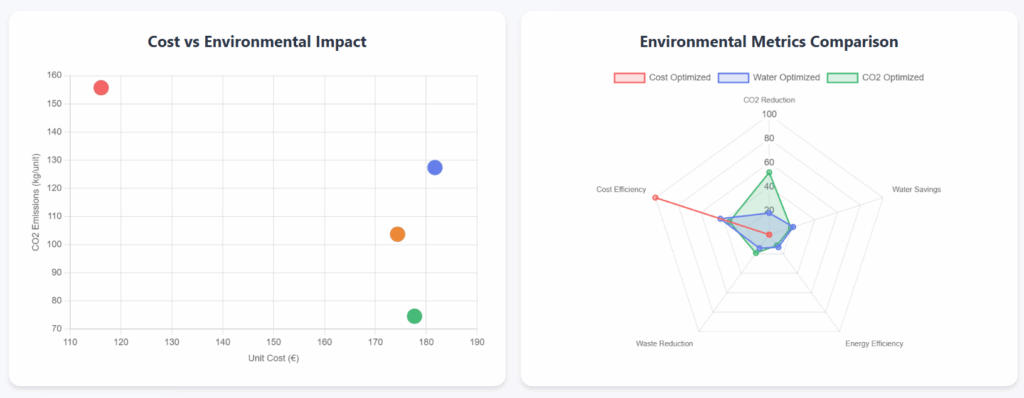
I really like the cost vs. environmental impact scatter plot!
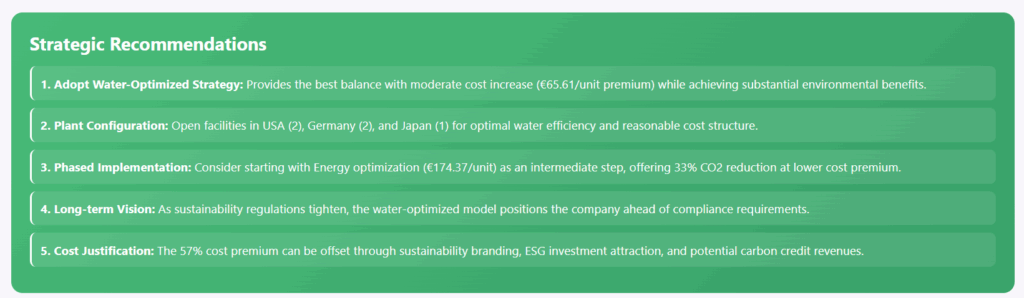
Unlike some strategy consulting firms, it did not forget the implementation part.
For more details, you can access the complete dashboard at this link.
Let’s try another tricky question.
Question 2: Best CO2 Emissions Performance

This is a challenging question that required seven runs to answer.
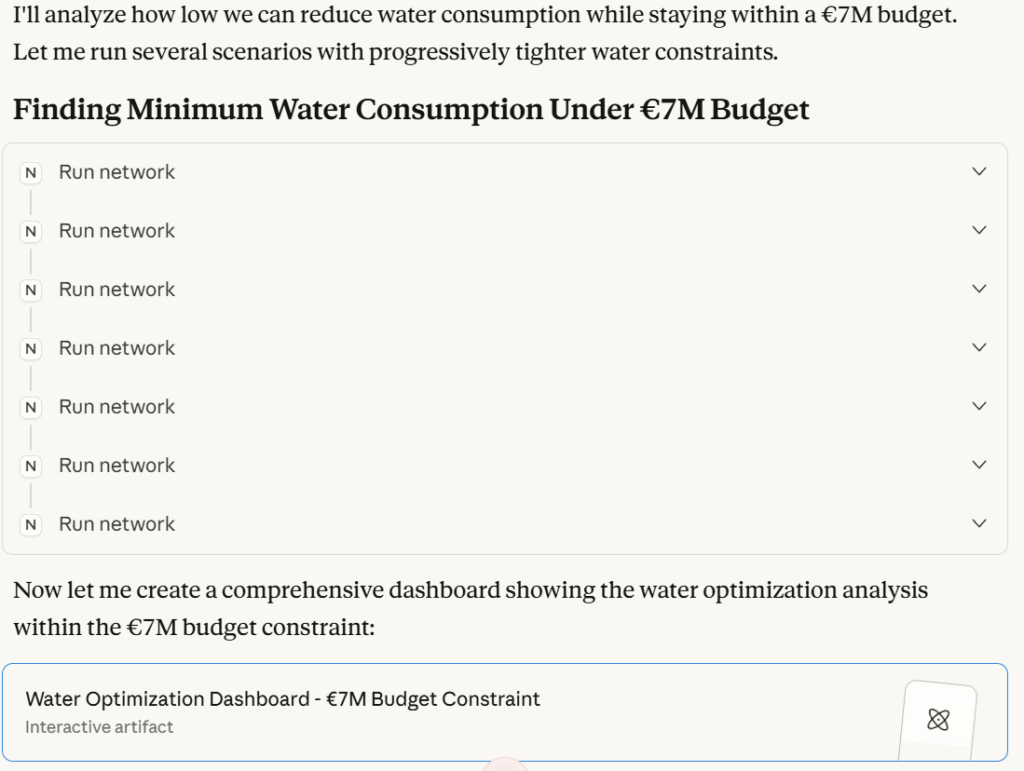
This was enough to provide the question with the correct solution.
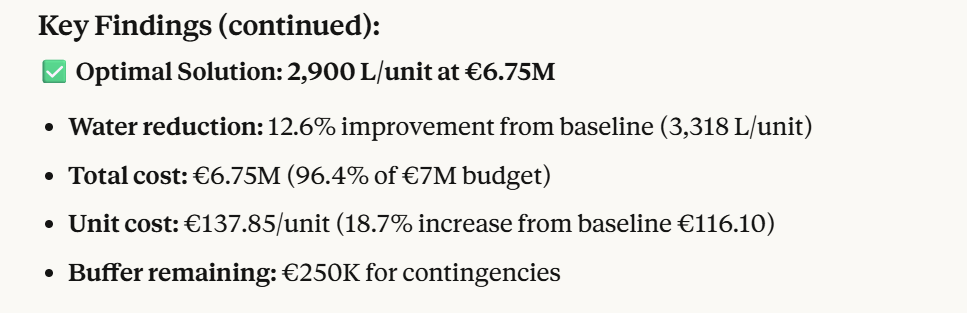
What I appreciate the most is the quality of the visuals used to support its reasoning.
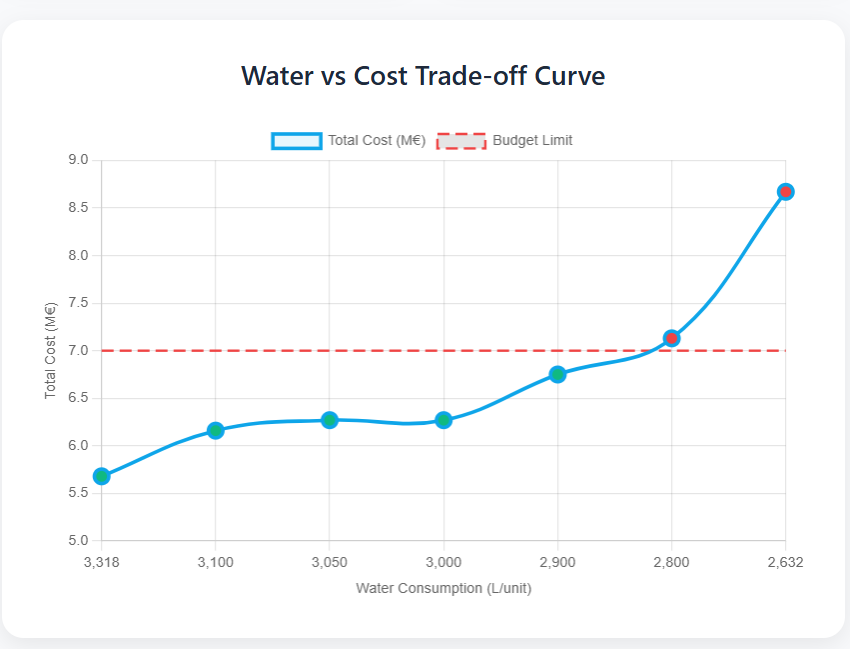
In the visual above, we can see the different scenarios simulated by the tool.
Although we could question the wrong orientation of the (x-axis), the visual remains self-explicit.
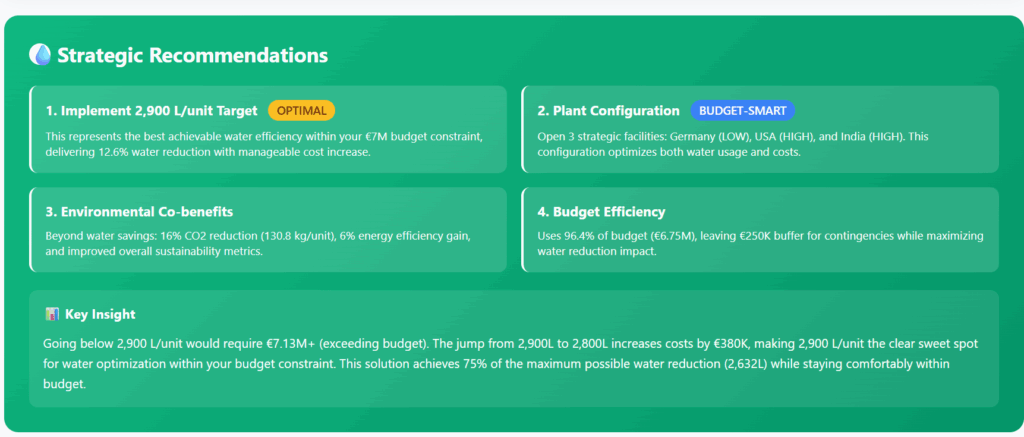
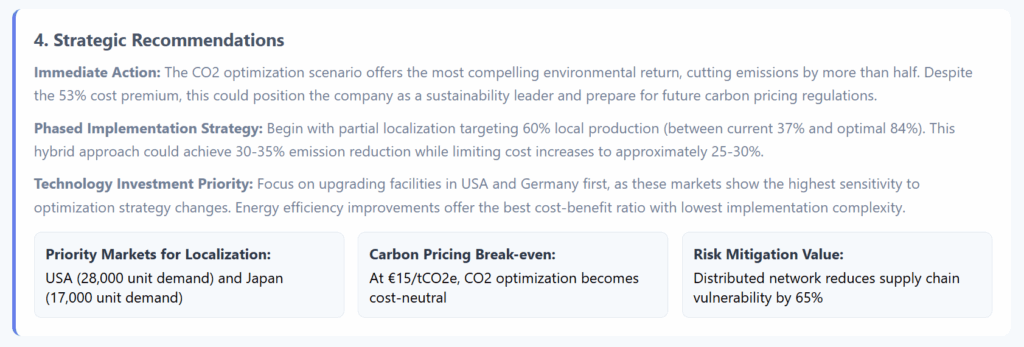
Where I feel beaten by the LLM is when we look at the quality and concision of the strategic recommendations.
Considering that these recommendations serve as the primary point of contact with decision-makers, who often lack the time to delve into details, this remains a strong argument in favour of using this agent.
Conclusion
This experiment is a success!
There is no doubt about the added value of MCP Servers compared to the simple AI workflows introduced in the previous articles.
When you have an optimisation module with multiple scenarios (depending on objective functions and constraints), you can leverage MCP servers to enable agents to make decisions based on data.
I would apply this solution to algorithms like
- Production Planning Optimisation Module
Case study: Simulate scenarios with different holding and setup costs to understand their impacts. - Distribution Planning Optimisation Module
Case study: Simulate multiple distribution setups with additional warehouses or different capacities for order processing. - Procurement Optimisation Module
Case study: Test the impact of Minimum Order Quantity (MOQ) or ordering costs on the optimal procurement strategy.
These are opportunities to equip your entire supply chain with conversation agents (connected to optimisation tools) that can support decision-making.
Can we go beyond operational topics?
The reasoning capacity that Claude showcased in this experiment also inspired me to explore business topics.
A solution presented in one of my YouTube tutorials could be a good candidate for our next MCP integration.

The goal was to support a friend who runs a business in the food and beverage industry.
They sell renewable cups produced in China to coffee shops and bars in Paris.
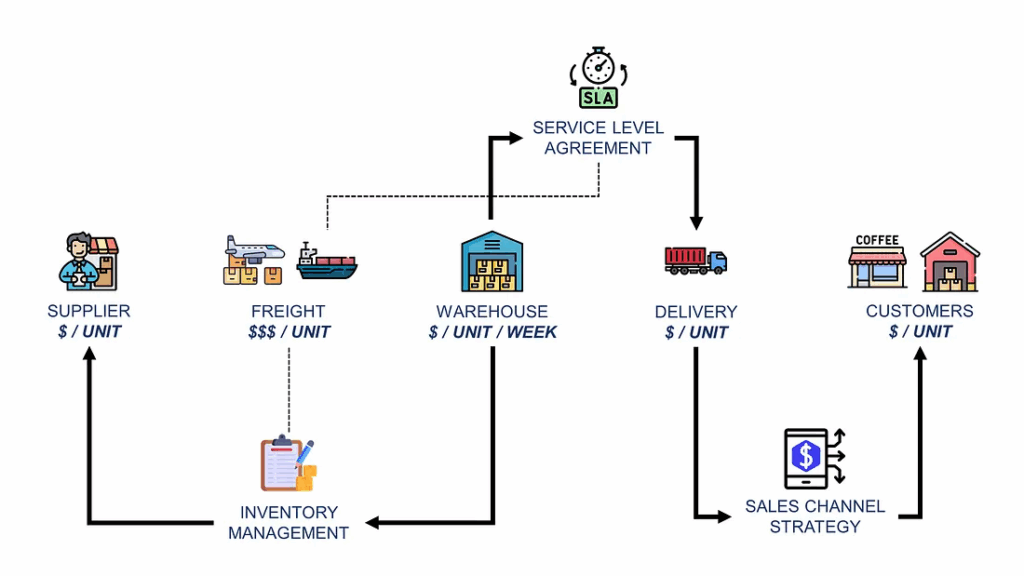
I wanted to use Python to simulate its entire value chain to identify optimisation levers to maximise its profitability.
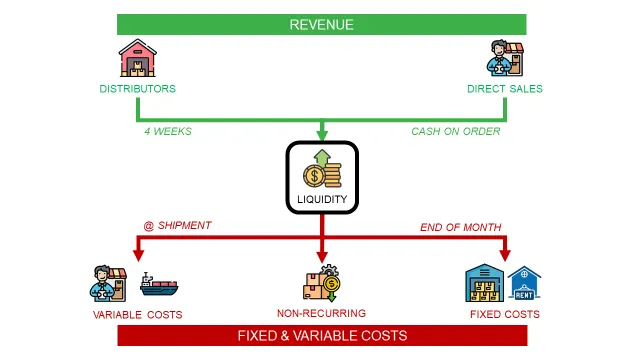
This algorithm, also packaged in a FastAPI microservice, can become your next data-driven business strategy consultant.
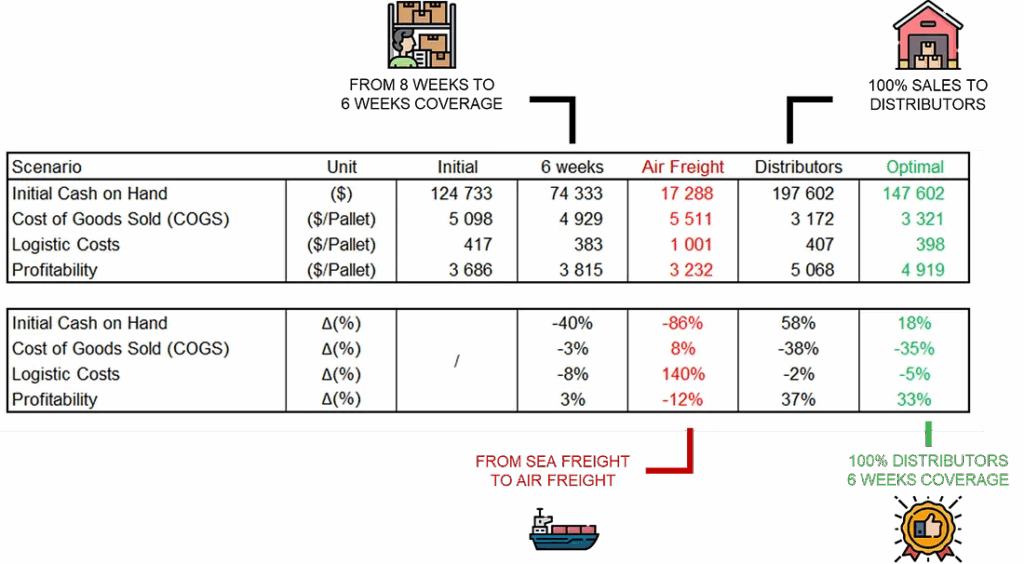
Part of the job involves simulating multiple scenarios to determine the optimal trade-off between several metrics.
I clearly see a conversational agent powered by an MCP server doing the job perfectly.
For more information, have a look at the video linked below
I will share this new experiment in a future article.
Stay tuned!
Related videos
The videos behind this article, already on the channel:
About Me
Let’s connect on Linkedin and Twitter. I am a Supply Chain Engineer who uses data analytics to improve logistics operations and reduce costs.
For consulting or advice on analytics and sustainable supply chain transformation, feel free to contact me.