What is Business Intelligence?
Discover the tools for data-driven decision-making applied to supply chain optimization.
Business Intelligence is a process that leverages software and services to transform data into actionable intelligence supporting decision-making.
This intelligence helps businesses gain insights into their operations, improve process efficiency, and create a competitive market advantage.
These tools combine a wide range of applications including data warehousing, data discovery, and visualization.
Our goal is to simplify the procedure of analyzing raw data by transforming it into summarized insights used for strategic decision-making.
In this article, we will explore Business Intelligence and how it can support continuous operational improvement initiatives to build a more efficient and sustainable supply chain.
💌 New articles straight to your inbox for free: Newsletter
I. What is Business intelligence?
1. Distribution Operations for Fashion Retail
2. Business Intelligence for Operational Management
3. Business Intelligence is not Advanced Analytics
4. Supporting Operational Performance Improvement
II. The Mechanics of Business Intelligence
1. What is a Data Warehouse?
2. A central source of harmonized data for reporting
III. Why is Business Intelligence Significant?
1. Answering a simple business question
2. Become a data-driven green organization
IV. Conclusion
What is Business Intelligence?
This can be defined as a range of software applications used to analyze an organization’s raw data.
Distribution Operations for Fashion Retail
We can use the example of an international clothing group with stores worldwide.
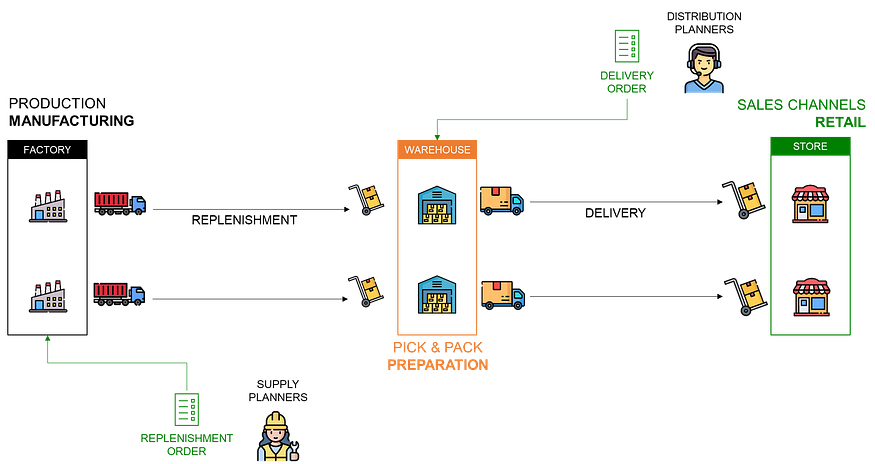
The stores are delivered from local warehouses that are replenished by factories producing garments in Asia.
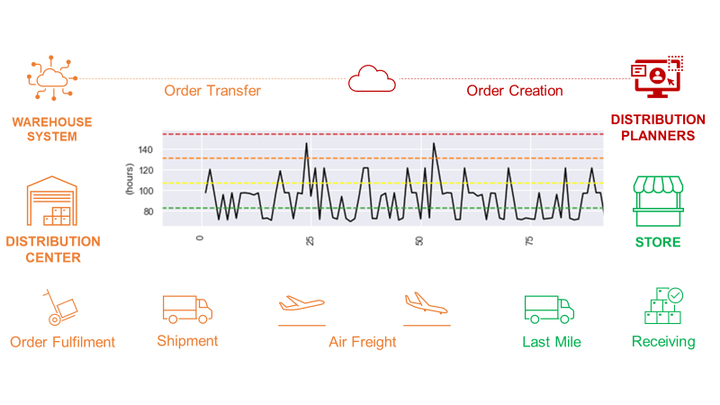
As a distribution planning manager, you would like to measure the lead time to deliver to a store (the time between order creation and store delivery).
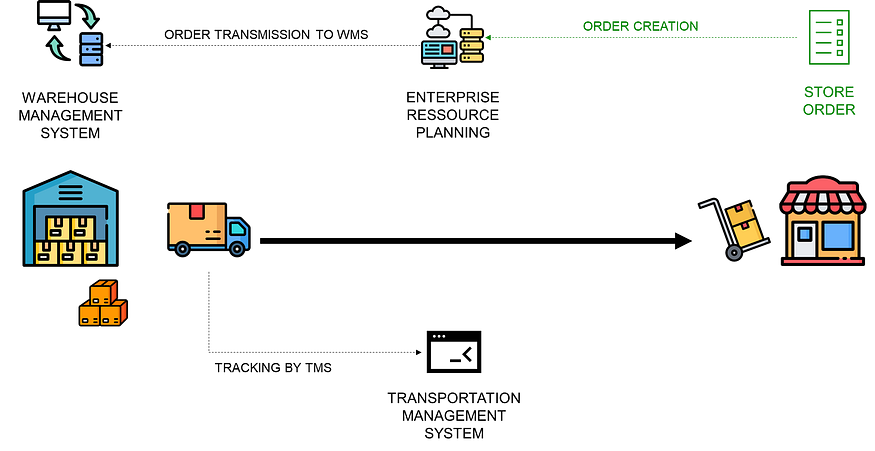
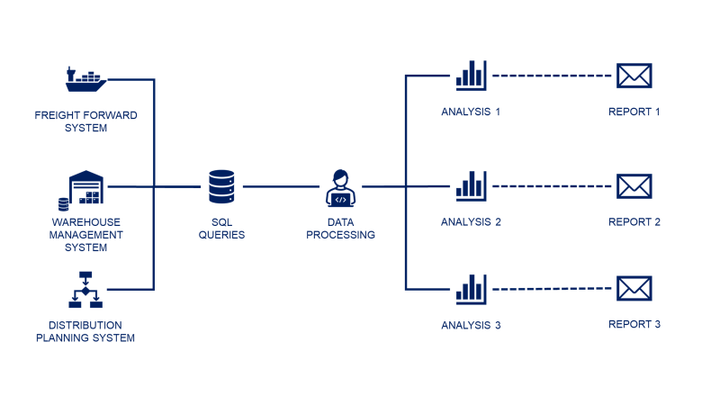
Multiple IT systems orchestrate the complete distribution process
- A delivery order is created in the ERP by a distribution planner.
- Planners enter a list of items with quantities, store codes and requested delivery dates
- This order is transmitted to the Warehouse Management System (WMS) for preparation, packing and loading.
- After loading, the order is tracked by the Transportation Management System (TMS) until store delivery.
Transactional data with timestamps is created and stored in the databases of these systems.
- After the order creation in the ERP, a second timestamp is recording the time when the order is transmitted to the WMS
- The order is then tracked by the WMS from preparation to loading
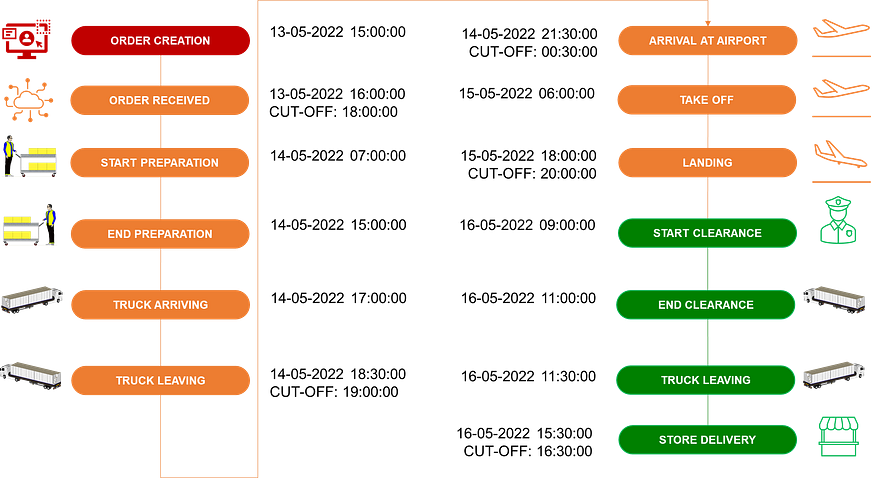
[From Start Preparation To Truck Leaving] - And the transportation part is managed by the TMS, with time stamps following the shipments until store delivery
[From Arrival to Airport to Store Delivery]
How can we exploit this data to analyze past events?
Business Intelligence for Operational Management
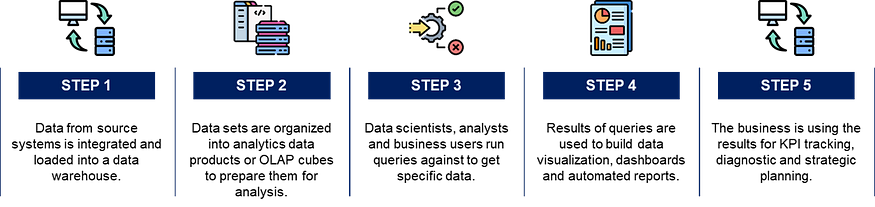
BI can help convert this data into meaningful information to support descriptive and diagnostic analytics for operational or strategic decision-making.
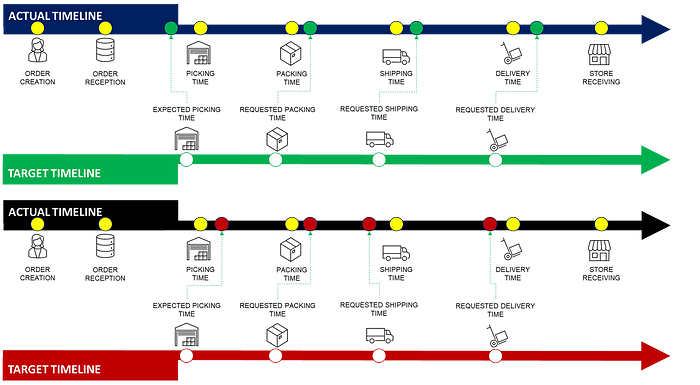
For each timestamp, BI solutions can automatically compare the expected time with the actual one to detect where delays occur.
The objective is to provide reports, dashboards, and data visualisations that automatically generate insights for operational teams.
Let us take an example of the tracking of a delivery order
- Order Creation Time: 21–04–2020 11:00
- Order Reception Expected Time: 21–04–2020 12:30
Order Reception Actual Timestamp: 21–04–2020 12:04 [On Time] - Order Picking Expected Time: 21–04–2020 14:30
Order Picking Expected Time: 21–04–2020 15:12 [Delayed]
And you can continue this until the store delivery.
Based on these timestamps, you can create automated rules:
- If the actual delivery date is after the expected date: Late Delivery
- For each process, if the actual date is after the expected date, you can add it to the list of reason codes
For instance: Late Delivery due to [Transmission, Loading, Customs Clearance]
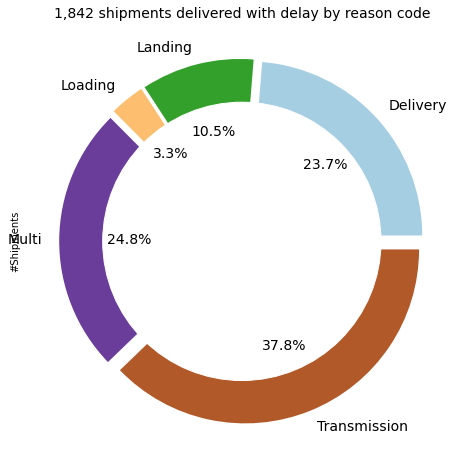
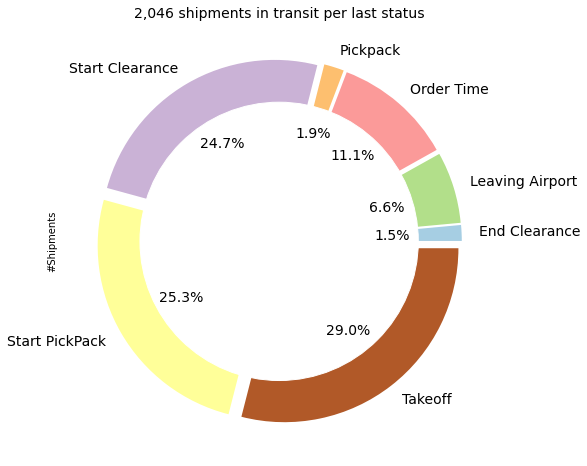
This donut plot is an example of a visual showing the different root causes of late store deliveries
- 1,842 shipment orders have been delivered late
- 37% of the delays are due to order transmission issues only
For more details, you can have a look at these short explainer videos
3. Business Intelligence is not Advanced Analytics
The purpose of Business Intelligence is not to advise the operations about the best mitigation plan or to predict future performance.
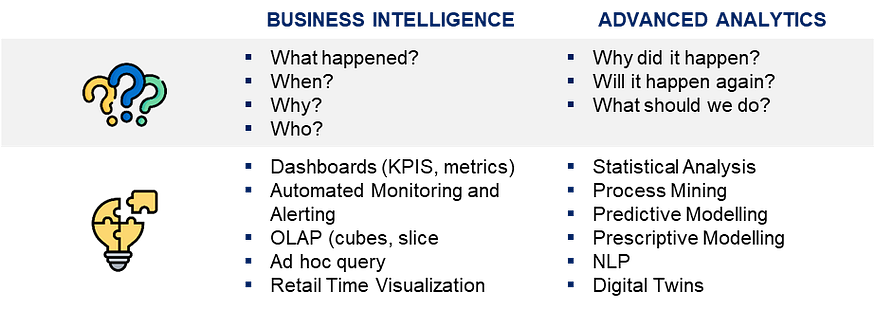
Business Intelligence provides Descriptive and Diagnostic Analytics solutions, focusing on understanding past events.
- What happened?: How many orders have been delivered with delay?
- When?: When will the order 1878497 be loaded at the warehouse?
- Who?: Which carrier delivered store 12 last week?
- Why?: Why did the order 1878497 arrive at the airport 1 hour late?
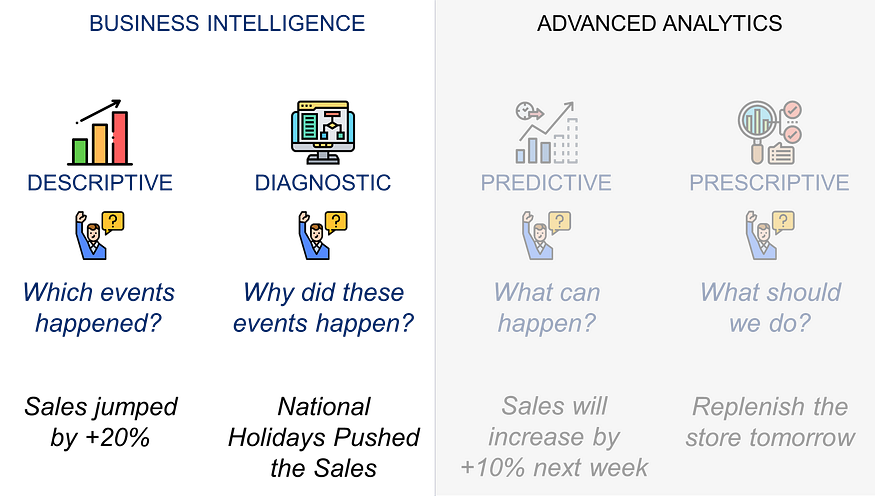
The other types of analytics, which use past data to provide predictions and prescriptions, are more advanced but still require a foundation in business intelligence.
Supporting Operational Performance Improvement
However, this kind of visual helps planning managers better understand their data, identify patterns, and extract insights.
- 37.8% of shipments are delayed because of transmission
Action: “I should contact the IT teams to solve these issues.” - 3.3% of shipments are delayed because of late loading
Action: “Align with warehouse ops to increase loading capacity
In general, BI solutions are included in a performance management process where data is used to
- Understand the Past: measure the performance, detect issues
- Implement Mitigation Plans: optimise a process, increase resources, solve IT issues
- Track the Operational Improvements: implement key performance indicators (KPIs), issues logging
In the following section, we will delve into the details of what exactly business intelligence is and how to implement it in your company.
The Mechanics of Business Intelligence
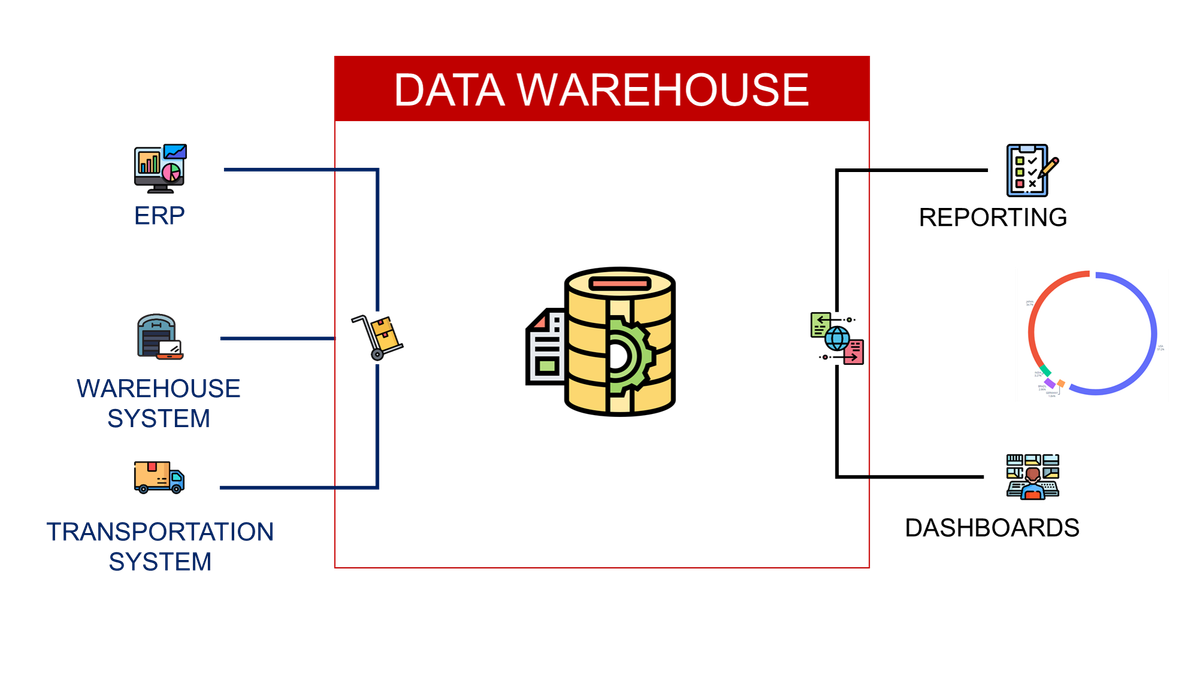
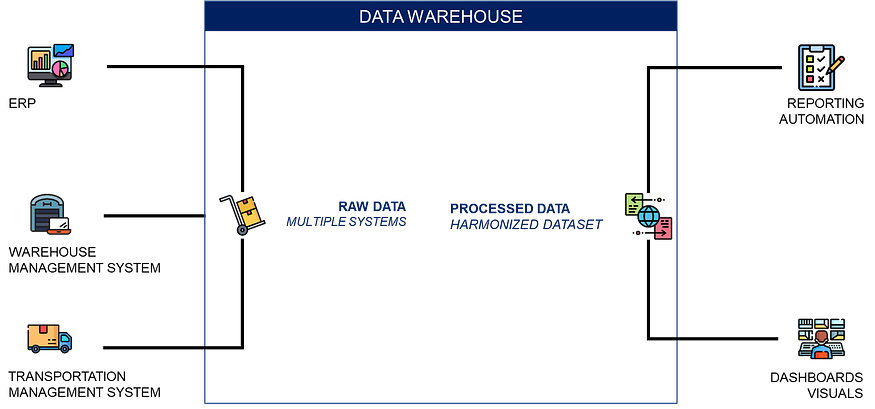
Business Intelligence platforms conventionally base their information on a data warehouse that aggregates data from several sources into a centralised source.
What is a Data Warehouse?
This consolidation simplifies business analytics and reporting.
In our example, we are trying to track delivery orders:
- Created in the ERP with creation date, expected delivery date, destination, SKU, quantity, […]
- Transmitted to the Warehouse Management System (WMS), which tracks order receiving time, order picking time, order shipping time
- Transmitted to the Transportation Management System (TMS) to follow the shipment from the loading at the warehouse to the store delivery.
BI solutions interact with these systems to:
- Process and translate the acquired data into a single harmonised source
- Build user-friendly reports, charts and maps
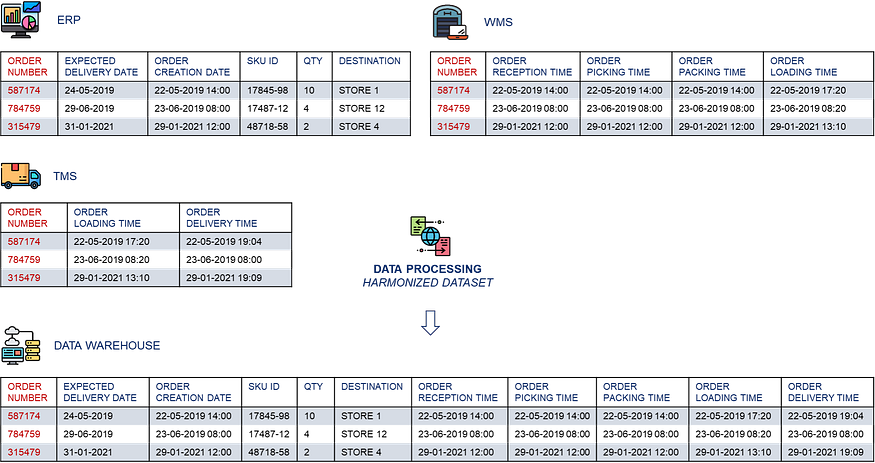
In this simple example,
- Data is stored in three different tables (from WMS, ERP and TMS) that have a common key: ORDER NUMBER
- The harmonised dataset is created by merging these three tables to get the complete flow from order creation to store delivery.
A central source of truth for reporting
Using this harmonized table, we can categorize orders by status looking at the last time stamp that is non-null.
Automated rules can be implemented to flag the orders
- If the delivery time is null, we have
Order status = In transit - The last non-null timestamp is used to flag the status
For instance, if the last non-null time stamp is Order Picking Time: Order status = PickPack
This source of harmonised data is the founding pillar of your data analytics journey, as it can also feed
- Machine Learning models to forecast stores' future demand, predict delays or estimate transportation lead times
- Prescriptive models to optimise the order allocation, improve the routing or plan resources at your warehouse

These solutions, which are outside the scope of Business Intelligence, still rely on the harmonised, cleaned dataset built by Business Intelligence.
In the next section, we will examine how Business Intelligence is critical to a company's digital transformation.
Why is Business Intelligence Significant?
Business Intelligence empowers organisations to transform data into actionable insights.
A company can also identify an operational problem and seek help from business intelligence teams.
Let us illustrate this with the example of our fashion retail company's green transformation.
Answering a simple business question
The main indicator of your company's environmental footprint is the amount of CO2 emitted to produce, deliver, and sell products.
To measure it, BI can be used to create a single source of truth across the supply chain, enabling tracking of emissions across different business units and time periods.
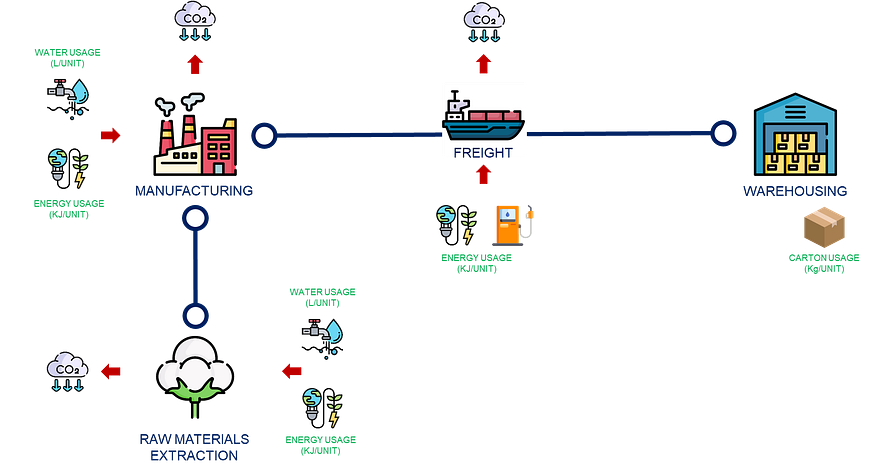
What is Life Cycle Assessment?
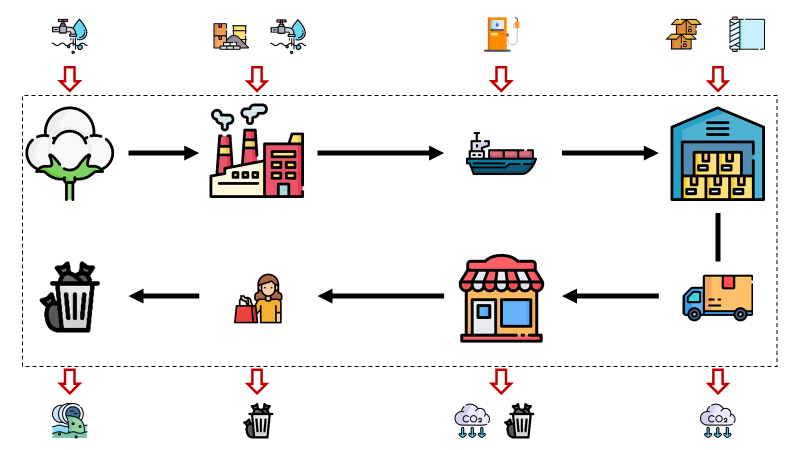
Life cycle assessment (LCA) is a methodology used to evaluate a product's environmental impacts.
It covers the entire life cycle from raw material extraction to disposal (end of life).
As you can imagine, this methodology mainly relies on aggregating and processing data from multiple sources.
Become a data-driven green organisation
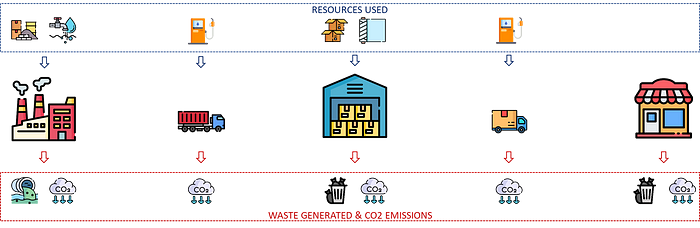
Our fashion retailer can rely on BI to become a green, data-driven company by implementing sustainability indicators across the supply chain.
A data warehouse can centralise data from multiple sources to track your environmental impact at each step of the life cycle.
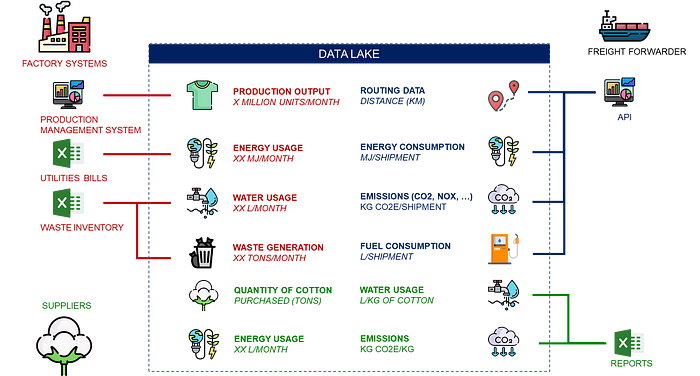
- Measure the production output by connecting to factories systems
- Collect utilities and raw material data usage of your factories, warehouses and suppliers from Excel files
- Receive CO2 emissions, fuel consumption and routing data from logistics companies via APIs
You can’t manage what you can’t measure.
The results of data processing will provide a granular view of the environmental footprint from the product's perspective.
For instance,
- Water consumption per T-shirt produced is 3,500 L/Unit
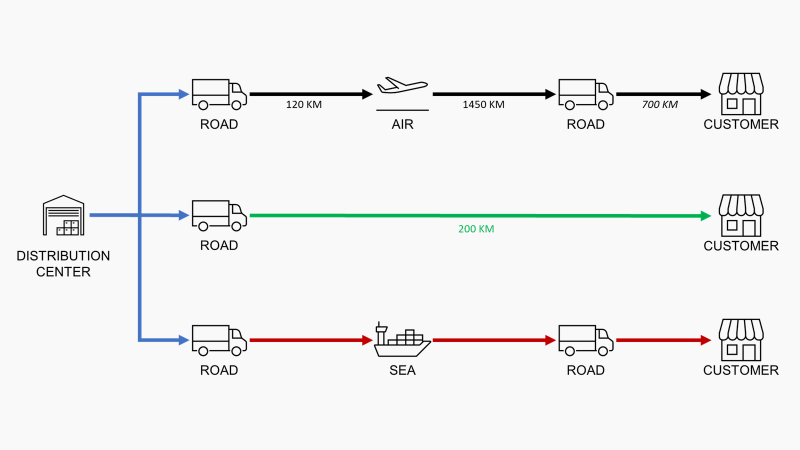
- 25% of the CO2 emissions are due to sea freight
- 0.8 g of SOx and 0.5 g of NOx are emitted per T-shirt produced
These indicators can be used to build your sustainability roadmap:
- Improve the efficiency of your manufacturing facility, considering the water and energy used per unit produced
- Challenge your freight forwarders and track their emissions to reduce the footprint of your transportation
- Improve the raw materials sourcing to reduce the amount of water used
💡 For more details about solutions for environmental footprint visibility,
- What is a Life Cycle Assessment?
- Supply Chain Sustainability Reporting with Python
Conclusion
The most effective BI tools facilitate operational management, detect issues and support your business transformation journey.
By connecting to a variety of data systems, they can provide valuable insights and uncover hidden patterns.
Business Intelligence tools not only provide solutions for descriptive analytics (dashboards, reports), they create a central source of trusted data that more advanced predictive or prescriptive algorithms can use.
To meet environmental targets, organisations must embrace these tools to extract operational insights from the data they generate.
About Me
Let’s connect on LinkedIn and Twitter. I am a Supply Chain Engineer using data analytics to improve logistics operations and reduce costs.
If you’re looking for tailored consulting solutions to optimise your supply chain and meet sustainability goals, feel free to contact me.