What is a Life Cycle Assessment? LCA
Use Data Analytics to evaluate the environmental impacts of a fast-fashion retail product over its entire life cycle from production to disposal.
Life cycle assessment (LCA) is a method for evaluating the environmental impacts of a product or service throughout its life cycle, from raw material extraction to disposal.
The goal of LCA is to identify and quantify a product's environmental impacts for reporting purposes and to support sustainability initiatives.
What is the environmental impact of the cheap t-shirt you bought in this fast-fashion retail store?
It requires data from multiple sources to track the impact of your products throughout the value chain until the end of life.
In this article, we will explore how advanced data analytics tools can support Life Cycle Assessment (LCA) by extracting and processing data from multiple systems to perform diagnostics and simulate scenarios.
Assessment in four steps
Goal and scope definition
To initiate our Life Cycle Assessment (LCA), we need to define the goals and scope of this assessment.
This includes identifying the product being studied, the environmental impacts of interest, and the functional unit (the unit of measurement used to compare different products or services).
What is the environmental impact of producing and selling a t-shirt in a fast-fashion retail company?
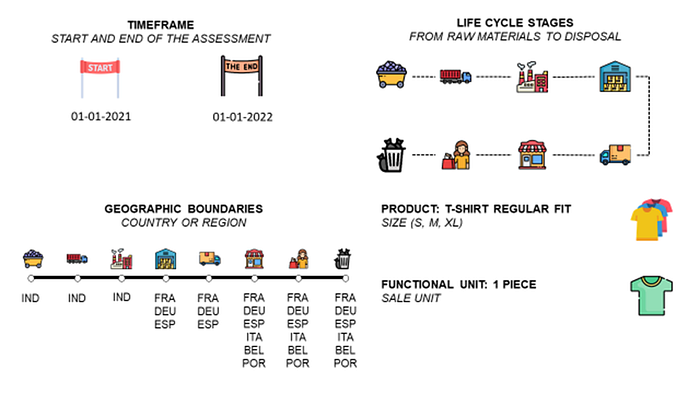
- Clearly identify the product being evaluated and its intended use
Example: T-shirt Regular Fit, including all sizes - Identify the specific life cycle stages of the product to be included in the assessment: from raw material extraction to disposal.
- Specify the geographic boundaries of your assessment: the locations of the production facilities, transportation routes, and final disposal.
Raw materials extraction and production in India
Storage, store delivery and disposal in Europe - Identify the assessment time frame: the assessment's starting and ending dates.
From January 1st 2021 to January 1st 2022 - Define the functional unit, a common unit of measure that is used to compare the environmental impacts of different products.
1 unit of sales: a single T-shirt.
Ensure that the scope is agreed upon by all stakeholders involved in the assessment to ensure that the Life Cycle Assessment results are meaningful, representative, and not challenged.
📊 From the Data Analytics Angle
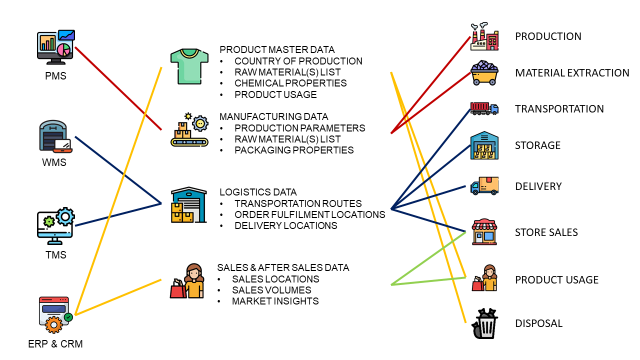
The product will be linked to one (or several) SKU code(s) in your different systems (ERP, WMS, TMS)
- You may have several codes for the different sizes and colours of t-shirts.
- Codes can vary from one system to another (SKU Production Code, SKU in Sales Packaging, ..): make sure you have consistent master data to track your items along the value chain.
For each life cycle stage, you may have different data sources/systems
- Production data can be found in your Production Management Systems or in your Enterprise Resources Planning
- Transportation will be managed by Transportation Management Systems
- Warehouse Operations data are stored in a Warehouse Management System
- Sales (and after-sales) data can be extracted from your Point of Sales (POS) and Customer Relationship Management (CRM) systems
Geographic boundaries can be defined by the source system and transaction information
- Raw material sourcing information can be found in the purchase orders created in the ERP
- Production locations information in the PMS (Factory, production line)
- Transportation locations are tracked in the shipment information in your TMS (Origin, Destination, Countries crossed)
Identifying the time frame can be challenging and will impact your assessment results
- Are we talking about all products sold in the time frame?
- Or do we look at the activities in the time frame?
Note that the scope can be more or less detailed depending on your needs and the initiatives expected to benefit from the results.
Inventory Analysis
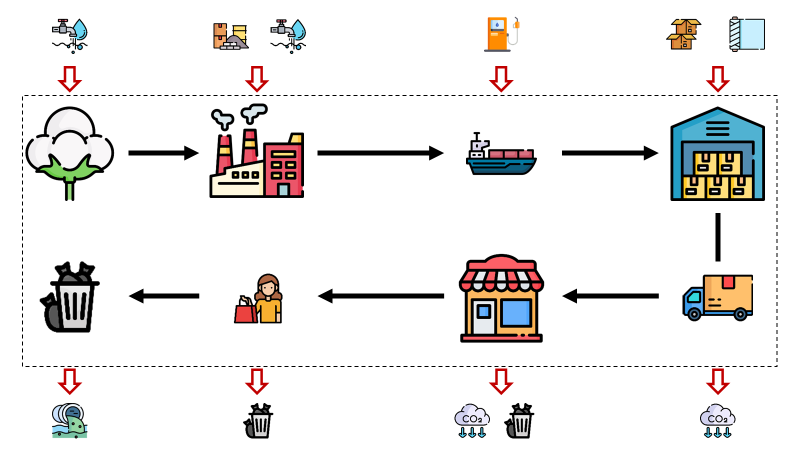
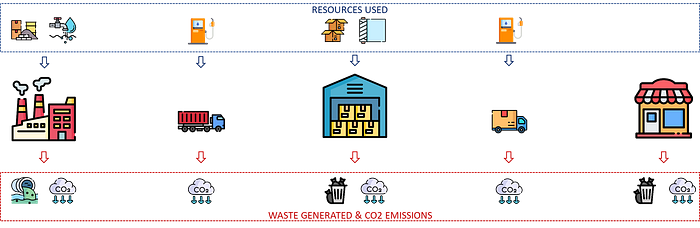
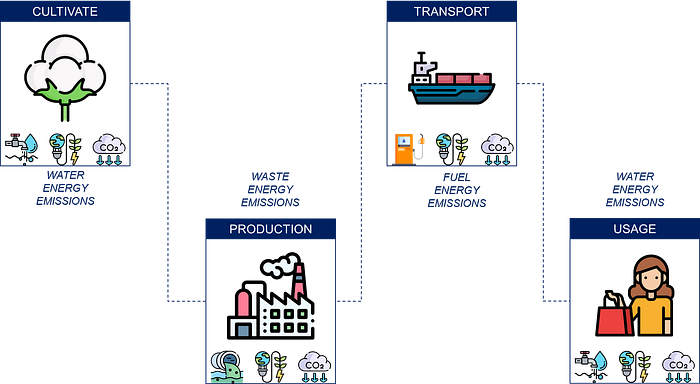
The second step is to gather data on the materials, energy, and other resources used, as well as the waste generated throughout the life cycle of the product or service.
Raw materials
Your t-shirt is made of 100% cotton grown and processed in India

You can now quantify the CO2 emitted and the energy and water used per functional unit.
💡 Impact of Raw Material Cultivation
- We have 1kg of raw material = 1 functional unit.
- Quantities of cotton and utilities consumed can be estimated or measured by your suppliers.
Production
The T-shirt is produced in your factories located in India

Transportation
Your t-shirt is produced in India and shipped to Europe by sea freight
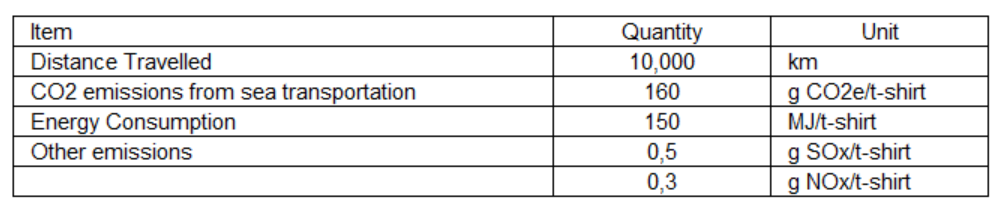
💡 Impact of your Logistic Network
- Sea transportation energy and emissions data are highly variable and depend on the vessel, time of year, and shipping route, and should be validated (or provided) by your freight forwarder.
- CO2 emissions of transportation can be estimated for the other transportation modes (route, air and rail), like in this example of CO2 emissions reporting methodology
- For water and electricity consumption, CO2 emissions, and generated waste, warehouse operations can also be considered.
Usage and disposal
Your product is used (usage and disposal) in the market’s country.
The t-shirt is used for 2 years before being disposed of.
- Energy consumption for washing and drying: 100 MJ/t-shirt
- Water consumption for washing and drying: 500 L/t-shirt
- Emissions from electricity generation: 10 kg CO2e/t-shirt
The t-shirt is disposed of in a landfill in the country where it is sold.
- Emissions from decomposition: 5 kg CO2e/t-shirt
📊 Data Analytics Solutions for Inventory Analysis
Instead of using estimation or average, you can build a data architecture to retrieve updated data and metrics in a data lake
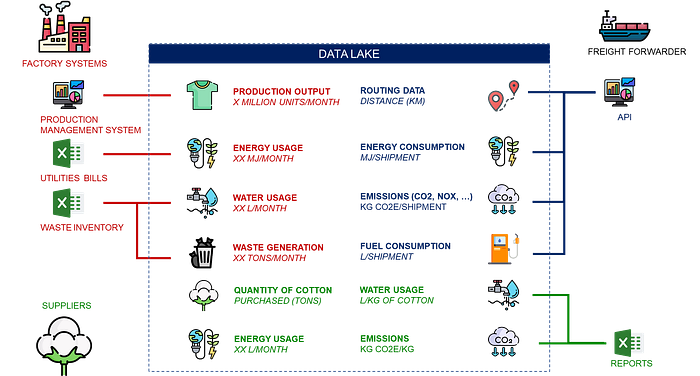
- Energy, water usage or waste generation per unit may not be available in the system managing your factory
Use external sources like energy bills in Excel files - Energy and water usage for cotton cultivation can be provided by your suppliers in Excel reports that will feed your reporting
- Some freight forwarders have API(s) to extract routing information, emissions and fuel consumption per shipment
This architecture will reduce manual work and improve reporting accuracy by using up-to-date parameters and input data.
Impact assessment
Now that we have gathered data for each step, we can start evaluating the environmental impacts of the functional unit (1 t-shirt here) on
- air, water, and soil
- human health and ecosystem health
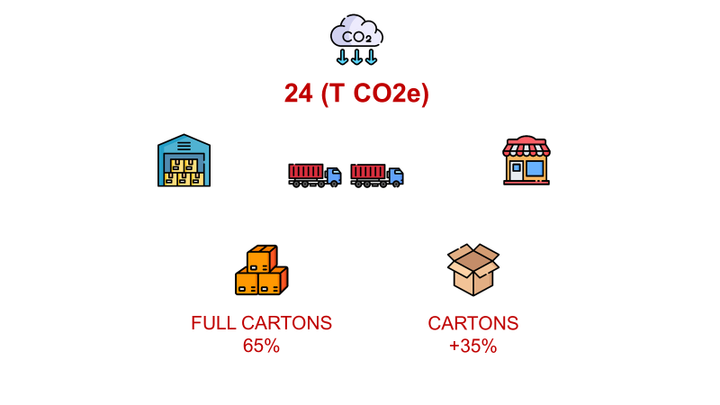
- Energy consumption: 870 MJ
- Greenhouse gas emissions: 46 kg CO2e
With a majority of the emissions during production - Water consumption: 3,500 L
57% consumed during production - Solid waste: 0.5 kg
generated during production - Air pollution: 0.8 g of SOx and 0.5 g of NOx emissions
emitted during transportation
The majority of the impacts are generated during production and transportation.
Interpretation and evaluation
This is the process of assessing the areas for improvement and potential mitigation strategies.
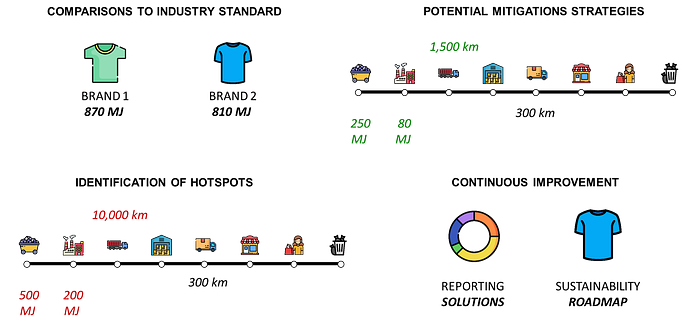
Comparison to industry standards
The impact assessment results can be compared to industry standards or benchmarks to see how the t-shirt compares to other similar products in terms of environmental performance.
Identification of hotspots
The results of the impact assessment can be used to identify the “hotspots” where the t-shirt has the greatest environmental impact.
In our example, these hotspots are greenhouse gas emissions and energy consumption during production and transportation.
💡 Diagnostic Analytics for automated identification
If you have implemented a data pipeline to gather, process and store data for your inventory, you can implement diagnostic analytics tools and methodologies to automatically
- Manage several thousand SKUs with different value chains
- Implement automated rules for monitoring, alerting and root cause analysis to answer questions like
Why did the CO2 emissions of SKU 132897–98 increase by 20%?
Potential mitigation strategies
Based on the identified hotspots, potential mitigation strategies can be developed to reduce the t-shirt's environmental impact.
💡 Example of initiatives
- Use renewable energy for production facilities
- Localise the production to reduce the transportation distance between factories and markets.
- Partner with forwarders that use alternative fuels or own eco-efficient fleets to reduce the CO2 emissions per km
- Conduct studies for Supply Chain Network Optimization focusing on reducing the environmental impact by choosing the right suppliers and factories locations
Continuous improvement
The results of the interpretation and evaluation should inform continuous improvement of the product's or process's environmental performance.
Of course, you need to consider the trade-offs between the environmental impacts and other aspects such as cost and performance to reduce the business impacts.
Next Steps
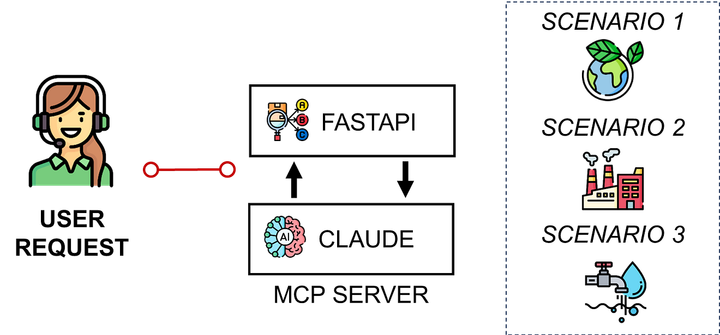
This article mainly focused on how data analytics can support data gathering, processing and visualisation with diagnostic tools.
Simulate different scenarios with a Digital Twin
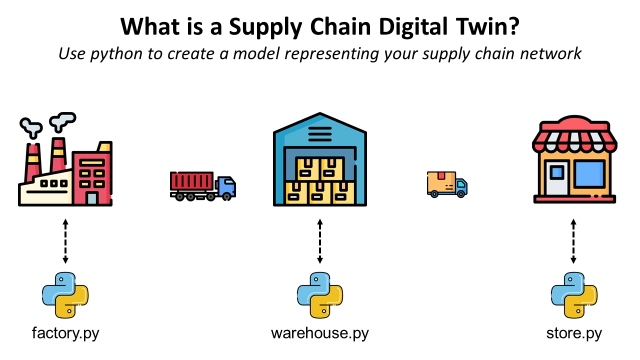
A digital twin is a digital replica of a physical object or system.
A Supply Chain digital twin is a computer model that represents the components and processes of the supply chain, including warehouses, transportation networks, and production facilities.
In this digital representation, you can model each element of your end-to-end supply chain, including costs, energy, emissions, and lead times.
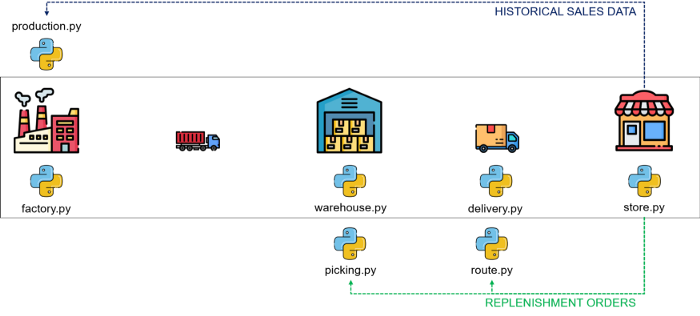
When brainstorming potential mitigation strategies, you can simulate their impacts on the whole supply chain.
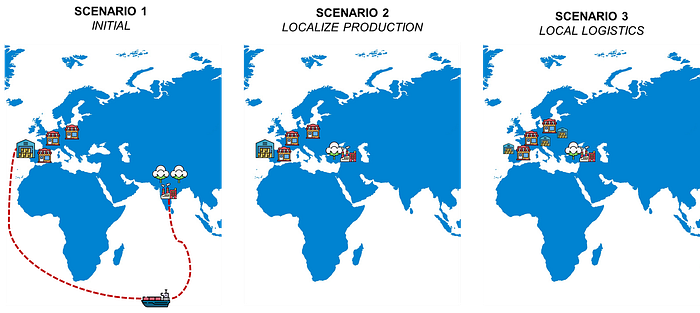
For example,
- What would be the impacts on logistic costs and CO2 emissions if we localize the production?
- What would impact your inventory and store delivery lead time if we use alternative (green) cultivation methods outside India?
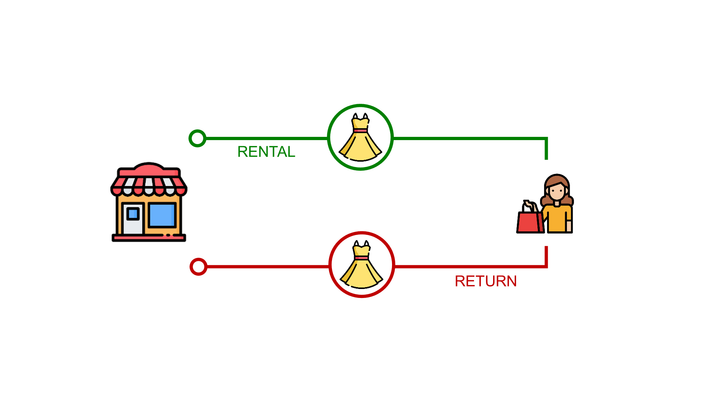
- What would be the costs of implementing a lo,istic network to collect used items at the store?
For more details,
Conduct Further Analysis with Brightway2
Brightway2 is a Python library and framework for life cycle assessment (LCA).
It includes specific tools like
- A database of environmental impact data for a wide range of products, processes, and systems that can be used to conduct your benchmarks
- Support for multiple impact assessment methods, including Eco-Indicator 99, ReCiPe, and the Environmental Input-Output Life Cycle Assessment (EIOLCA) method.
For more details, see the documentation.
About Me
Let’s connect on LinkedIn and Twitter. I am a Supply Chain Engineer who is using data analytics to improve logistics operations and reduce costs.
If you’re looking for tailored consulting solutions to optimize your supply chain and meet sustainability goals, feel free to contact me.