
What is Supply Chain Analytics? Definition, the Four Types, and Where to Start
Supply chain analytics defined, the four types with a real case study each, the return path most companies never complete, and the first project to run on your data.
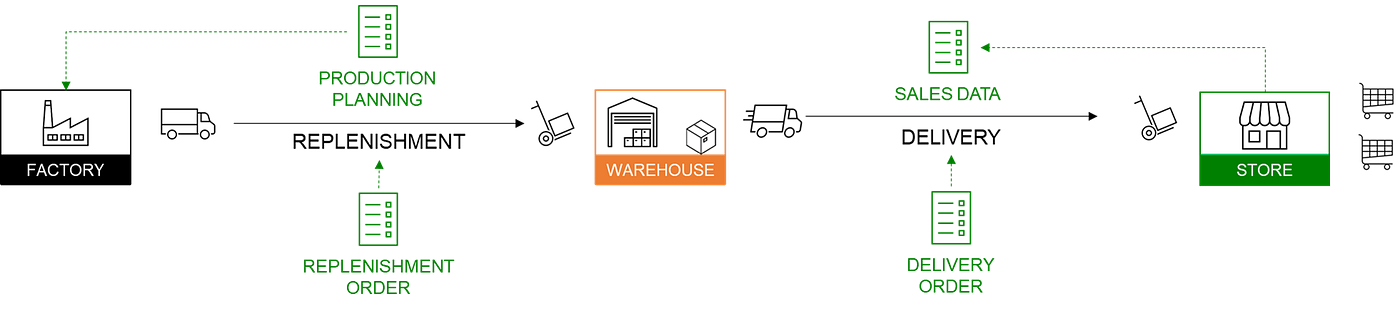
A supply chain is a set of parties exchanging flows of material, information and money to fulfil a customer request.
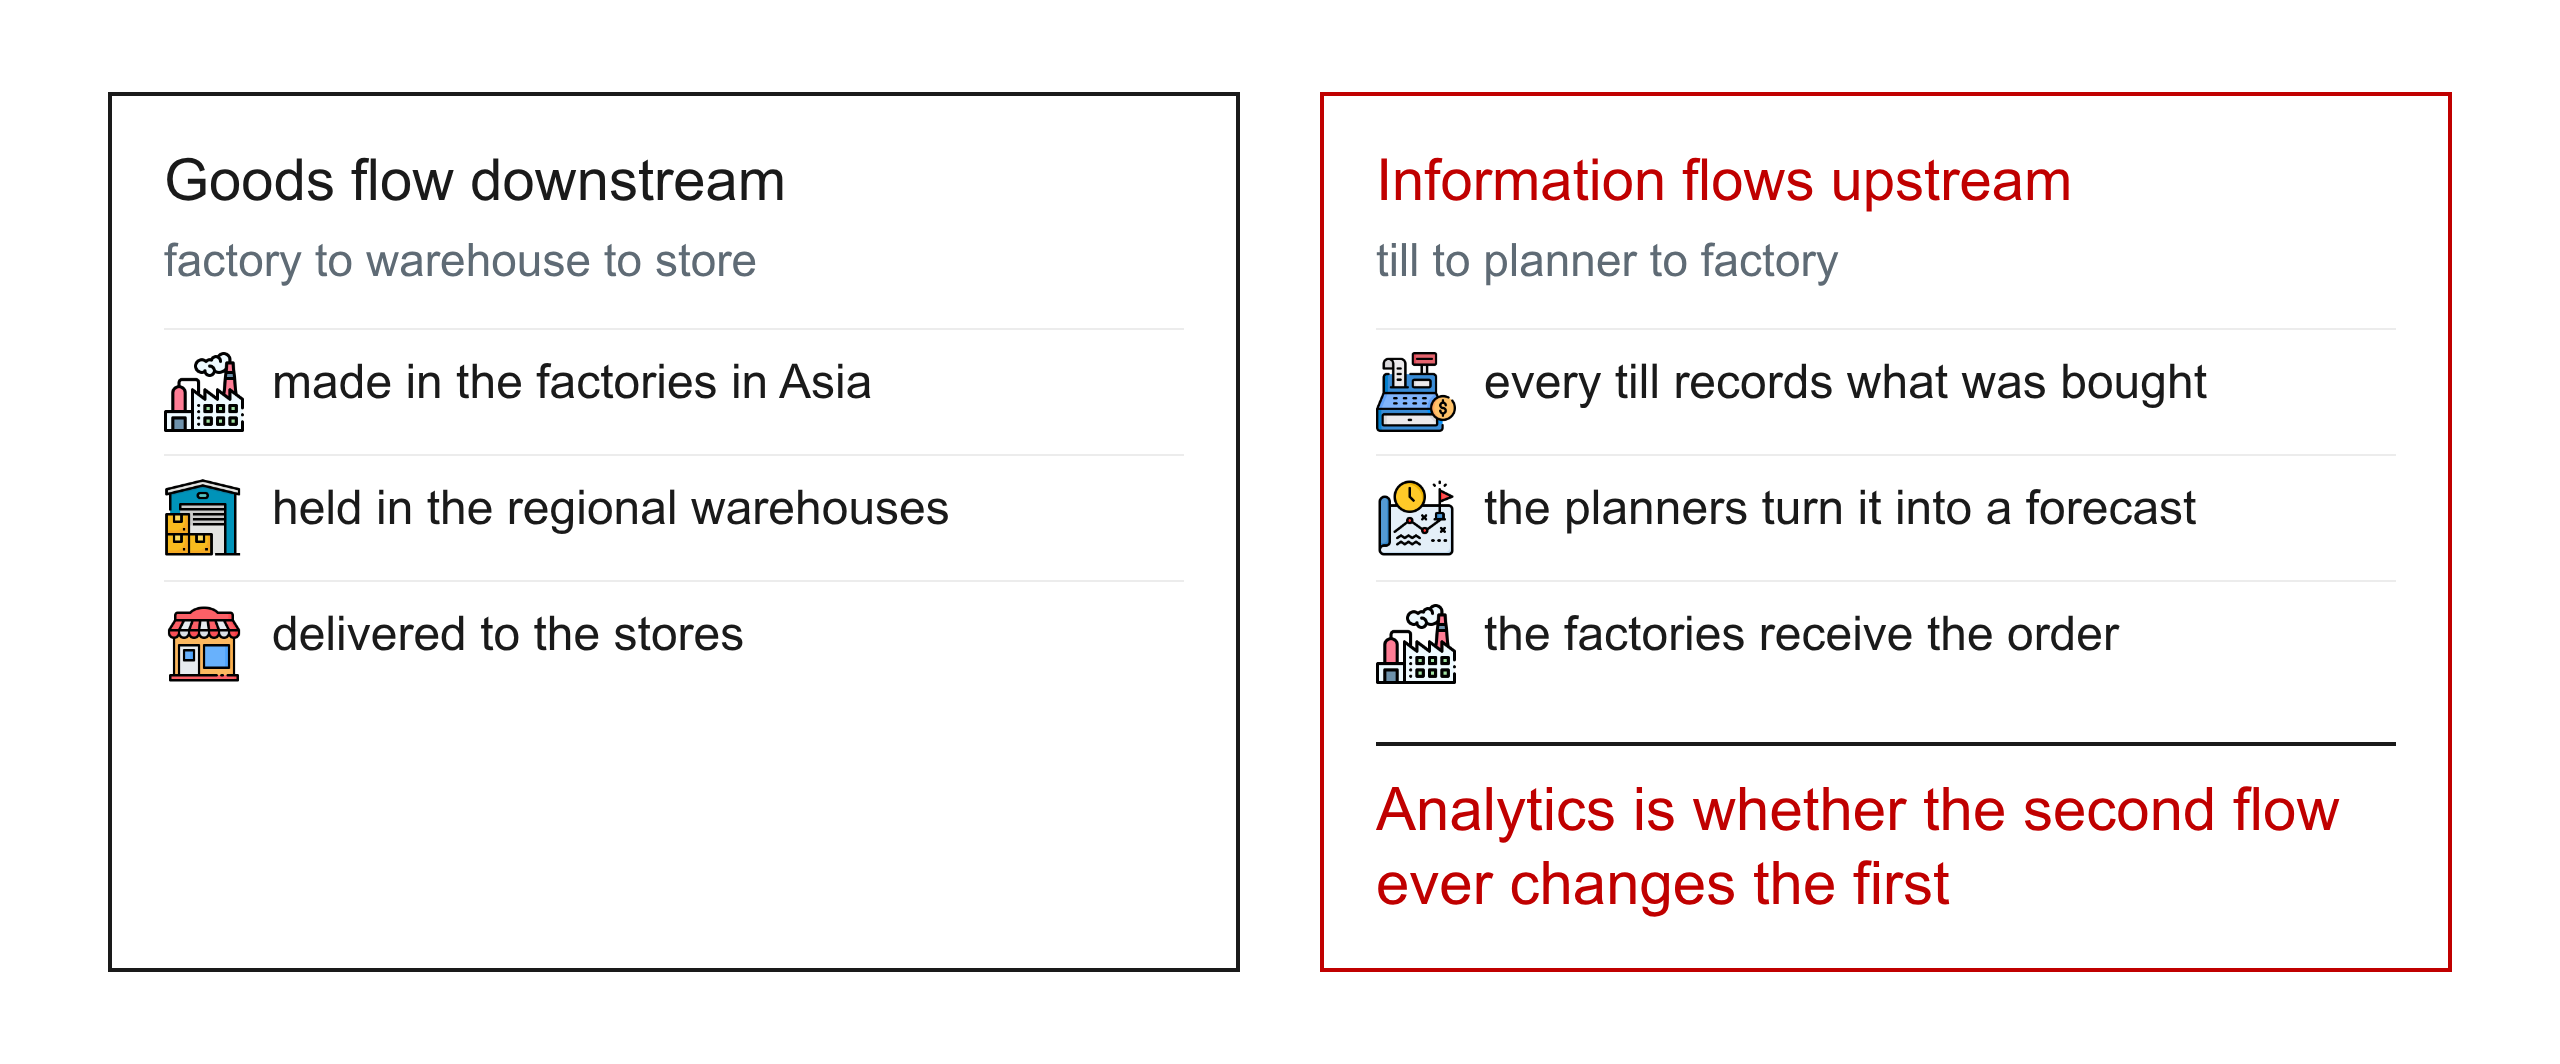
Goods flow one way, from factories through warehouses to stores, and information flows the other way, from the till back up the chain, and supply chain analytics is the discipline of using that second flow to improve the first.
Every till in every store already records what was bought, so the question is never whether the data exists, it is whether it ever travels back to change a decision.
I have spent more than ten years applying this in logistics operations across Asia and Europe, first as a supply chain engineer and then as a data scientist.
Most of the value I have seen came from asking the right type of question rather than from the sophistication of the model.
In this article, I will define supply chain analytics and walk through the four types with a real case study for each.
I will then explain why the return path is where most companies fail, and give you the first project to run on your own data.
The scenario: a fashion retailer's supply chain
Take an international clothing group with stores around the world.
Garments, bags and accessories are made in factories in Asia, warehouses are replenished in bulk from those factories, and the stores are delivered from the local warehouse nearest to them.
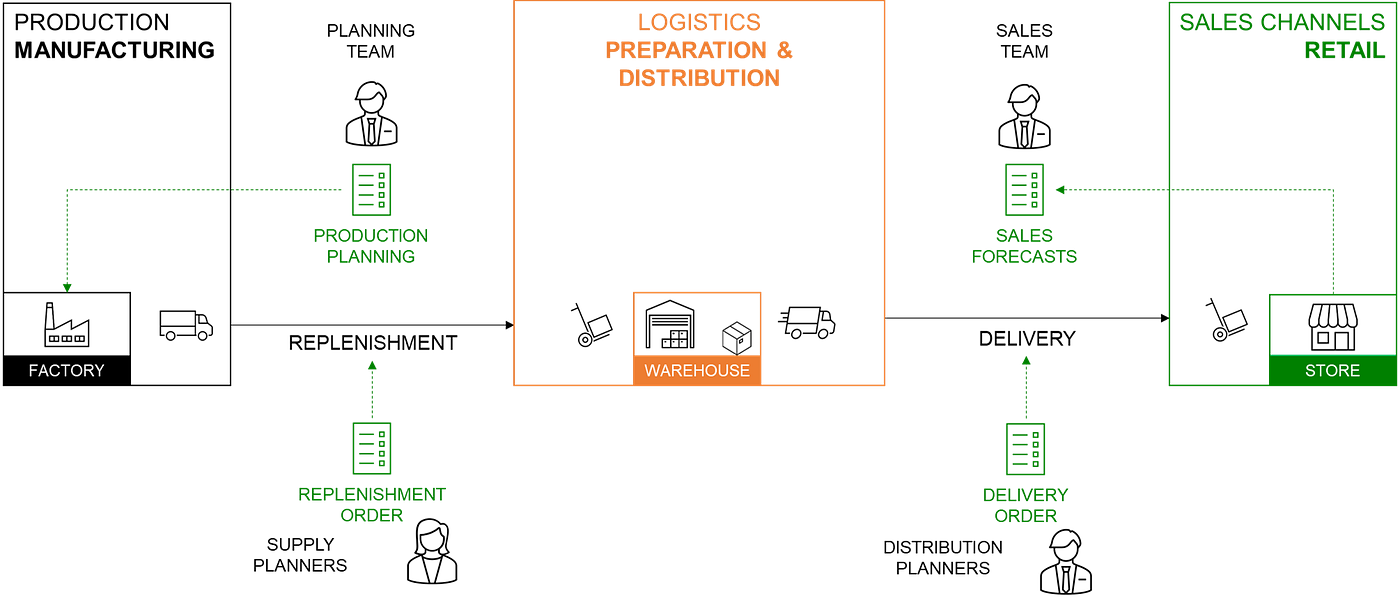
The flow of goods is simple to draw, and the flow of information is where the teams live.
Sales and merchandising collect sales data from the stores, the planning team turns it into a demand forecast, supply planners send orders to the factories, and distribution planners create the store replenishment orders for the warehouses.
Every one of those four teams makes a decision every week, and every decision is either informed by the data coming back from the stores or made by habit.
Supply chain analytics is the set of tools that let the data reach the decision.
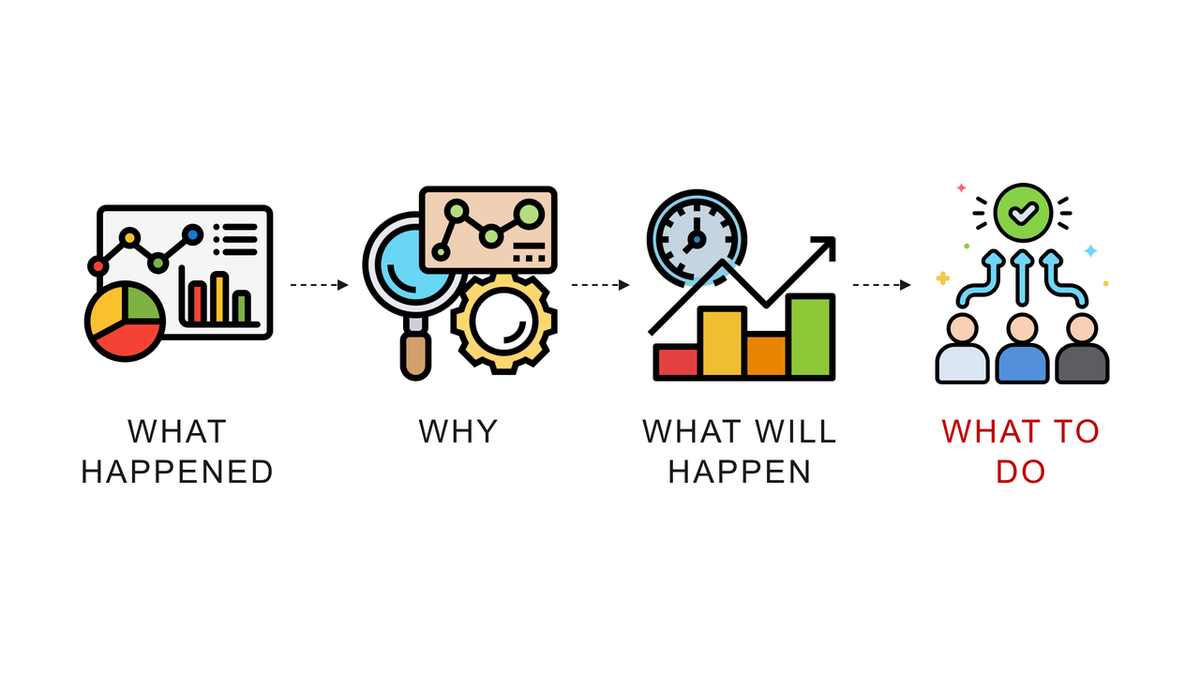
The four types of supply chain analytics
Each type answers a different question, and the type is decided by the question, not by the tool.
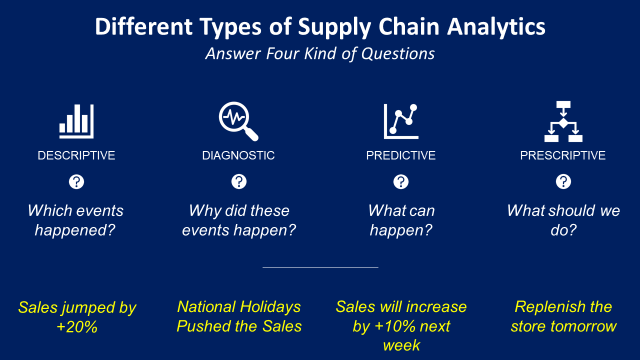
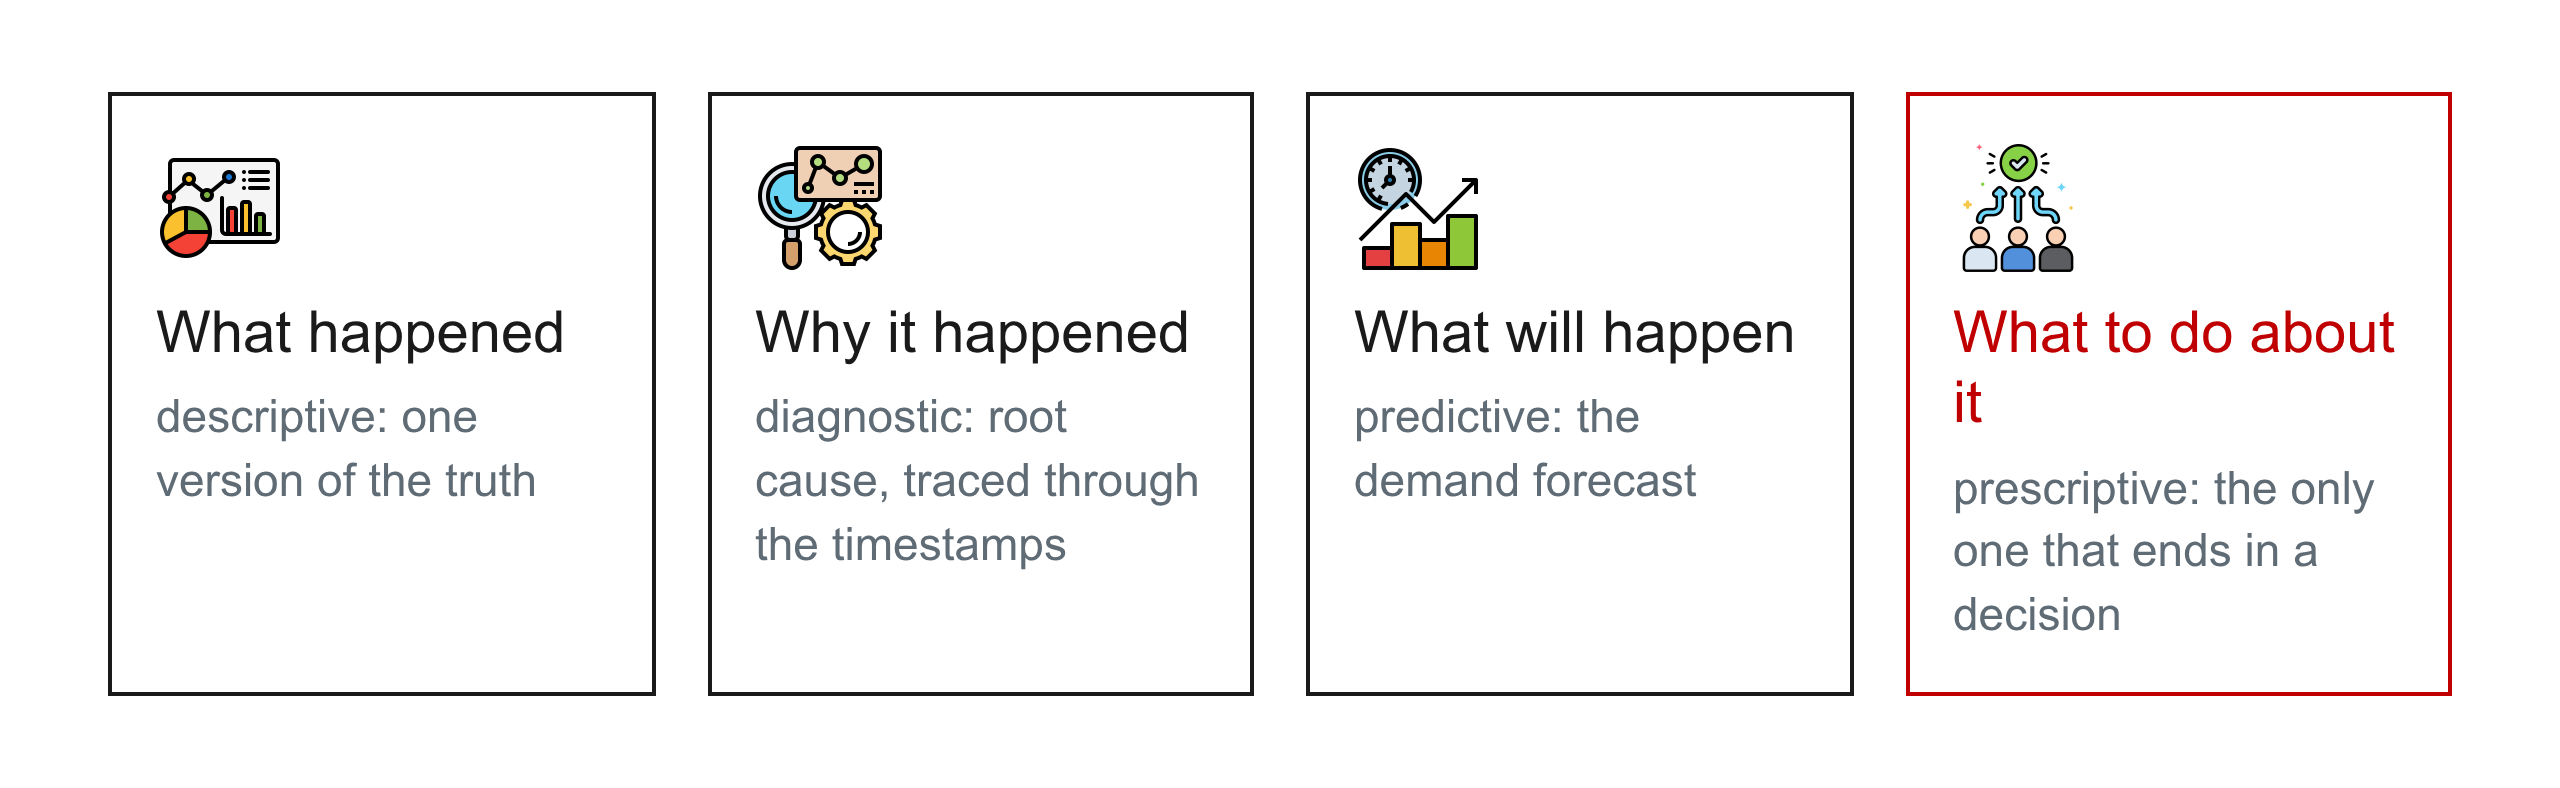
Descriptive analytics: what happened?
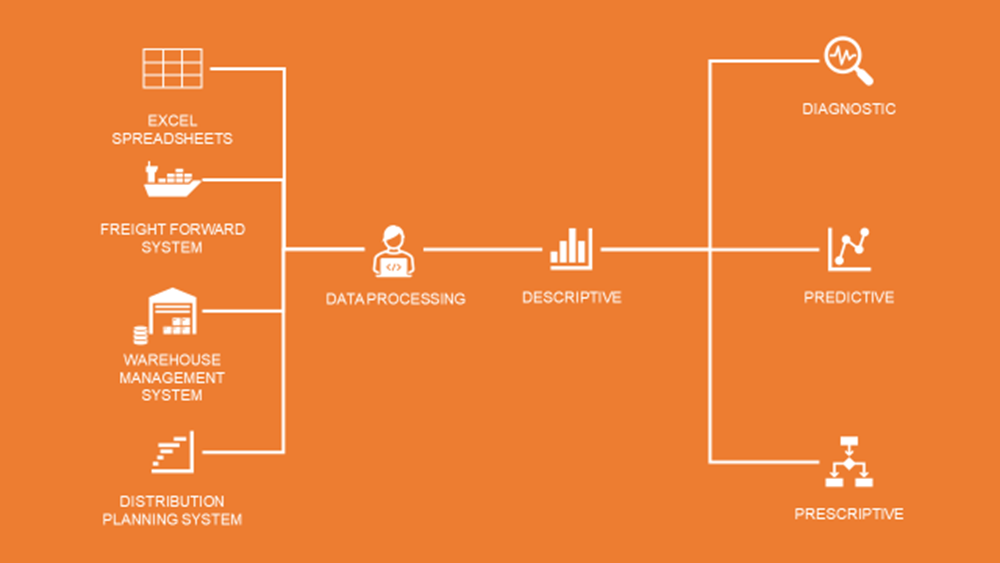
Descriptive analytics gives the operation one version of the truth: how many orders were prepared, where the shipments in transit are, what the productivity was last week.
The deliverable is usually a set of dashboards, and the three I build most often are a warehouse workload report, a supply chain control tower that tracks shipments step by step, and a transportation route analysis.
The hard part is rarely the chart, it is the data model underneath it, because a control tower needs a timestamp at every step of the chain before it can say anything about any of them.
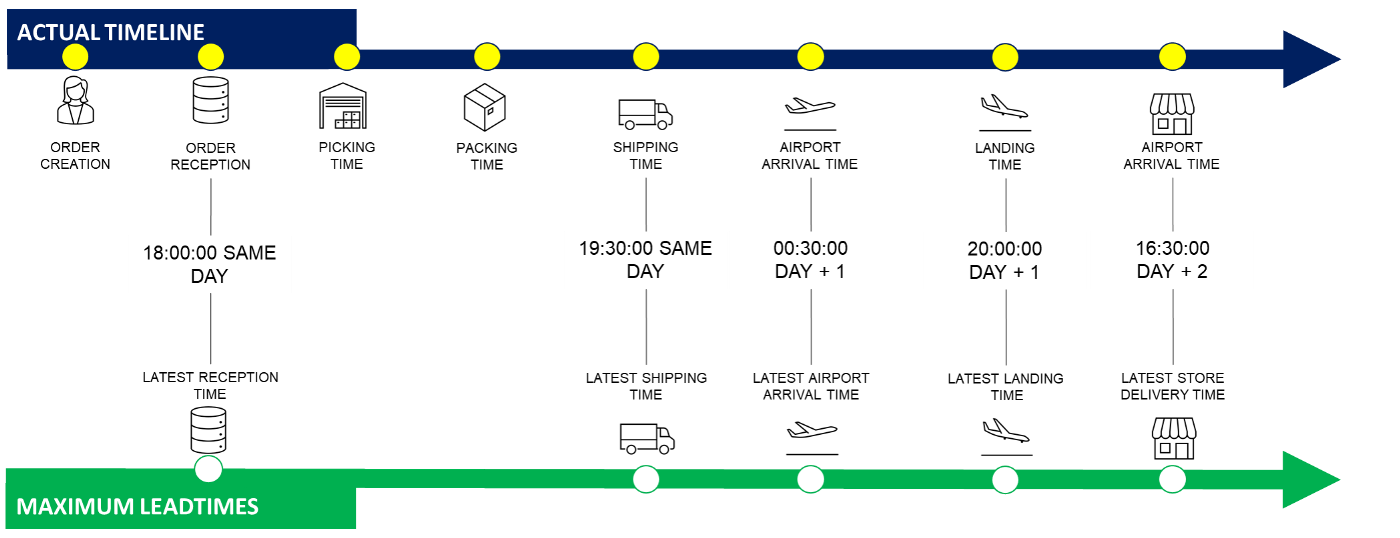
Diagnostic analytics: why did it happen?
Diagnostic analytics is root cause analysis, and it needs granularity rather than volume.
In the control tower example, tracing the timestamps back through each stage shows that long customs clearance lead times lead directly to late deliveries, which is a sentence the monthly report could never produce.
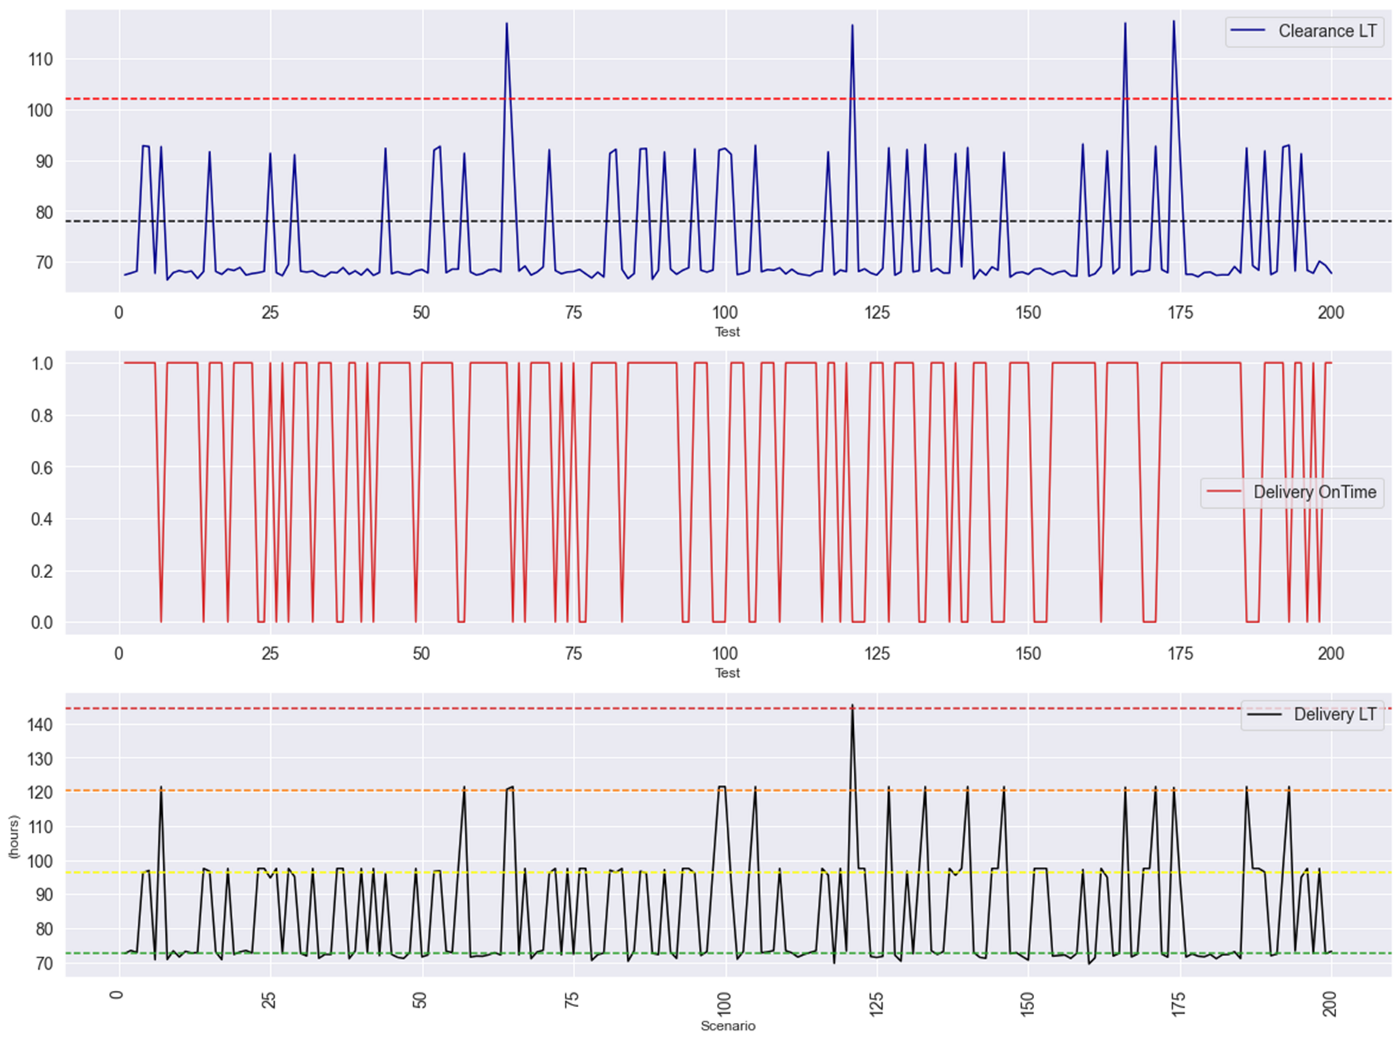
The methods are statistical as often as they are visual: when a warehouse manager claims a process change improved productivity, a Chi-squared or Kruskal-Wallis test is how I check whether the difference is real.
Predictive analytics: what will happen?
Predictive analytics says what to expect next, and in supply chain that is almost always a demand forecast.
The forecast needs history of the exact thing being predicted, at the frequency it will be predicted, and over enough time to have seen the pattern repeat rather than happen once.
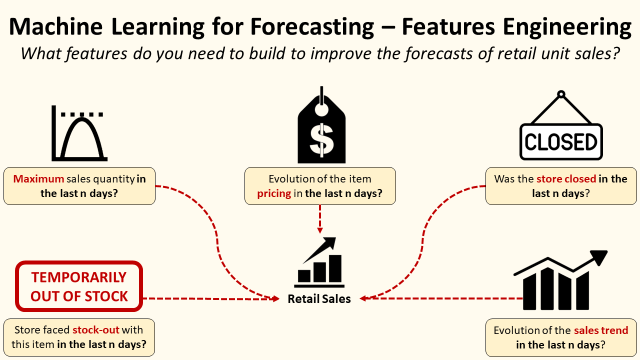
I have written up the feature engineering for retail sales forecasting and the demand forecasting case study that most planning teams start from.
Prescriptive analytics: what should we do?
Prescriptive analytics is the only type that ends in a decision somebody can act on, and it is where optimisation lives.
Somebody has to decide what to minimise, cost or CO2 or lead time, which is a management decision rather than a data one, and then the model finds the plan.
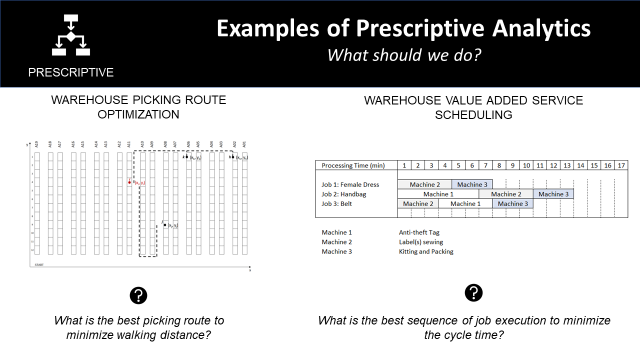
The case studies on this blog cover most of the standard problems: supply chain network optimisation with linear programming, production planning with the Wagner-Whitin algorithm, inventory management under uncertain demand, and warehouse picking routes.
A job asking you to reduce inventory cost is asking for the last two types. A course that taught you to draw a chart has given you the first.
Why the return path is where it fails
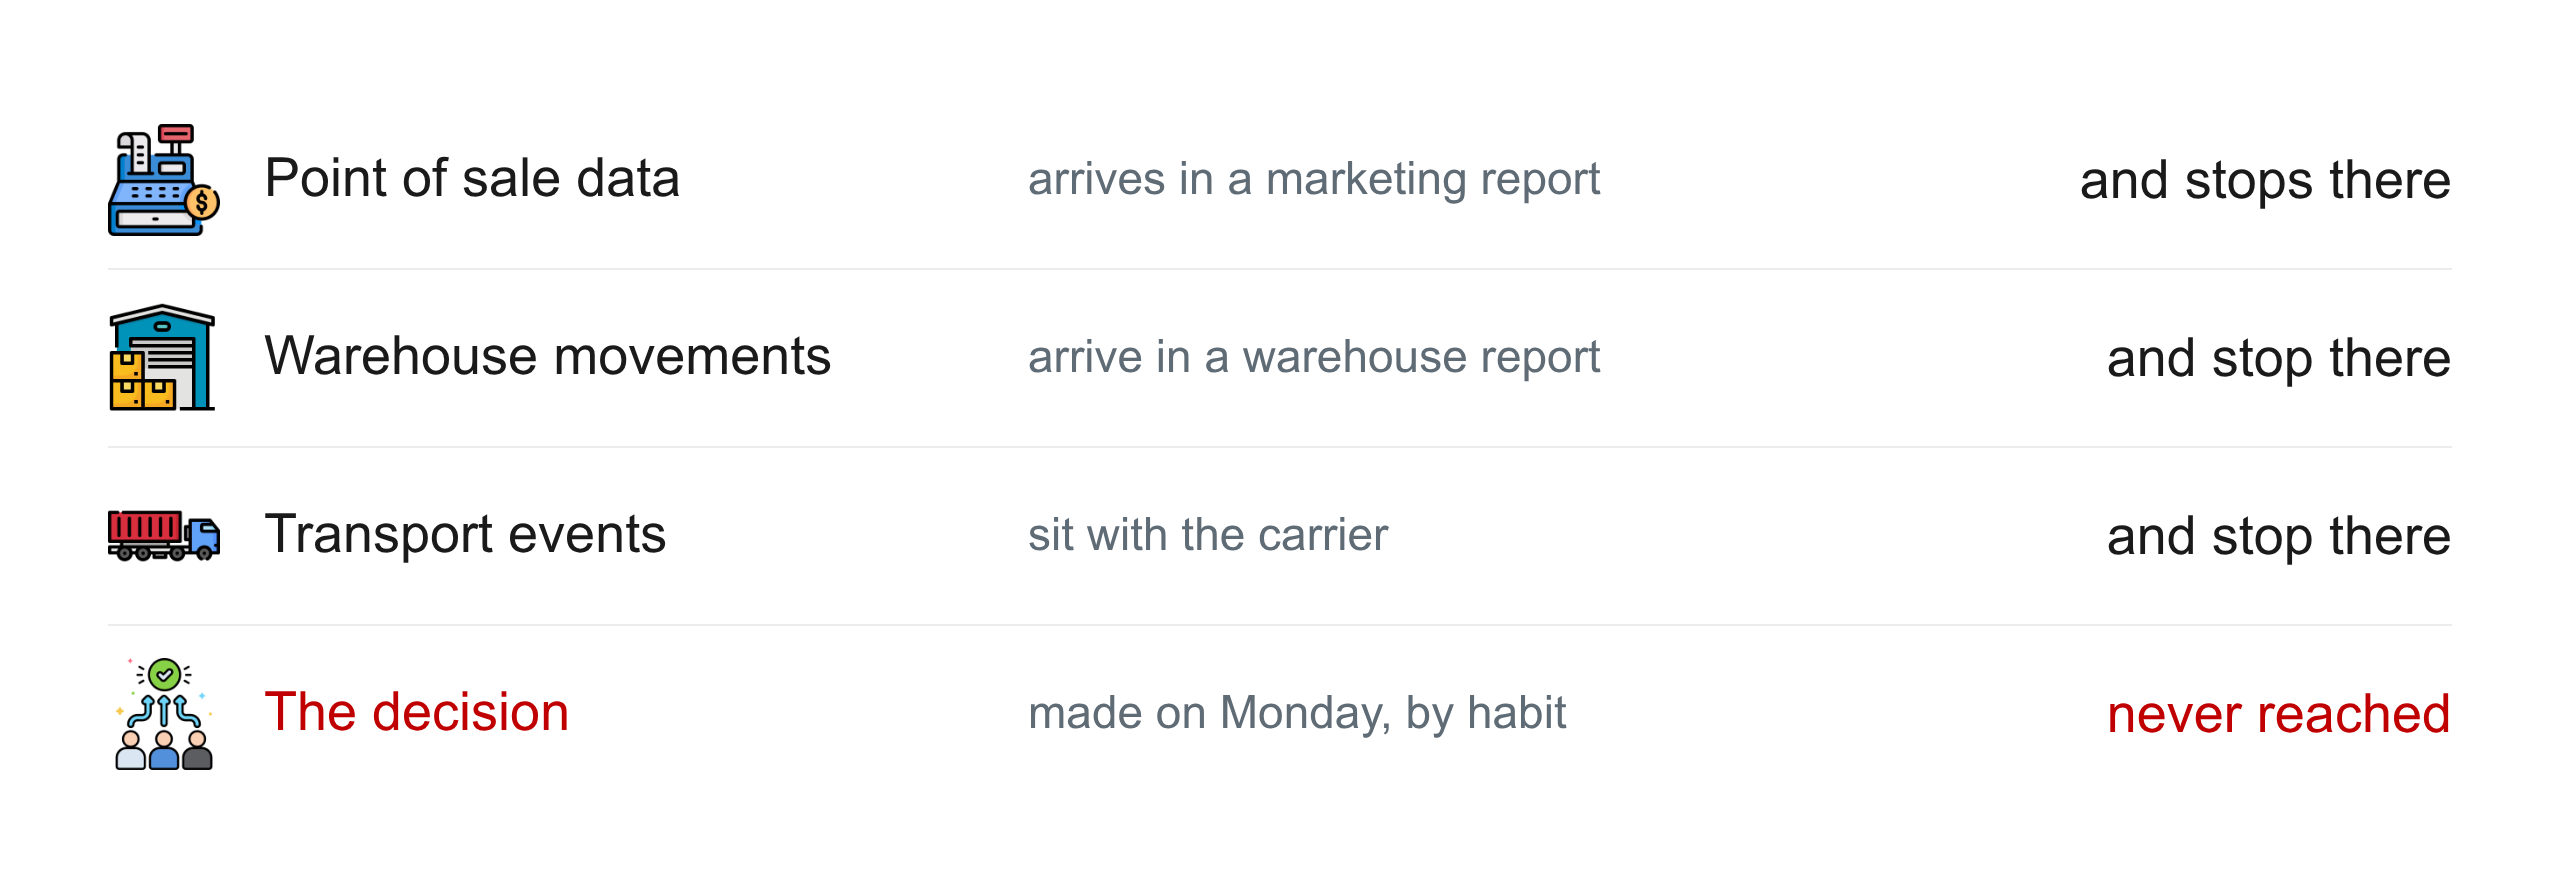
Both flows already exist in almost every company: point of sale data is captured, warehouse movements are logged, transport events are recorded.
What is usually missing is the return path, because the sales data arrives in a marketing report, the warehouse data in a warehouse report, and the transport data stays with the carrier, and each one stops where it lands.
That is not a technology problem, and buying another system does not fix it.
The analytics that survive are the ones embedded in the workflows people already use, by email or in the messaging tool, rather than behind one more login.
What skills do you need?
Three, in this order.
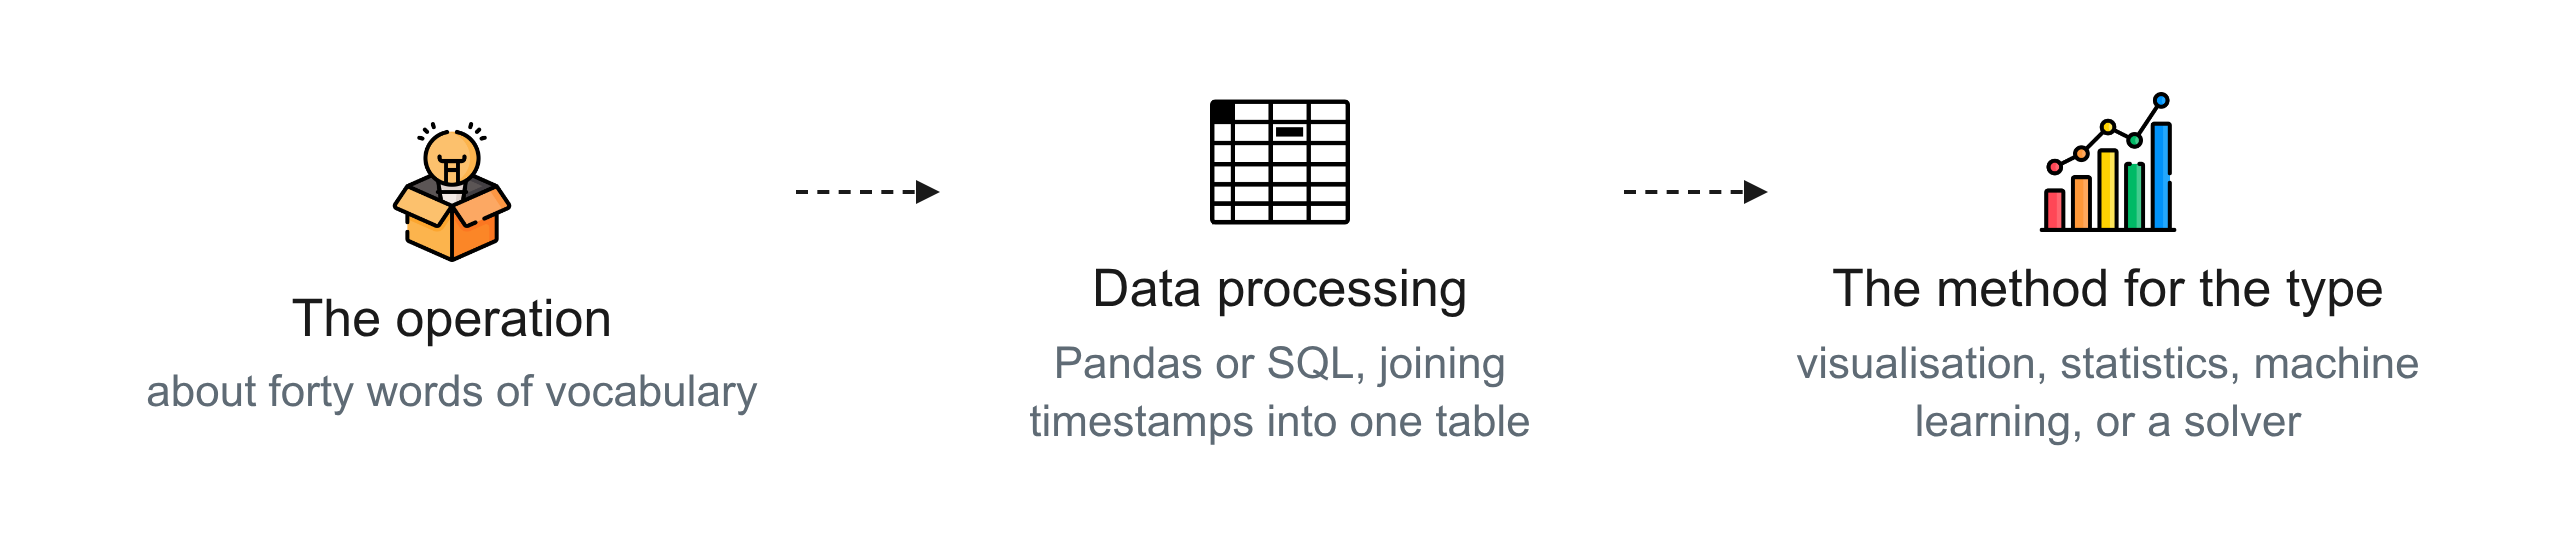
The first is the operation itself, because you cannot spot that the review period is the lever if you do not know what a review period is, and about forty words of vocabulary cover most of it.
The second is data processing, in Python with Pandas or in SQL, because every type above starts by joining timestamps from several systems into one table.
The third depends on the type: visualisation tools for descriptive work, statistics for diagnostic, machine learning for predictive, and operations research with a solver such as PuLP or OR-Tools for prescriptive.
If you are choosing where to start, I made the case for why supply chain is the best domain for a data scientist, and the portfolio guide covers what to build to get hired.
The first project to run on your own data
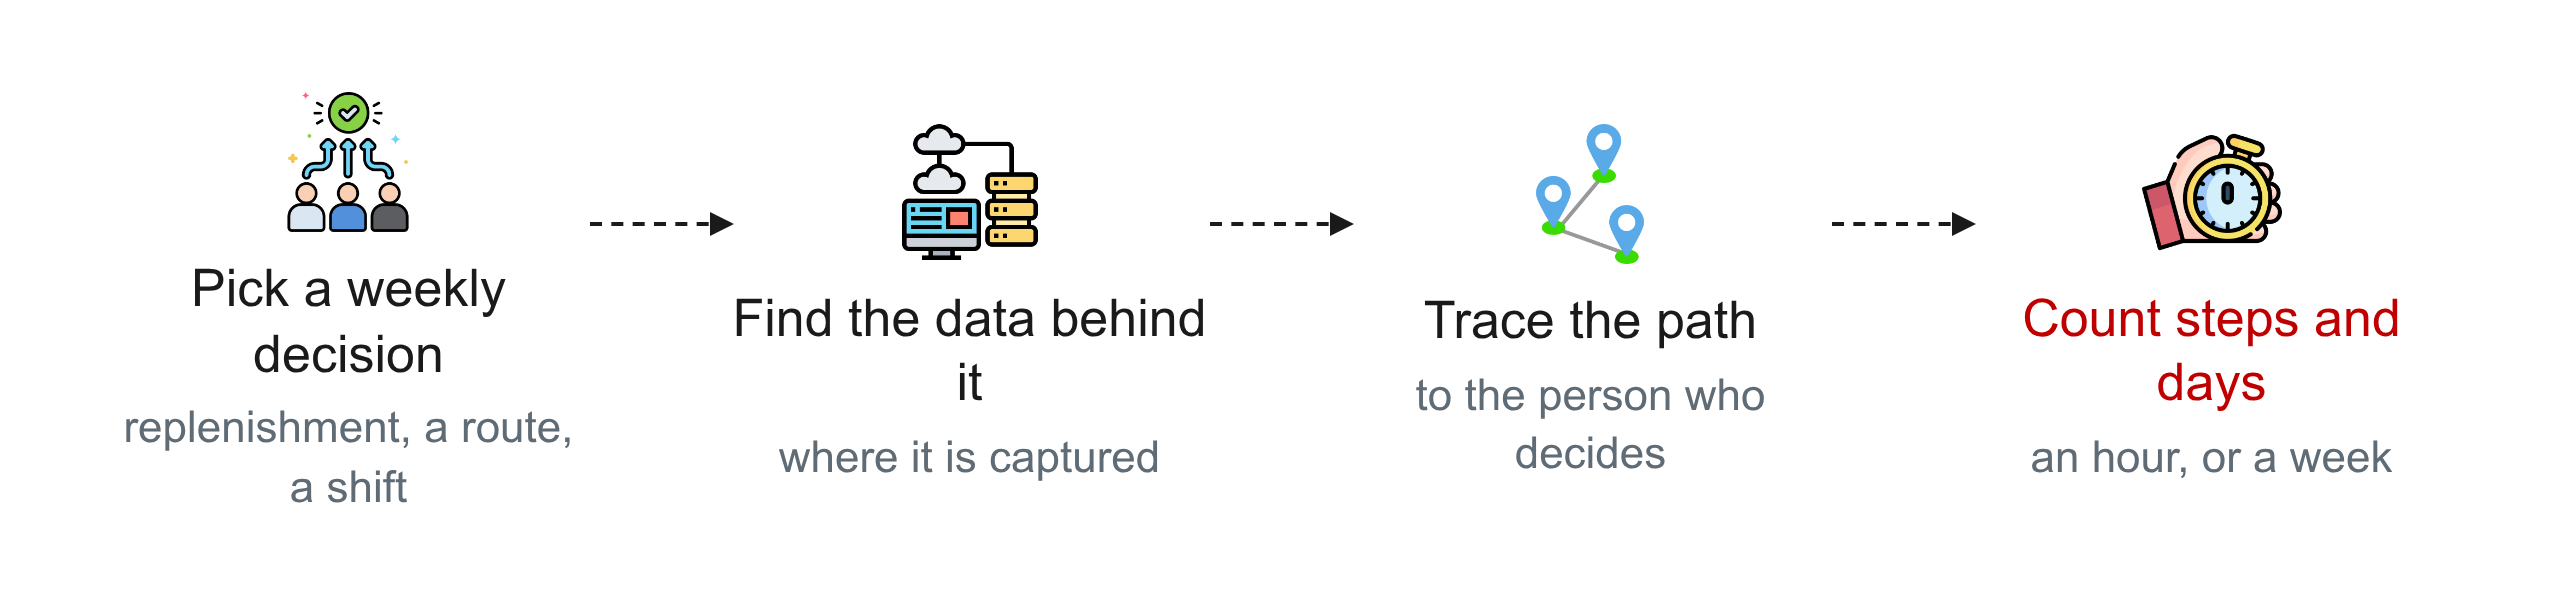
Pick a decision that gets made every week: how much to replenish a store, which route to run, how many people to schedule.
Find the data that should inform it, and trace the path from where that data is captured to the person making the decision.
Count the steps, and count the days.
If the path exists and takes an hour, you have a working loop and your problem is genuinely the analysis; if it takes a week or ends in a report nobody opens, no amount of modelling changes anything.
Most companies I have worked with discover they are in the second case, and they are usually surprised, because the reporting looks healthy from where they sit.
Conclusion
Supply chain analytics is not a set of tools, it is whether the information your stores already produce ever travels back to change what gets made and shipped.
What we covered in this article
The definition and the two flows, then the four types with the question each one answers and a case study for each.
The return path that most companies never complete, the three skills, and the one-week test to run on your own operation.
Where to go next
The four types deserve a closer look, because choosing the wrong one is the most common failure I see and it happens in the first meeting, and the video above walks through each with an example.
If you would rather practise than read, the Supply Science App has a quiz on exactly this: pick a decision and name the type.
Related videos
The videos behind this article, already on the channel:
- How to start learning Supply Chain Analytics?
- What is a Supply Chain Control Tower?
- 5 Smart Visualisations for Supply Chain Analytics (Source Code)
- Every blame the others for the delay: Our AI found the root cause
The ones coming next, with the date each goes public:
- How To Find Your Business Bottleneck With Python, 16 September 2026
- What is Supply Chain Optimisation? A Practical Case Study, 28 September 2026
- Build a Supply Chain Model in Python: A Step-by-Step Guide, 14 October 2026
- 4 Charts That Get Your Supply Chain Analysis Read, 23 November 2026
About Me
Let's connect on LinkedIn and Twitter. I am a Supply Chain Engineer who is using data analytics to improve logistics operations and reduce costs.