
What Is a Supply Chain Digital Twin? Definition, Building Blocks, and the One I Run 24/7
What a supply chain digital twin is, the four building blocks with Python examples, the live simulation I run 24/7, and what a twin is for and what it is not.
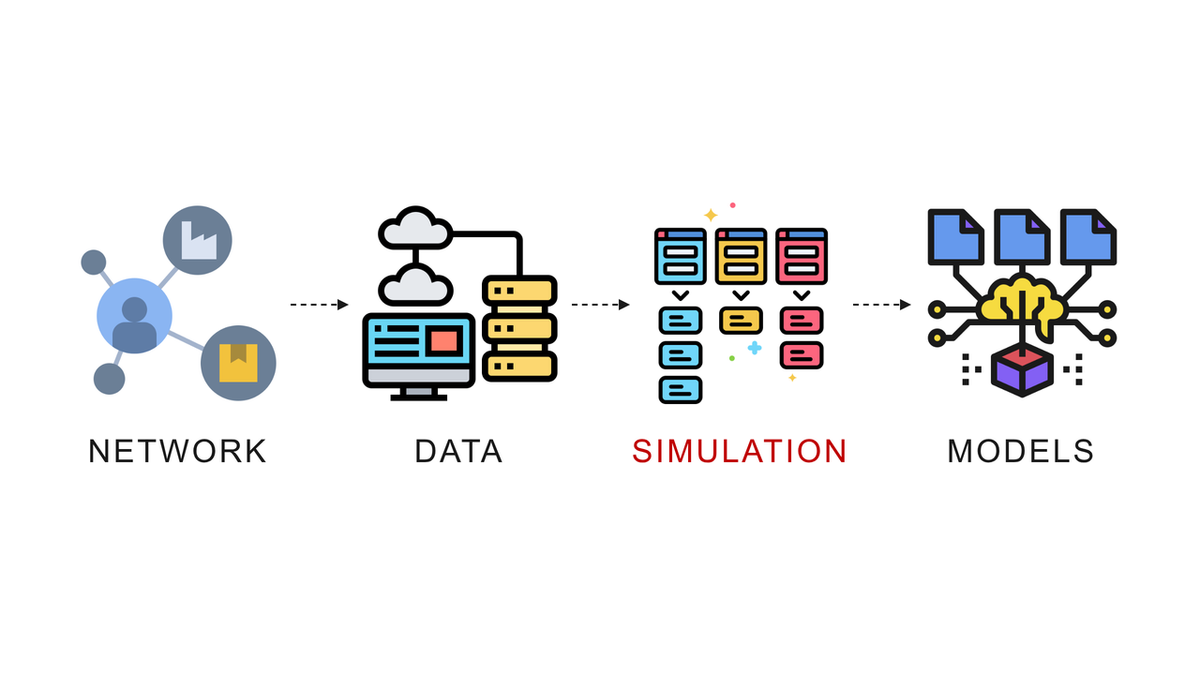
A digital twin is a digital replica of a physical system.
A supply chain digital twin is a model that represents the warehouses, the transport lanes, the production sites and the stores of an operation, connected to the data those places produce.
The definition is easy, and the useful question is what you can do with one that you cannot do with a dashboard.
The answer is that a dashboard shows you what happened, and a twin lets you ask what would happen.
If a flight is missed, if a warehouse is added, if demand doubles in one region, if a team's cut-off moves by an hour.
I built my first one in Python in 2022 as a set of classes.
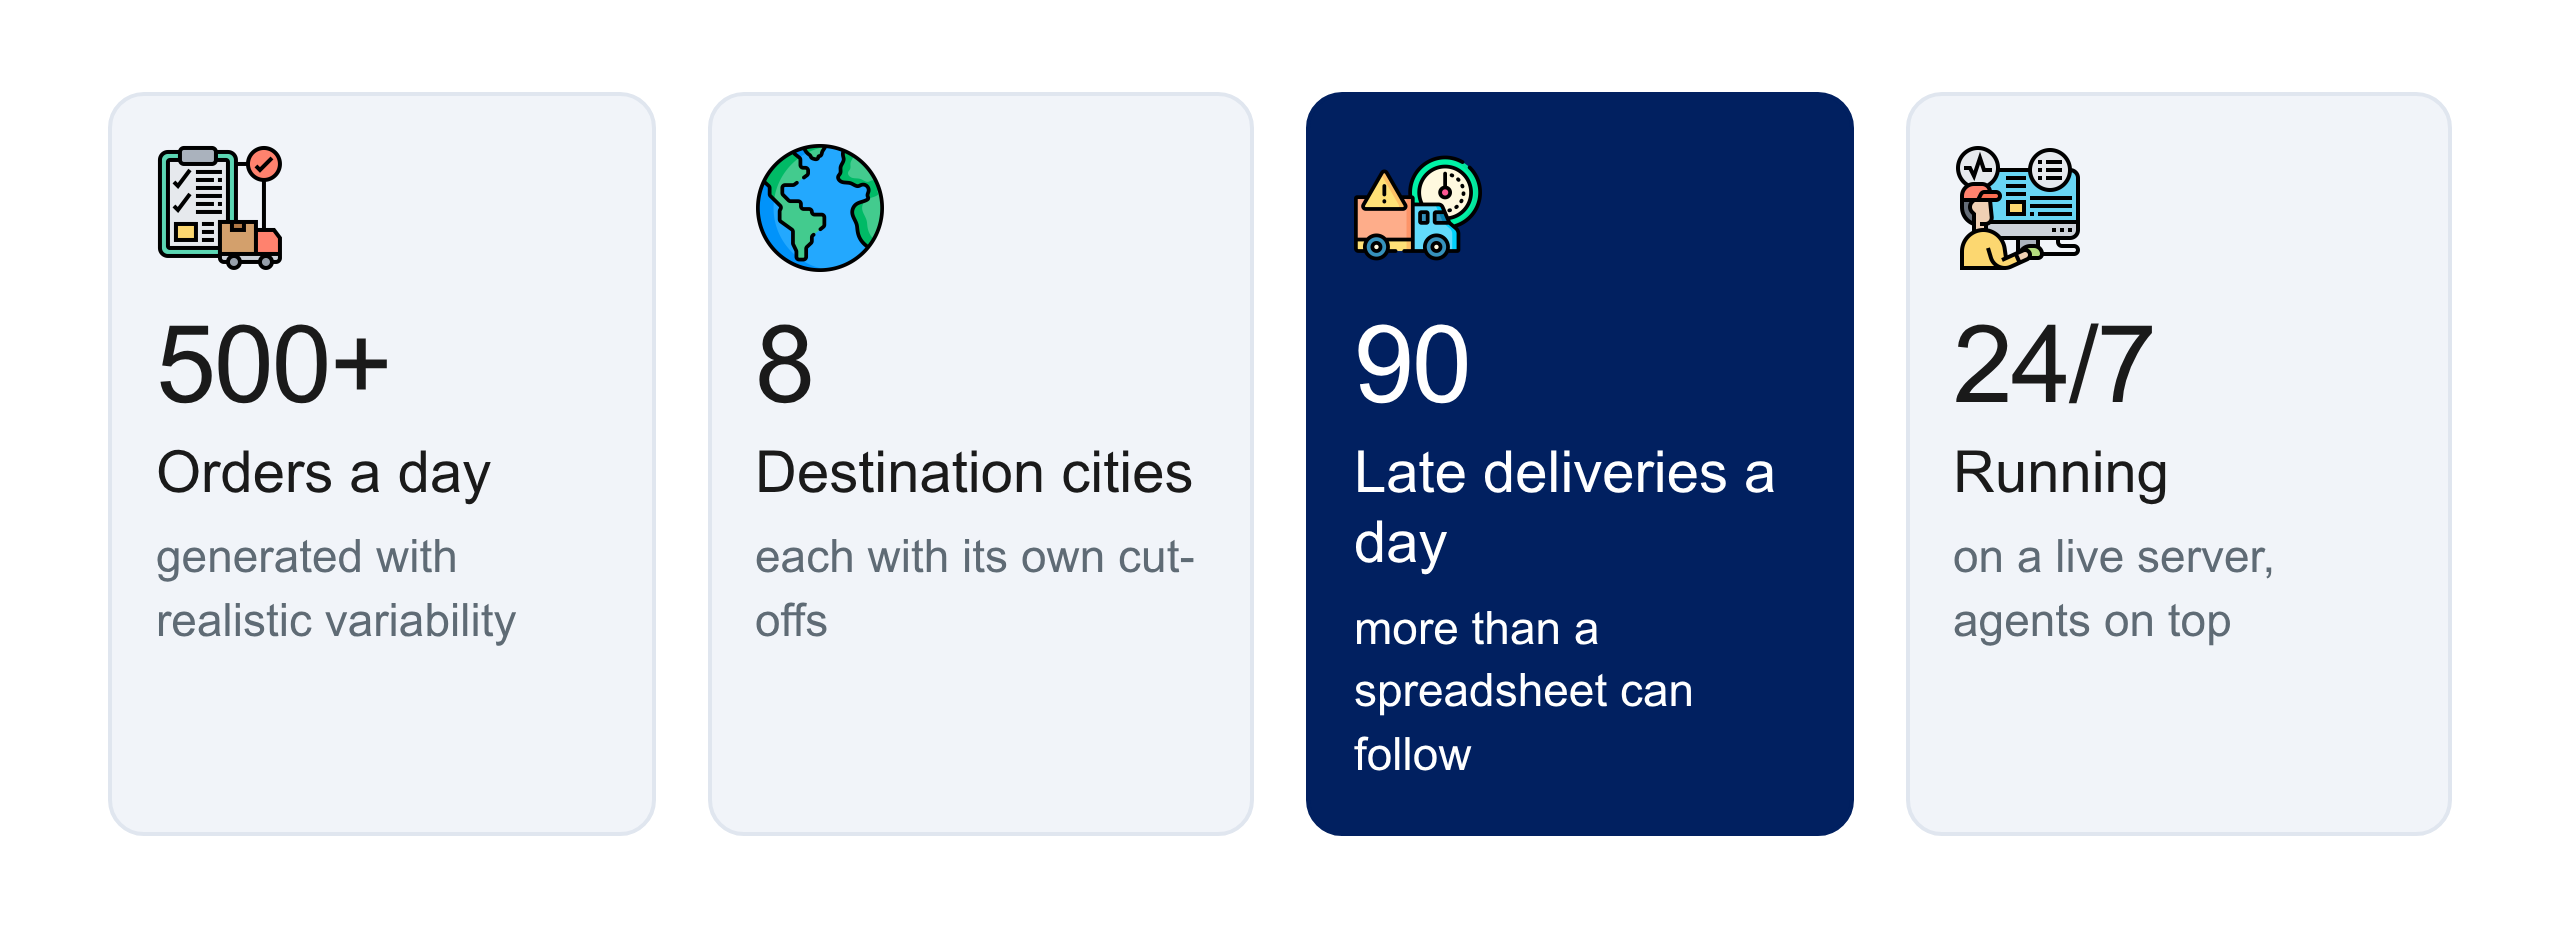
I now run one on a live server that generates more than 500 orders a day with realistic variability at every step, so that AI agents can be tested against it before they meet a real operation.
In this article, I will define the supply chain digital twin, describe its four building blocks with Python examples, walk through the live simulation I run, and explain what a twin is for and what it is not.
The scenario: a luxury retailer's distribution chain
Take a luxury goods company shipping from a warehouse in Milan to 67 stores worldwide, through a chain where every team depends on the one before it.
An order is created, transmitted to the warehouse, picked and packed, loaded on a truck, flown, cleared through customs, trucked to the city and delivered to the store: eight steps owned by four different teams.
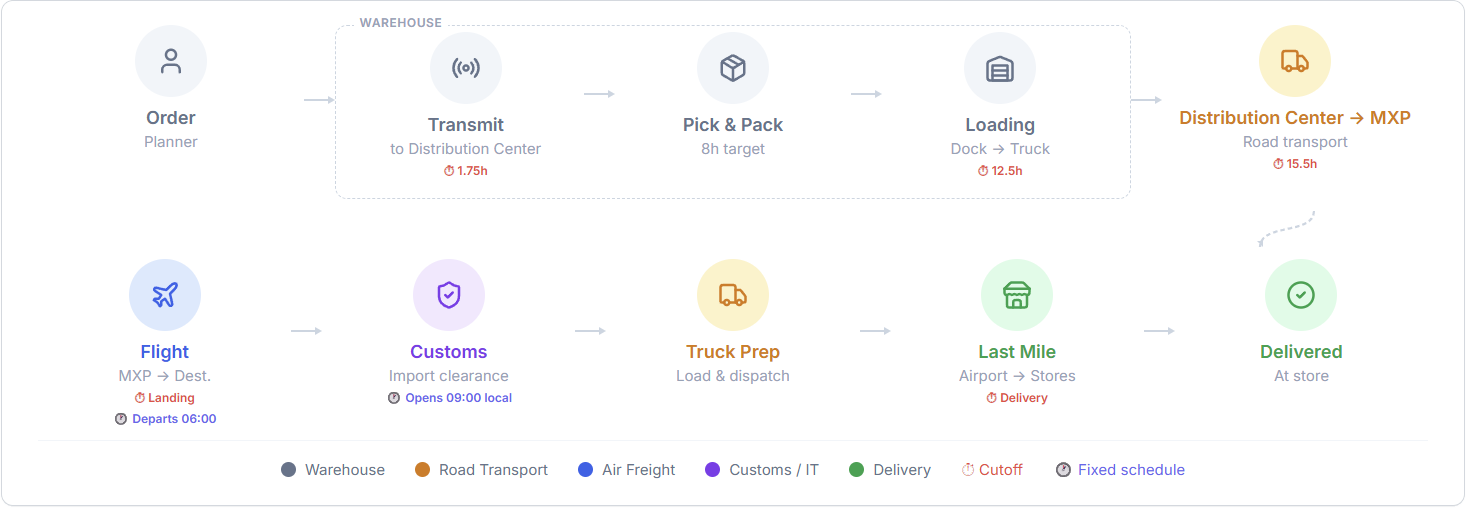
When the logistics director asks why 18% of shipments arrive late while every team reports being on time, the answer lives in the interaction between the steps, and no single team's report can show it.
That is the question a digital twin exists to answer, because the twin holds all eight steps in one model.
What a supply chain digital twin is made of
1. The network: the objects and their relationships
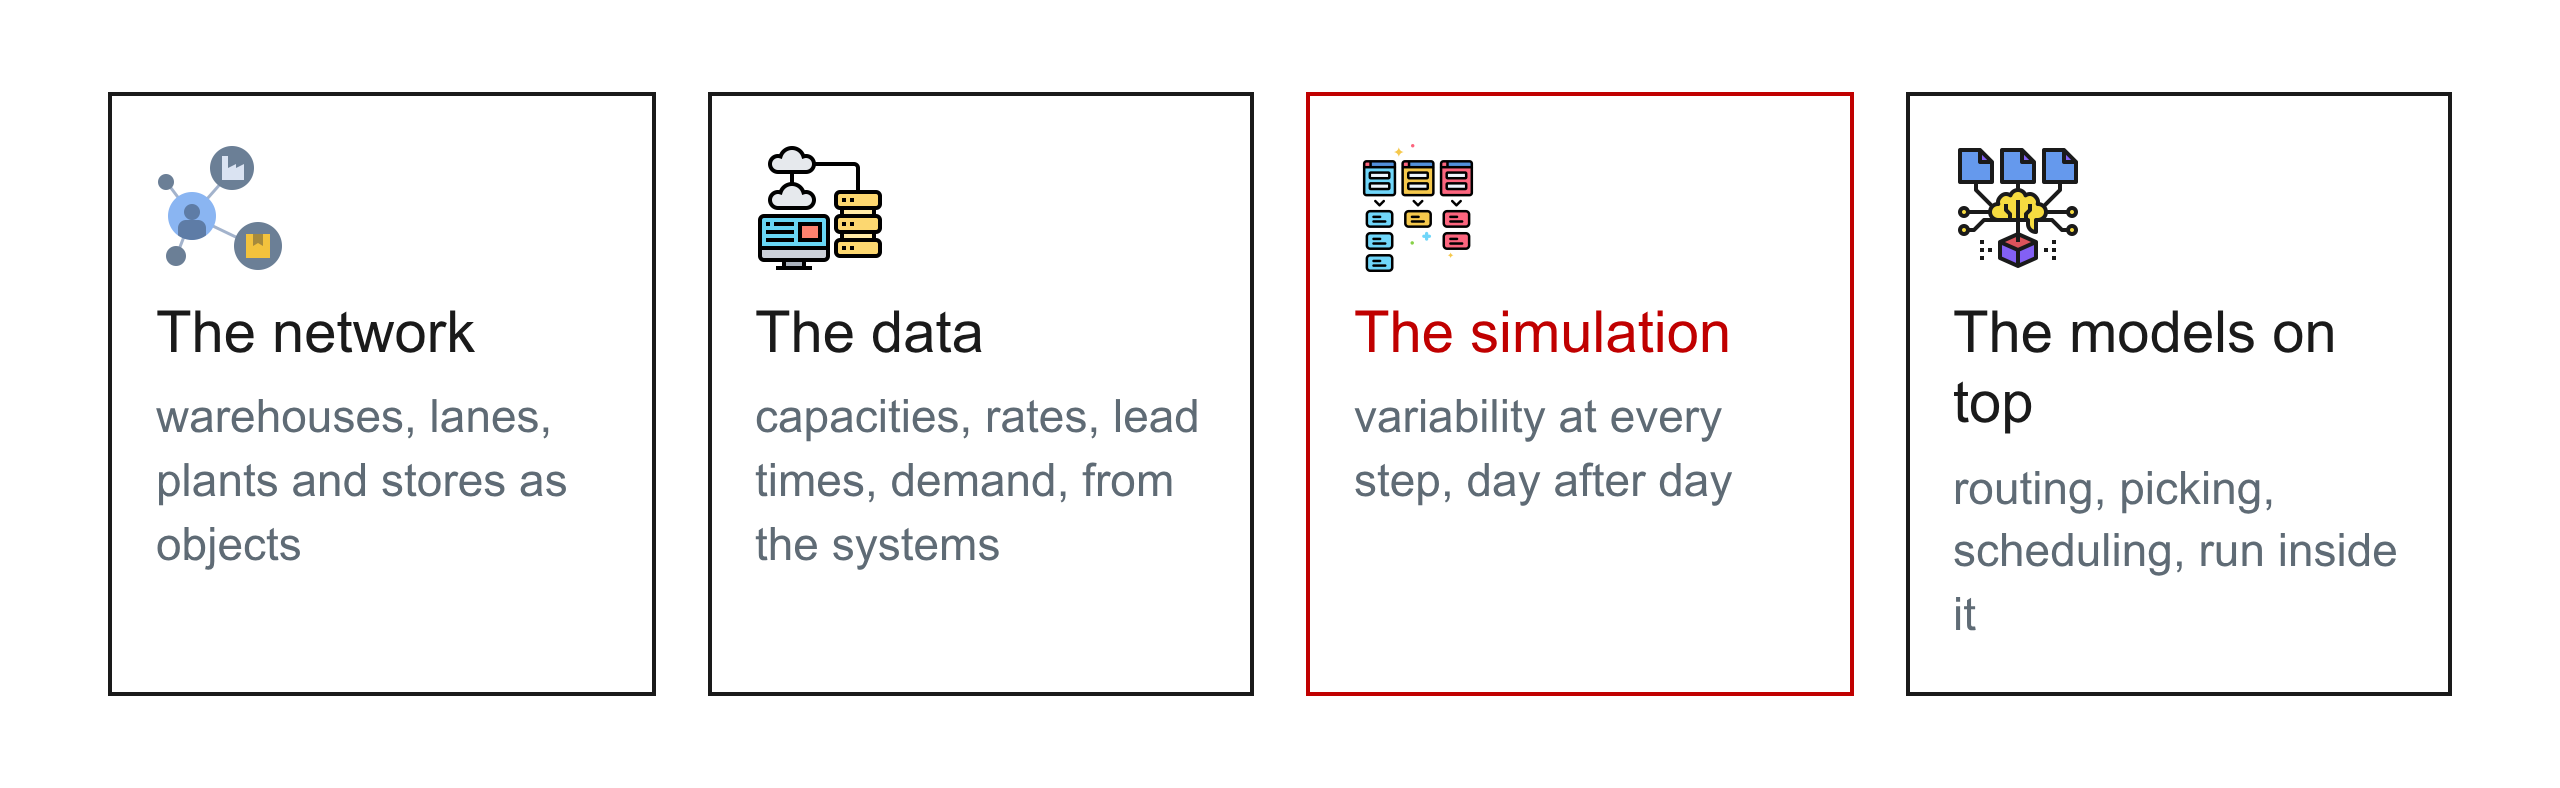
A supply chain is a goal-oriented network of processes and stock points, and the first block of a twin is a data structure for each.
A warehouse with a location, a capacity and an inventory, a lane with a lead time and a cost, a store with a demand.
In Python that starts as classes with methods, a warehouse that can add and remove inventory, a lane that moves a shipment forward by its lead time, and the relationships between them.
2. The data and the parameters
The second block is what the model reads: the locations and capacities of the warehouses, the routes and capacities of the lanes, the production rates of the plants, and the demand of the stores.
In a real deployment that data comes from the systems that already hold it: the WMS for the warehouse, the TMS for the transport events, the ERP for the orders.
The twin is only as good as the quality of those extracts.
3. The simulation: variability at every step
The third block is what makes it a twin rather than a diagram.
Each step takes a variable time, each cut-off is missed some fraction of the time, and the model runs forward day after day producing the same timestamps a real chain would.
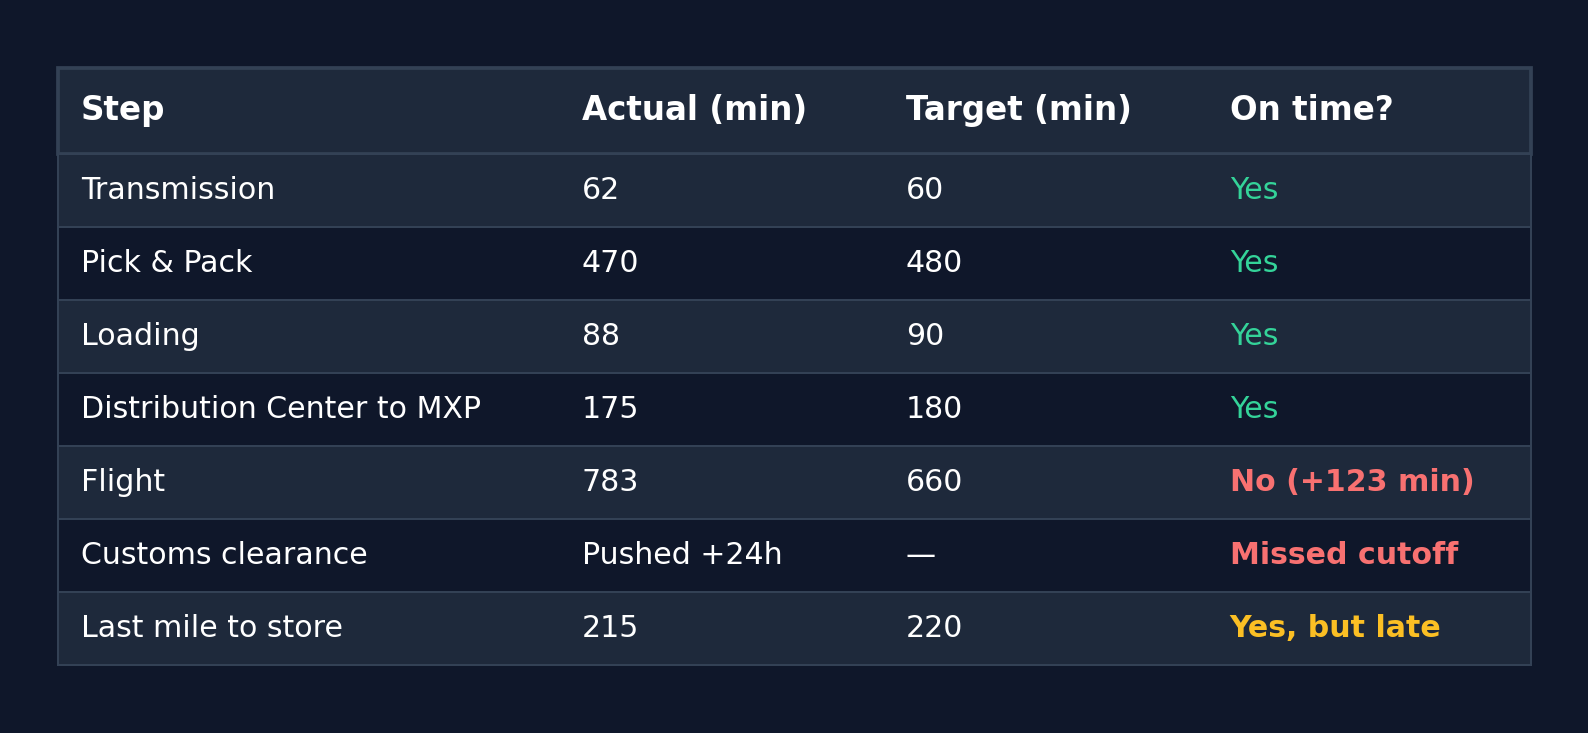
This is where the lead time variability work matters, because a twin that assumes every lead time equals its target is a very confident model of a chain that does not exist.
4. The models that sit on top
The fourth block is the analytics that consume the twin: route optimisation for the deliveries, picking improvements inside the warehouse, production scheduling from the demand, each one taking the twin's output as its input.
The twin is the environment. The optimisation models are what you run inside it.
The one I run on a live server
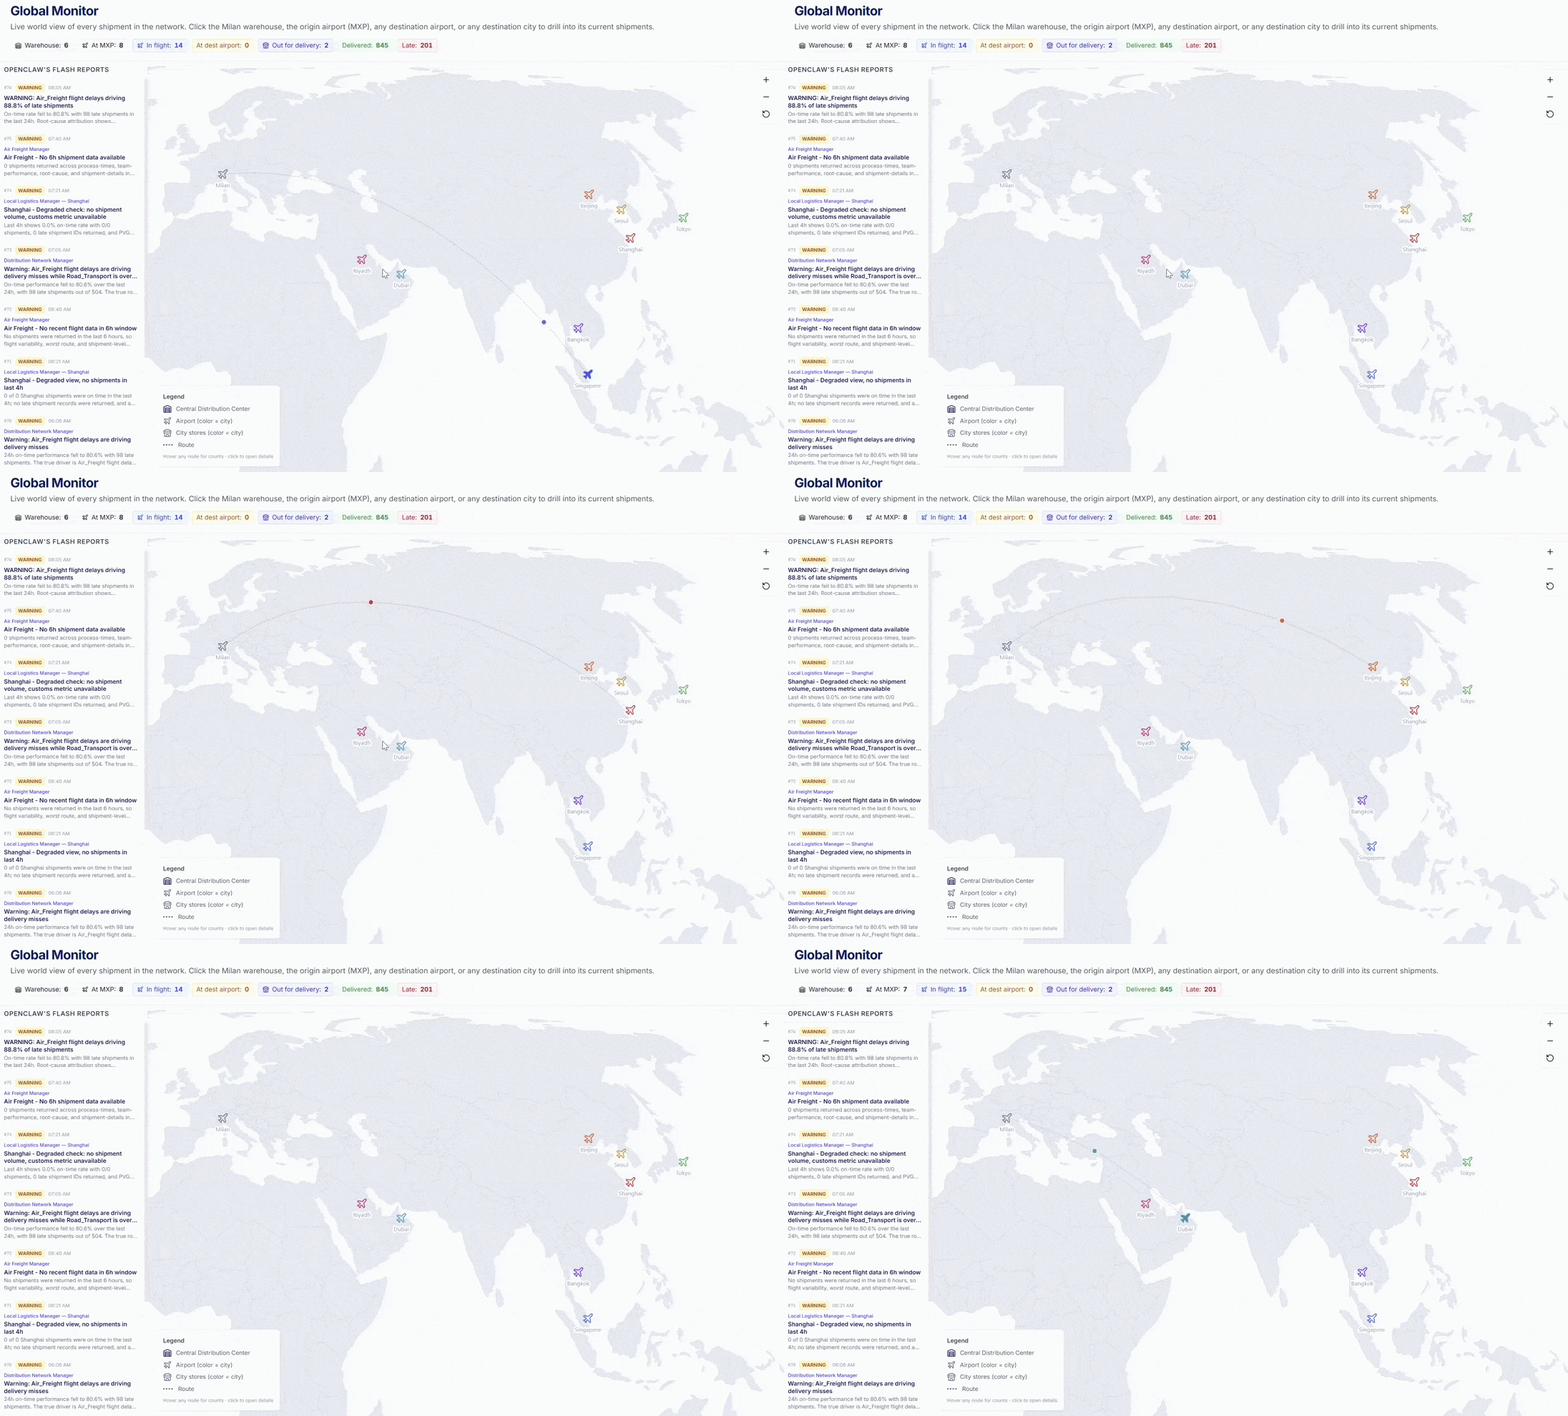
I built a twin of that luxury distribution chain and left it running 24/7 on a server.
It generates more than 500 orders a day across 8 destination cities, with process variability and delays that produce the same cascade patterns the real chain shows.
On a Tuesday morning there were four shipments flying to Changi airport, and the Shanghai shipments had missed the previous day's flight and were going to arrive two days late.
That is exactly the kind of sentence a twin can produce and a monthly report cannot.
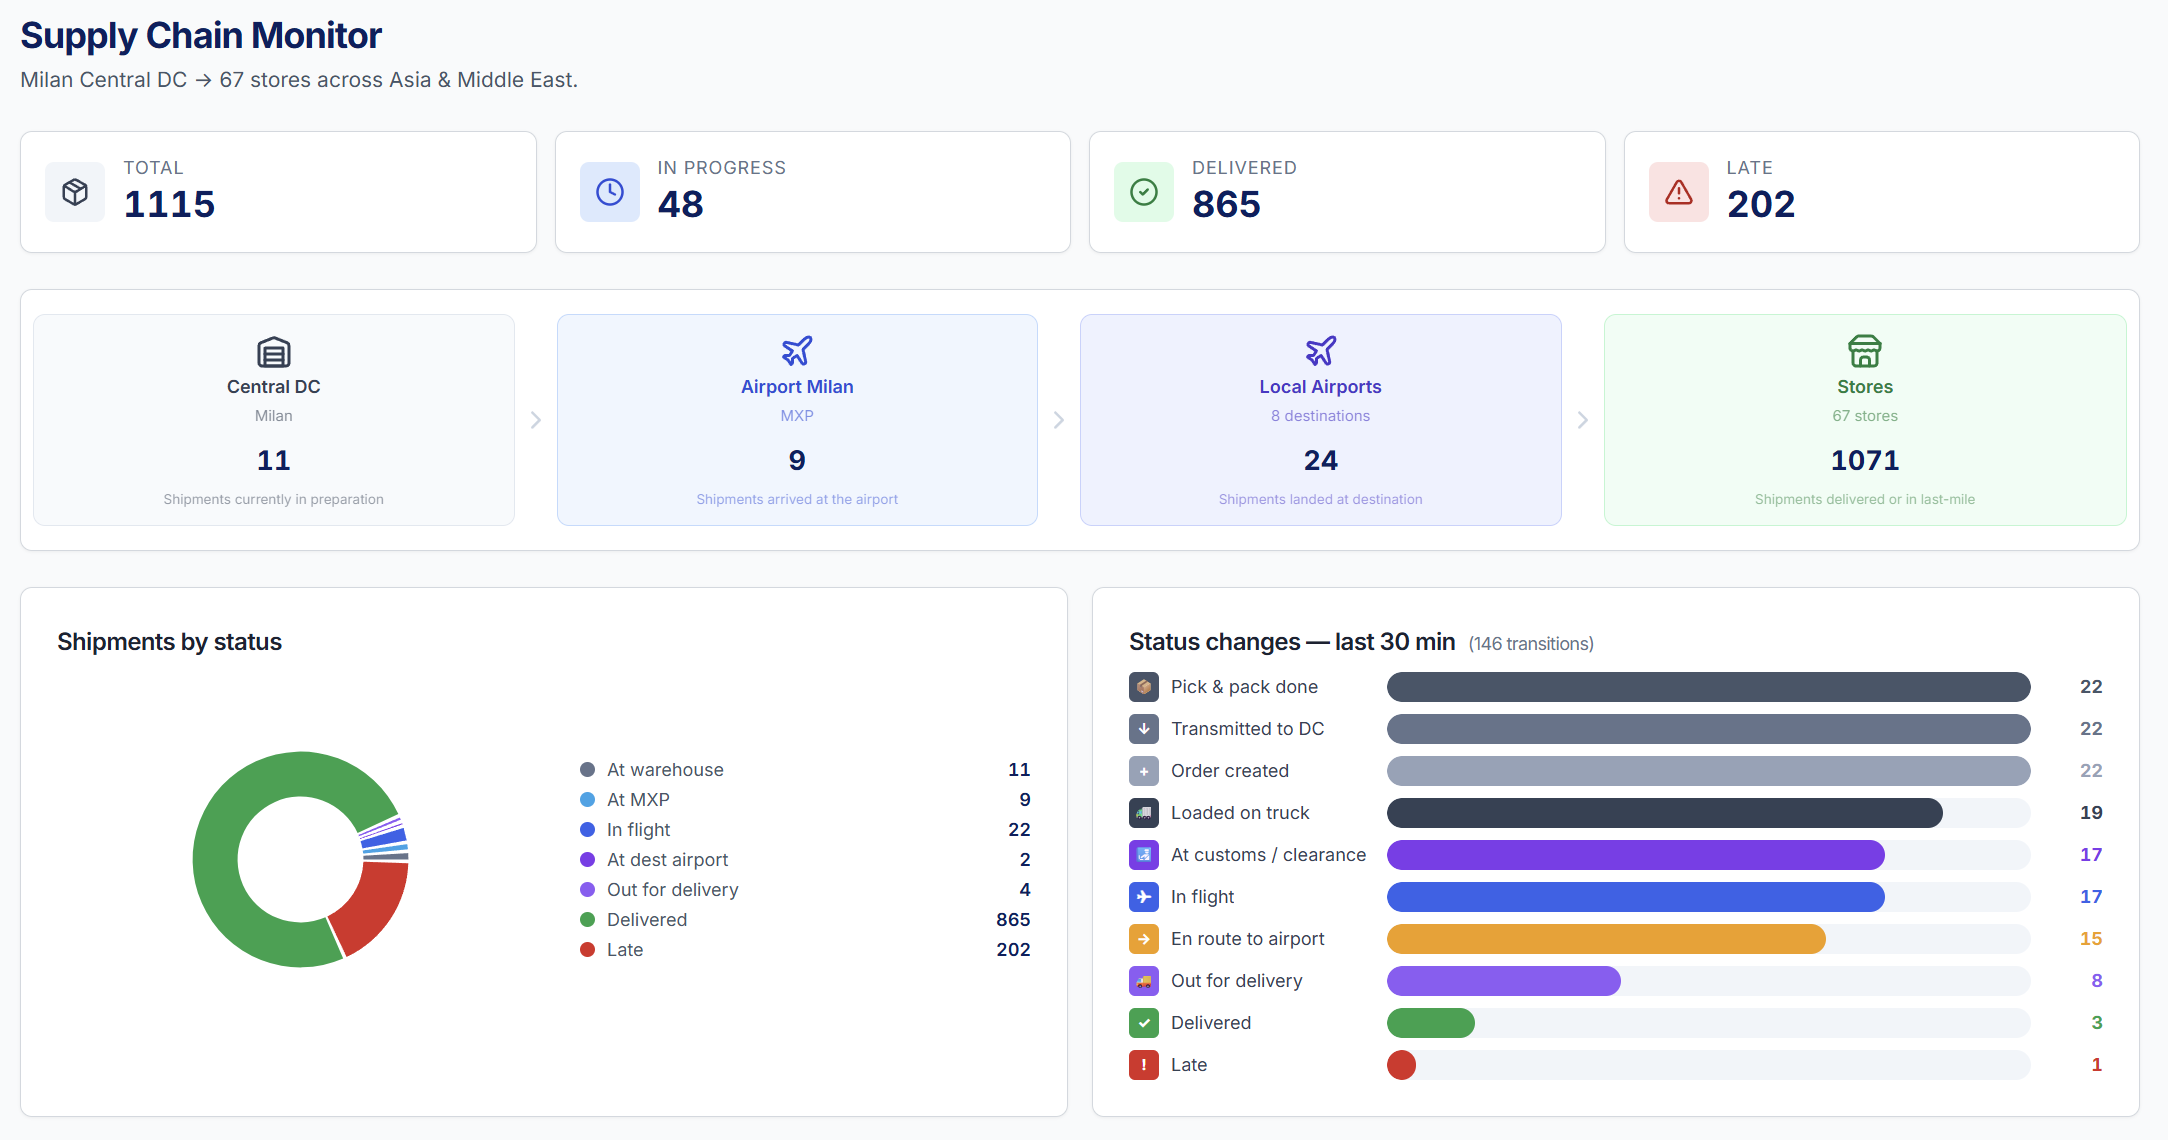
The reason I built it was not the simulation itself, it was what I could put on top.
A team of AI agents monitoring the chain, each with a scope of responsibility, running an investigation every hour and posting alerts to the teams.
Testing an agent against a twin before it meets a real operation is the safest way I know to find out whether it can explain a 45-hour delay to a store in Shanghai.
And the twin made the Monday review meeting twenty minutes rather than two hours.
What a twin is for, and what it is not
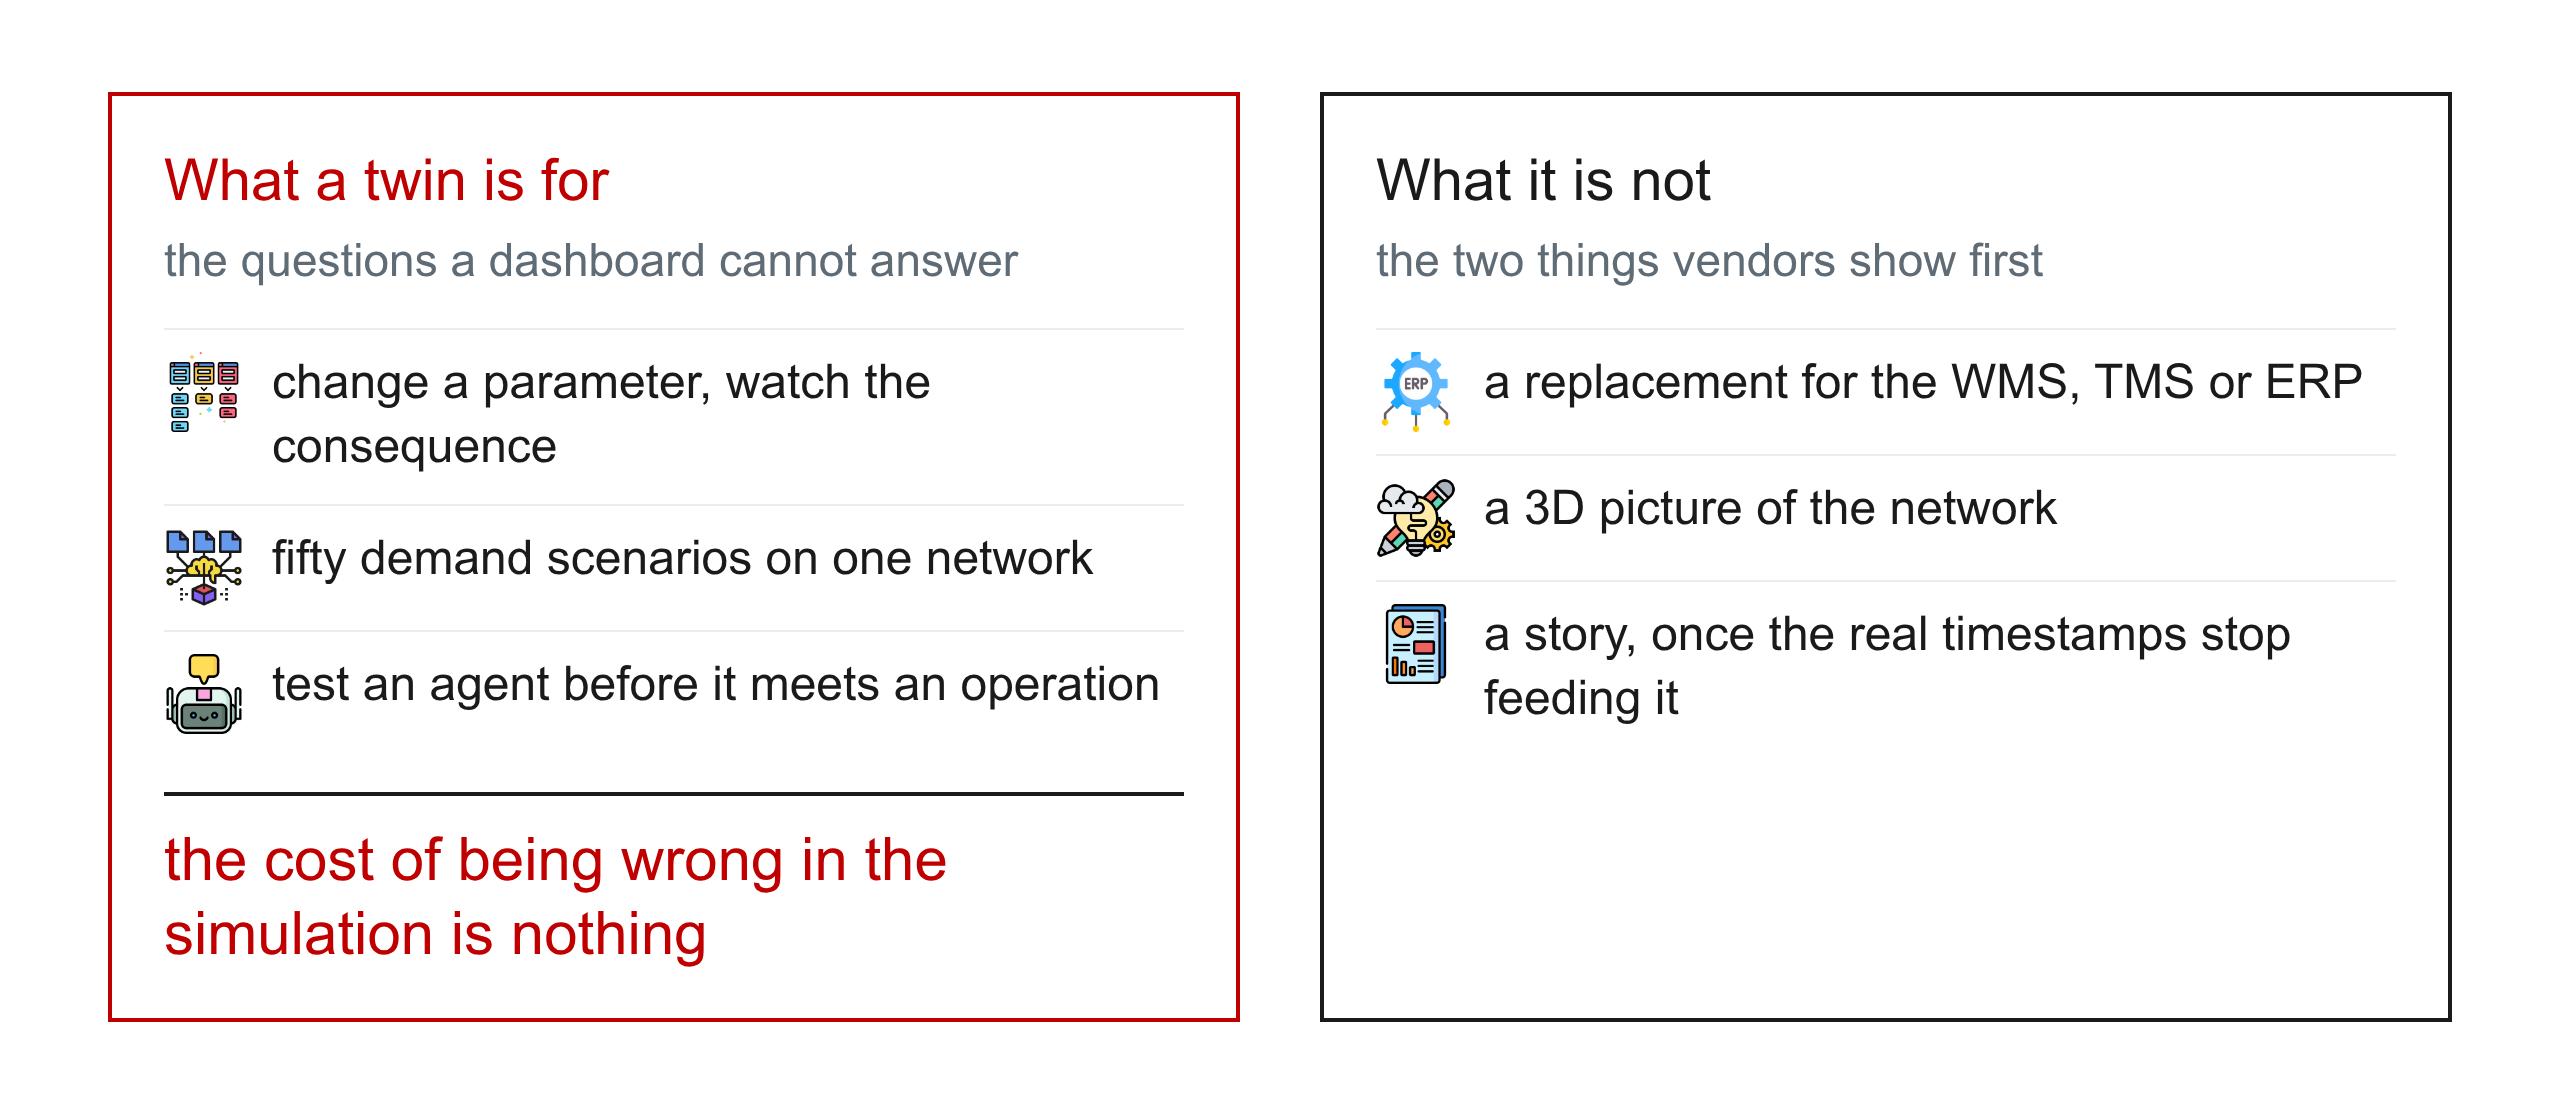
It is for the questions a dashboard cannot answer
A dashboard reports; a twin lets you change a parameter and watch the consequence.
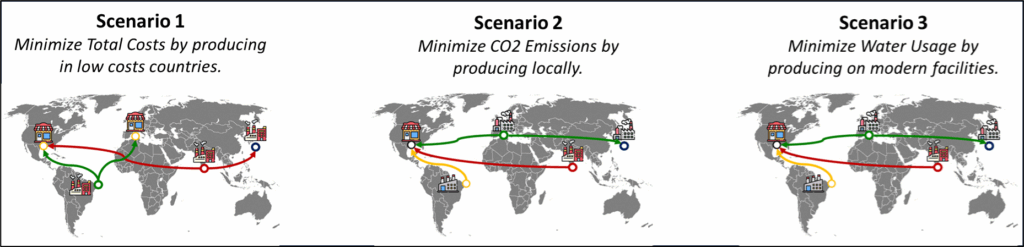
The Monte Carlo network study is a twin used that way: the same network design run across fifty demand scenarios.
The footprint chosen is the one that keeps coming back rather than the one that was cheapest on a single forecast.
It is for testing before deploying
Every agent and every optimisation I now put into an operation runs against the twin first, because the cost of being wrong in the simulation is nothing and the cost of being wrong in a warehouse is a customer.
It is not a replacement for the systems
A twin reads from the WMS, the TMS and the ERP, and it never replaces them, because the moment it stops being fed by the real timestamps it stops being a twin and becomes a story.
It is also not a 3D visualisation, which is the thing most vendors show first, because the value is in the model that runs, not in the picture of it.
How to start
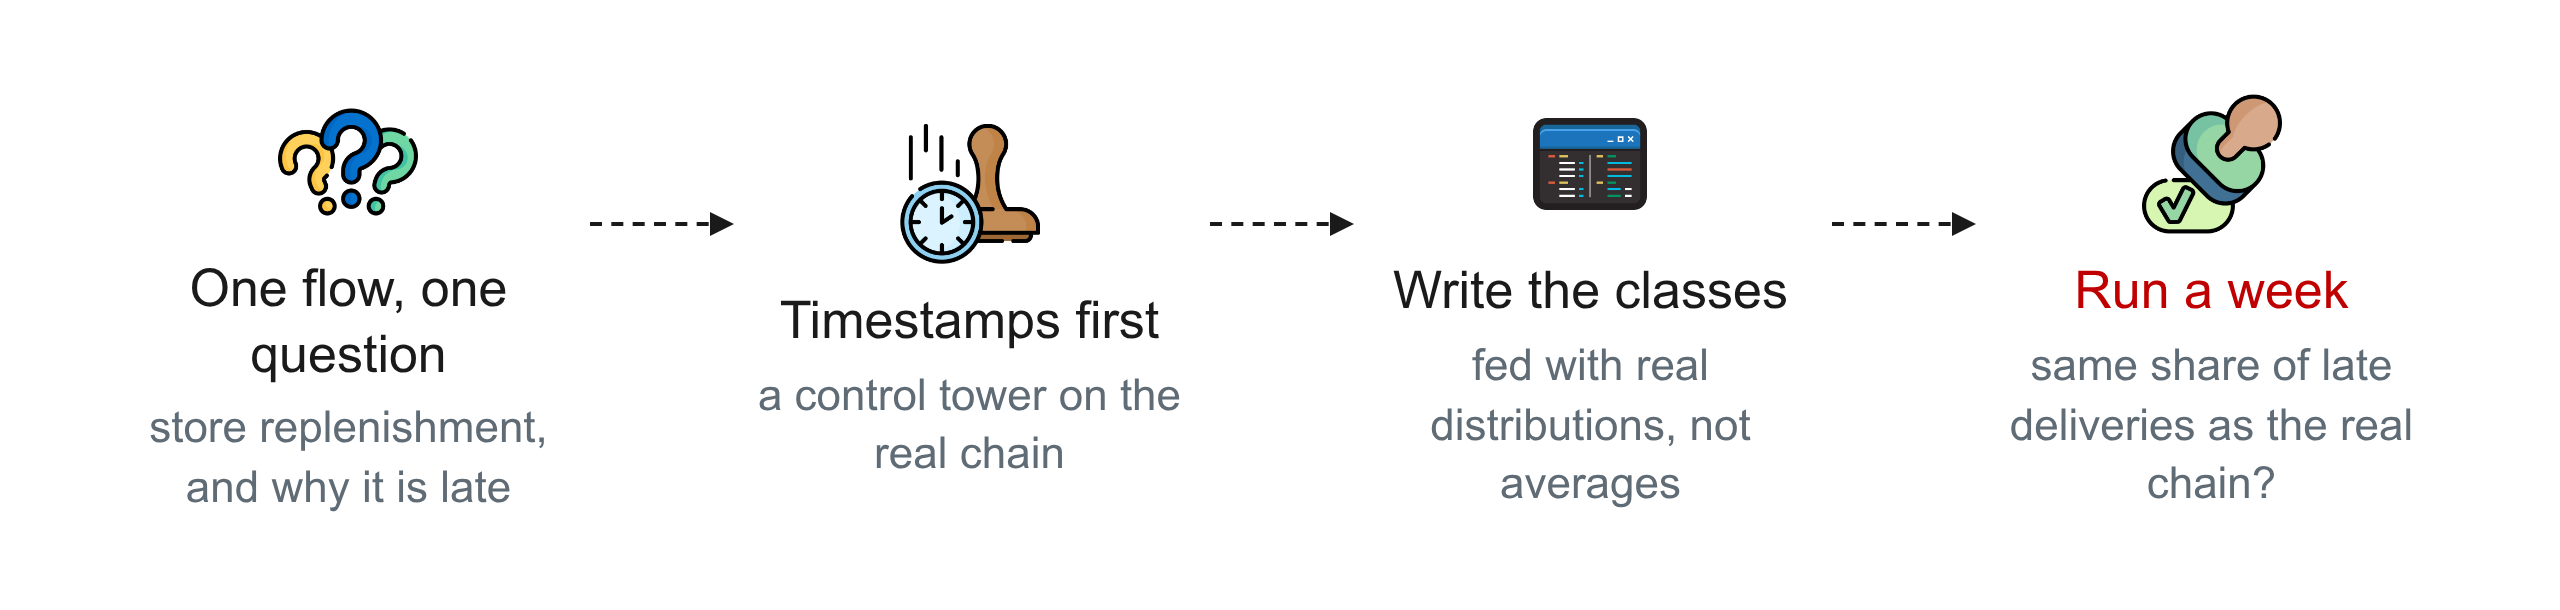
Start with one flow and one question: the store replenishment chain, and why deliveries are late, is the pair I would pick.
Build the timestamps first, because a control tower that records every step of the real chain is the data the twin will be calibrated against, and without it you are guessing the variability.
Then write the classes, feed them the real distribution of each step's lead time rather than its average, and run a week of orders through it.
If the twin produces the same share of late deliveries as the real chain, you have a model you can start asking questions of.
Conclusion
A supply chain digital twin is the network as a model that runs on its own data, and its value is in the questions you can put to it that a report cannot answer.
What we covered in this article
The definition, the four building blocks, the live simulation generating 500 orders a day across 8 cities, what a twin is for and what it is not, and how to start with one flow and one question.
Where to go next
The full story of the agents that monitor the live twin is in I simulated an international supply chain and let OpenClaw monitor it, and the data model underneath every twin is explained in what supply chain analytics is.
Related videos
The videos behind this article, already on the channel:
- The Ultimate Guide to Building a Supply Chain Digital Twin with OpenClaw
- Every blame the others for the delay: Our AI found the root cause
- What is a Supply Chain Control Tower?
- Analyze Supply Chain Risks with Python
- Understand Why Your Carriers Miss Deliveries
The ones coming next, with the date each goes public:
- Build a Supply Chain Model in Python: A Step-by-Step Guide, 14 October 2026
- One Line With Two Stations, or Two Lines? (Queueing Theory), 4 November 2026
- How to Stress-Test a Supply Chain Network (Monte Carlo), 9 November 2026
About Me
Let's connect on LinkedIn and Twitter. I am a Supply Chain Engineer who is using data analytics to improve logistics operations and reduce costs.