What Is Data Quality?
Discover Methodologies to Ensure Accuracy, Consistency and Completeness of Supply Chain Data.
Data Quality defines how data sets can be trusted, understood and utilized effectively for their intended purpose.
In Supply Chain Management, data plays a crucial role in detecting issues and making informed decisions.

Ensuring that data is accurate, consistent and fit for its intended purpose is a critical task to ensure smooth and efficient operational management.
In this article, we will delve into the concept of data quality by exploring its dimensions and understanding its importance in the context of supply chain management.
I. The Pillars of Data Management
1. Why is it key?
2. Quality vs. Integrity vs. Profiling
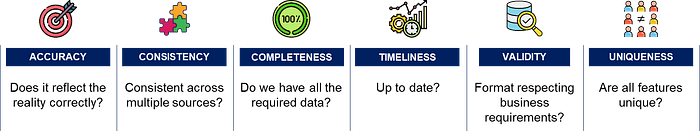
II. Dimensions of Data Quality
1. Completeness: do we have all the data?
2. Uniqueness: are features all unique?
3. Validity: is the format respecting business requirements?
4. Timeliness: up-to-date data
5. Accuracy: does it reflect reality correctly?
III. Why is Business Intelligence Significant?
1. What is the environmental impact of your operations?
2. Become a data-driven green organization
IV. Conclusion
The Pillars of Data Management
Why is it key?
High-quality data can be the difference between the success and failure of your supply chain operations.
From planning and forecasting to procurement and logistics, every facet of supply chain management relies on data to function effectively.
- Planning and forecasting algorithms rely on WMS and ERP data for historical sales, inventory levels and store orders
- Transportation Management Systems rely on WMS data to properly track shipments from warehouses to stores

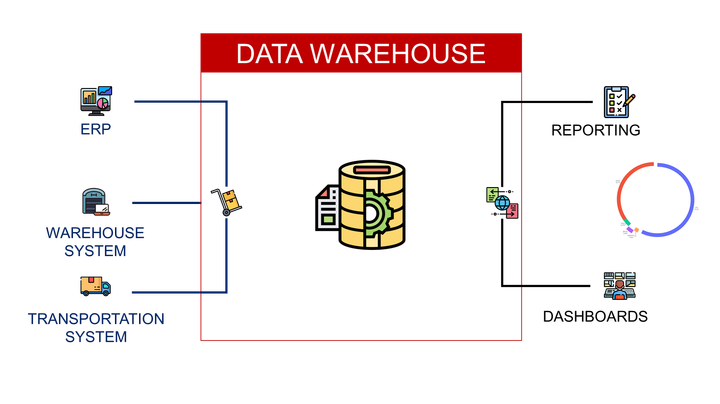
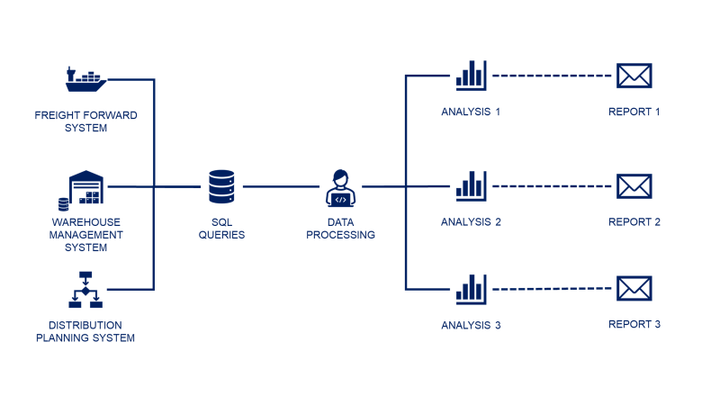
Supply Chain Analytics solutions can be divided into four types that provide different levels of insights and visibility.
Descriptive solutions represent usually the first step in your digital transformation: collecting, processing and visualizing data.
It all starts with data collection and processing to analyse your past performance.
Let us take the example of the store distribution process of a fashion retail company.
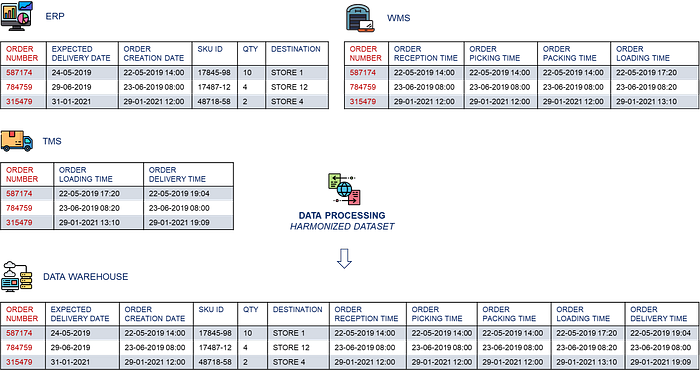
A simple indicator to pilot your operations is the percentage of orders delivered on time: On Time In Full: OTIF.
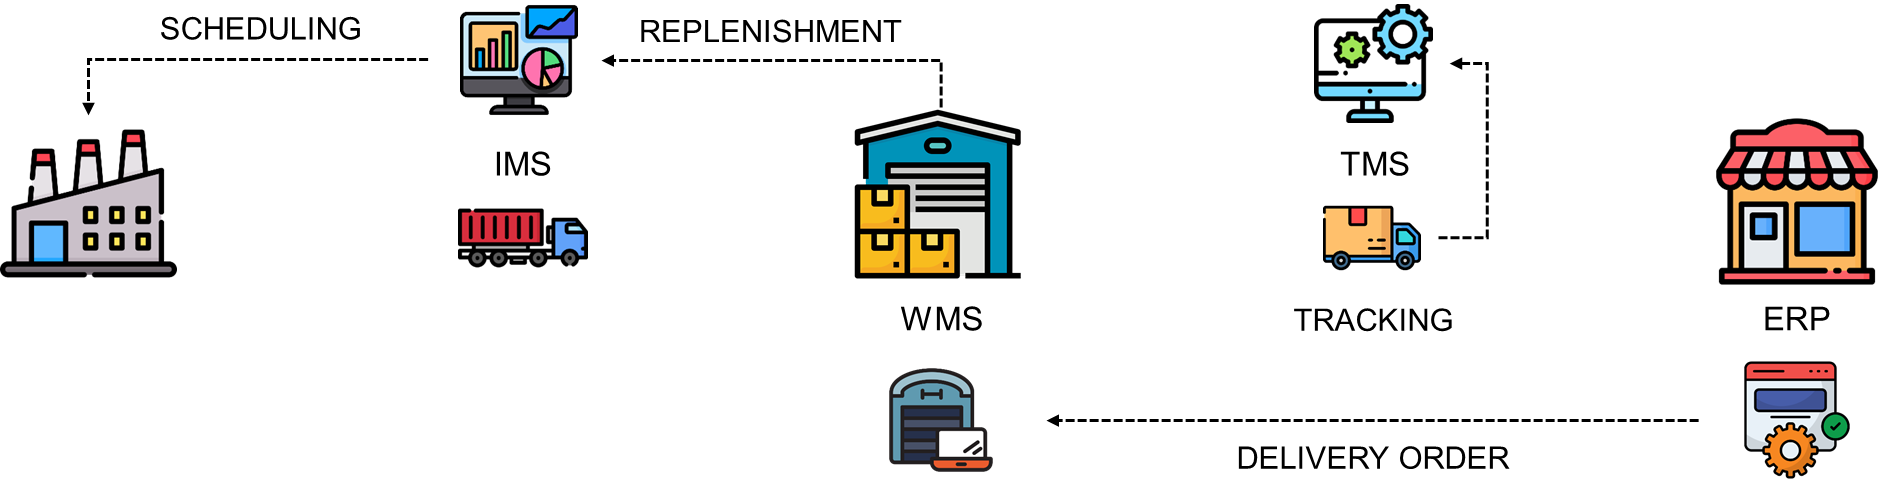
This indicator can be built by merging transactional tables from
- Enterprise Resource Planning (ERP) for order creation
- Warehouse Management Systems (WMS) for order preparation
- Transportation Management Systems (TMS) for order delivery
If you don’t ensure that the data is correct, it is impossible to
- Measure the actual performance of On-Time Delivery
- Implement an automated diagnostic by comparing actual time stamps with their target
An indicator that you cannot measure with confidence cannot be analysed and improved.
Quality vs. Integrity vs. Profiling
Before we delve into data quality, it is essential to understand how data quality differs from related concepts like data integrity or data profiling.
While all three are interconnected, they have distinct areas of focus
- Data integrity is concerned with maintaining the accuracy and consistency of data over its entire life cycle.
- Data profiling involves the process of examining and cleaning data to maintain its quality.
Data profiling should not be mixed with data mining.
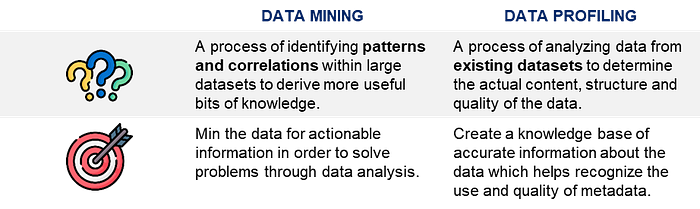
- Data profiling will focus on the structure and the quality of data looking at outliers, distribution or missing values
- Data mining focuses on extracting business and operational insights from the data to support decision-making or continuous improvement initiatives
Now that we have clarified these differences, we can focus on defining what is data quality.
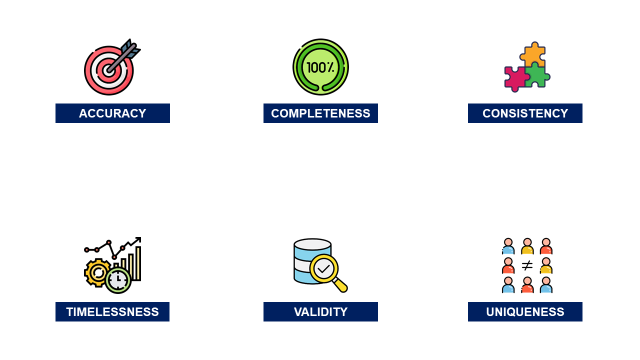
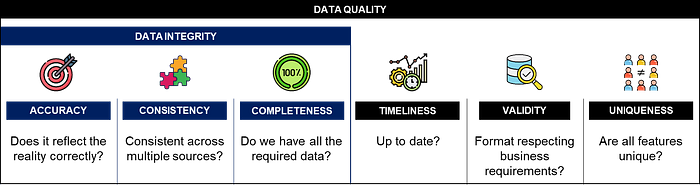
Dimensions of Data Quality
Data quality is evaluated based on several dimensions that play a crucial role in maintaining the reliability and usability of data.
Completeness: Do we have all the data?
The objective is to ensure that all necessary data are present.
Missing data can lead to misleading analyses and poor decision-making.
Example: missing records in the master data
In a company, Master Data Management (MDM) is a crucial aspect of ensuring consistent, accurate and complete data across different departments in a company.
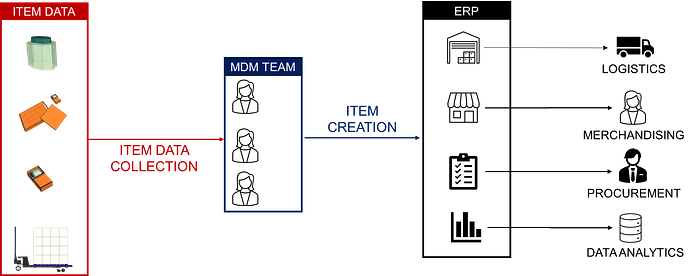
Master data specialists are entering product-related information into the ERP during the item creation process
- Product information: net weight, dimensions, etc.
- Packaging: total weight, dimensions, language, etc.
- Handling units: number of items per (carton, pallets), pallet height
- Merchandising: supplier name, cost of purchase, pricing per market
These data specialists can make mistakes, and missing data can be found in the master data.
❓ What kind of issues can we face with missing data?
- Missing net weight: issues linked to transportation management, as we need the weight for invoicing and customs clearance
- Missing costs: your procurement cannot send purchase orders to the suppliers
And many other issues along the value chain, from raw materials sourcing to store delivery.
💡 How can we check it?
- Null Value Analysis: identify and count the number of null or missing values in your dataset
- Domain-Specific Checks: Confirm that all expected data categories are present.
For instance, if a column is supposed to contain five distinct categories and only four appear. This would indicate a lack of completeness. - Record Counting: comparing the number of records in a dataset with the expected number of records
- External Source Comparison: Use external data sources that are known to be complete as a benchmark
Uniqueness: Are the features all unique?
The objective is to ensure that each data entry is distinct and not duplicated.
In fine, we want to provide an accurate representation of the data landscape.
Example: transport shipments used for CO2 reporting
The demand for transparency in sustainable development from investors and customers has grown over the years.
Therefore, companies are investing in analytics solutions to assess their environmental footprint.
The first step is to measure the CO2 emissions of their transportation network.
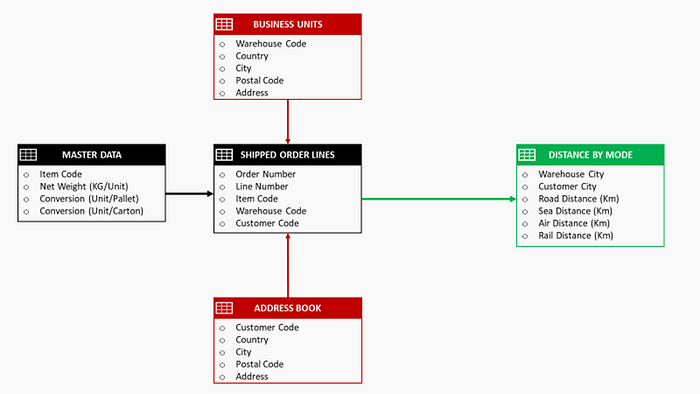
Shipment records and master data records are extracted from the ERP and the WMS.
They cover the scope of orders shipped from your warehouses to stores or end customers.
❓ What kind of issues can we face with duplicated data?
If we have duplicated shipment records, we may overestimate the CO2 emissions of transportation as may count emissions several times.
💡 How can we check it?
- Duplicate Record Identification: with Python’s Pandas or SQL using functionalities that identify duplicate records
- Key Constraint Analysis: verifying that the primary keys of your database are unique
Validity: Does the format respect business requirements?
The objective is to verify that data conforms to the required formats and business rules.
Example: Life Cycle Assessment
As a method of evaluating the environmental impacts of a product or service over its entire life cycle, Life cycle assessment (LCA) is heavily relying on data quality.
In the example below, we collect data from different sources to estimate the usage of utilities and natural resources to produce and deliver T-shirts.
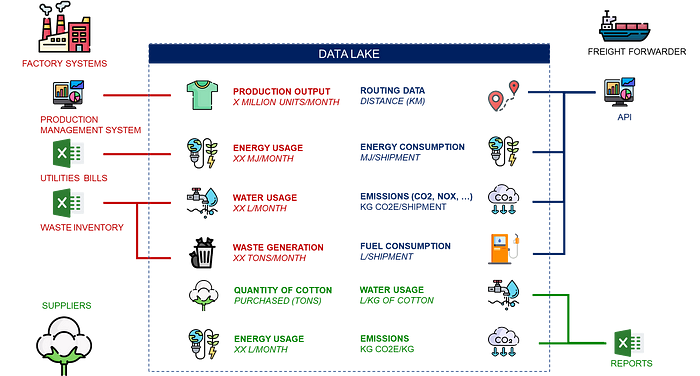
- Production Management System provides the number of t-shirts per period of time
- Waste inventory, utilities and emissions in flat Excel files
- Distance, routing and CO2 emissions from carriers' APIs
The final result, the overall environmental footprint of a t-shirt, depends on the reliability of each of the data sources.
❓ What kind of issues can we face with invalid data?
- If fuel consumption is reported in (L/Shipment) for some records and (Gallons/Shipment) for others, the total evaluation will be incorrect.
- If you don’t ensure that all utilities consumptions are by month you cannot evaluate the consumption per unit produced.
💡 How can we check it?
- Data Type Checks: Each field in your data is of the expected data type
- Range Checks: compare values with an expected range
- Pattern Matching: for data like emails or phone numbers, you can use regular expressions to match the expected pattern
Timeliness: up-to-date data
The objective is to ensure data is ready within the expected timeframe.
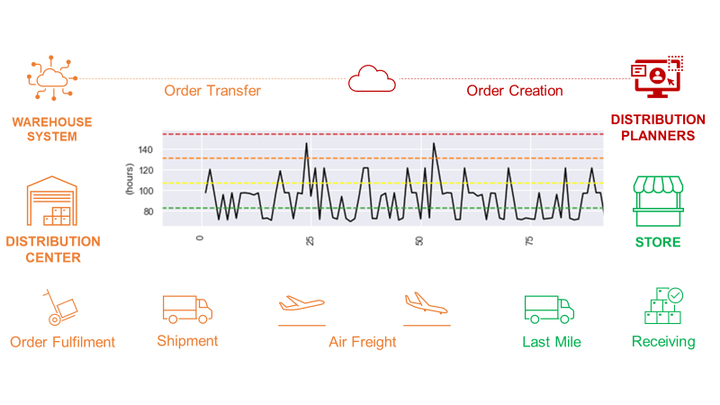
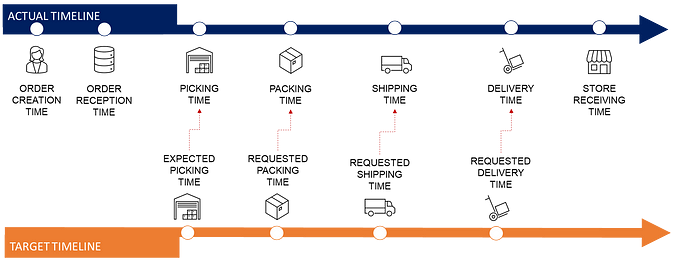
Example: Process Mining
Process mining is a type of analytics focusing on the discovery, monitoring, and improvement of operational and business processes.
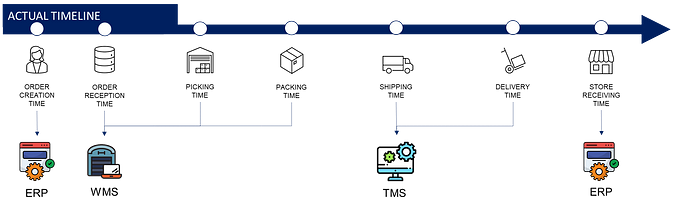
In the example above, we collect status with timestamps (from different systems) at each step of the order-to-delivery process.
❓ What kind of issues can we face if we don’t get the data on time?
- The status may not be updated correctly.
This can create “holes” in the tracking of your shipments
Example: my shipment was delivered at 12:05 am, but the status is still “Packing in progress”) - Incidents may be reported
💡 How can we check it?
- Timestamp Analysis: check that all timestamps fall within the expected time range
- Real-time Data Monitoring: monitor data flow that creates alerts when we have an interruption
Accuracy: Does it reflect reality correctly?
The objective is to ensure the correctness of data values.
This is mandatory to maintain trust in data-driven decisions.
Example: Machine Learning for Retail Sales Forecasting
These are algorithms that use historical sales data records to predict future sales by store and item code for the next X days.
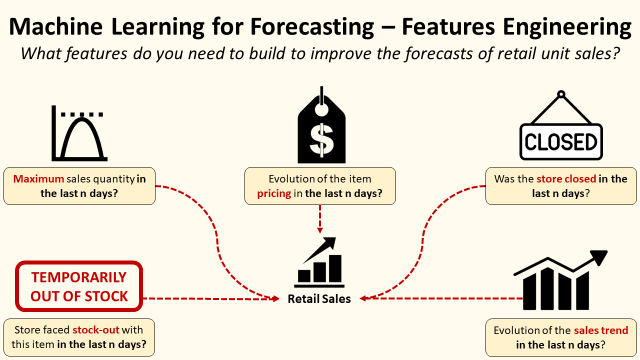
For this kind of business case, data accuracy is way more important than the level of sophistication of your forecasting model (tree-based, deep learning, statistical forecast, …).
❓ What kind of issues can we face with inaccurate data?
- Incorrect historical sales data due to data entry errors or system glitches could impact your model's performance.
- This might lead to overstock or stockouts with financial and commercial implications.
💡 How can we check it?
- Source Validation: cross-verify your data with other authoritative sources to ensure that the information is accurate
- Data Auditing: Periodic auditing of the data can help detect inaccuracies by manually checking a sample of data records for errors
Consistency: Does it reflect reality correctly?
The objective here is to evaluate records across datasets to ensure they exhibit consistent trends and behaviours.
💡 How to enforce it?
- Data Standardization: Enforce strict guidelines for data entry and format to ensure consistency.
- Automated Data Cleansing: Implement automated tools or scripts to clean and standardize data.
- Error Reporting: Establish a robust error reporting and resolution process.
I hope these examples provided enough insight to help you implement data quality checks in your organisation.
Conclusion
If your company is investing in a Supply Chain digital transformation, data quality is no longer a luxury but a necessity.
It should be included in your strategic roadmap to ensure the right level of quality, support informed decision-making, streamline operations, and achieve business goals.
There is no point in investing capital and energy in advanced analytics solutions if you cannot rely on a trusted data source.
About Me
Let’s connect on LinkedIn and Twitter. I am a Supply Chain Engineer using data analytics to improve logistics operations and reduce costs.
If you’re looking for tailored consulting solutions to optimise your supply chain and meet sustainability goals, feel free to contact me.