The Hidden Cost of Walking: How Smart Batching Cuts Warehouse Labour Costs by 20%
When your picking operators spend more time walking than picking, you don't have a productivity problem — you have a routing problem.

In a Distribution Center (DC), walking time from one location to another during the picking route can account for 60% to 70% of the operator's working time.
For a warehouse processing 5,000 order lines per day, that means your team spends the equivalent of 4 to 5 full-time operators just walking, not picking, not packing or adding value.
Reducing this walking time is the most effective way to increase your DC overall productivity.

In this article, I will show you how two simple strategies
- Order Wave Batching : grouping multiple orders in the same picking wave
- Picking Location Clustering : grouping the orders by zone
This will reduce total walking distance by up to 35% without changing your warehouse layout, your WMS, or your team size.
The Business Problem
Consider a luxury fashion retailer with an E-Commerce type DC where items are stored on 4-level shelves.
These shelves are organised in multiple rows (Row#: 1 … n) and aisles (Aisle#: A1 … A_n).

Here are our assumptions:
- Items' Dimensions: Small and light dimensions of items
- Picking Cart: lightweight picking cart with a capacity of 10 orders
- Picking Route: Picking Route starts and ends at the same location
Every day, your distribution planners receive thousands of order lines from the OMS (Order Management System).
The question is: how do you group these orders and sequence the picks to minimise walking distance?
Understanding the Cost of Walking
To understand the impact of walking distance, we need to translate the warehouse layout into something we can measure.
Mapping Storage Locations to Coordinates
Based on the actual warehouse layout, storage locations are mapped with 2-D (x, y) coordinates that will be used to measure walking distance.

Every storage location is linked to a Reference using Master Data. (For instance, reference #I23129 is located in coordinate (x3, y8)).
You can then link every order line to a geographical location for picking.
Order Lines from your Warehouse Management System WMS

Order lines can be extracted from your WMS Database.
This table should be joined with the Master Data table to link every order line to a storage location and its (x, y) coordinate in your warehouse.
Calculating Walking Distance Between Two Locations
Here is the key challenge: in a warehouse, walking distance is not the same as straight-line distance.

A picker cannot walk through shelves. They must walk around the aisles. This means the actual walking distance between two points depends on the warehouse layout, not just the coordinates.
This is critical. If you use Euclidean distance (straight line) to estimate walking time, you will underestimate the real cost.
For a detailed walkthrough of how to build the distance calculation functions and map your WMS data to warehouse coordinates, see my technical deep dive: Improve Warehouse Productivity using Order Batching with Python
Strategy 1: Order Wave Batching
The first intuitive way to optimise this process is to group orders that share common picking locations into the same wave.
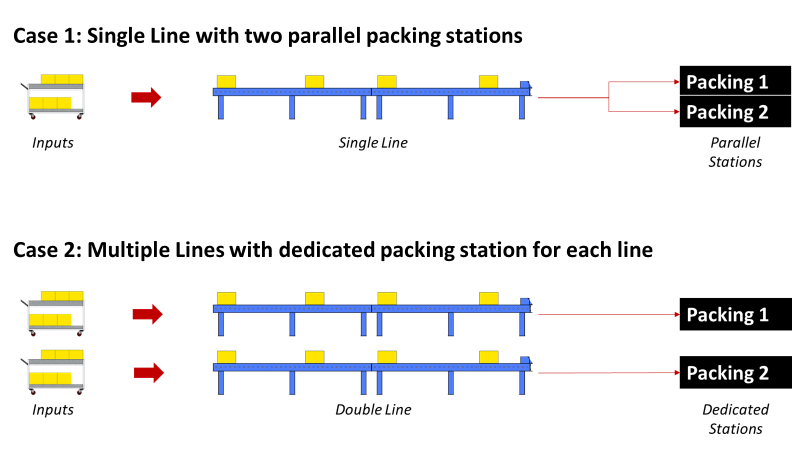
What is Wave Picking?
Instead of picking one order at a time, your picker collects items for multiple orders on a single route.

In the worst scenario (Scenario 1), a single order is picked per wave. The picker walks the entire warehouse for just a few items.
This can be easily optimised because:
- Locations: Orders #1 and #2 have common picking locations
- Zones: orders have picking locations in a common zone
- Single-line Orders: items_picked/walking_distance efficiency is very low

The first intuitive way to optimise this process is to combine these three orders in one picking route — this strategy is commonly called Wave Picking.
How Does Wave Picking Work?
For each wave, the picking route strategy follows the Next Closest Location logic:
This function will choose the next location among several candidates to continue your picking route.
Objective: return the closest location as the best candidate.
Testing the Impact of Wave Picking
We can now test our picking route strategy with picking order lines.
- Orders Waves: orders are grouped by chronological order of receiving time from OMS (TimeStamp)
- Picking Route: The picking route strategy follows the Next Closest Location logic
To estimate the impact of the wave picking strategy on your productivity, we will run several simulations with a gradual number of orders per wave.
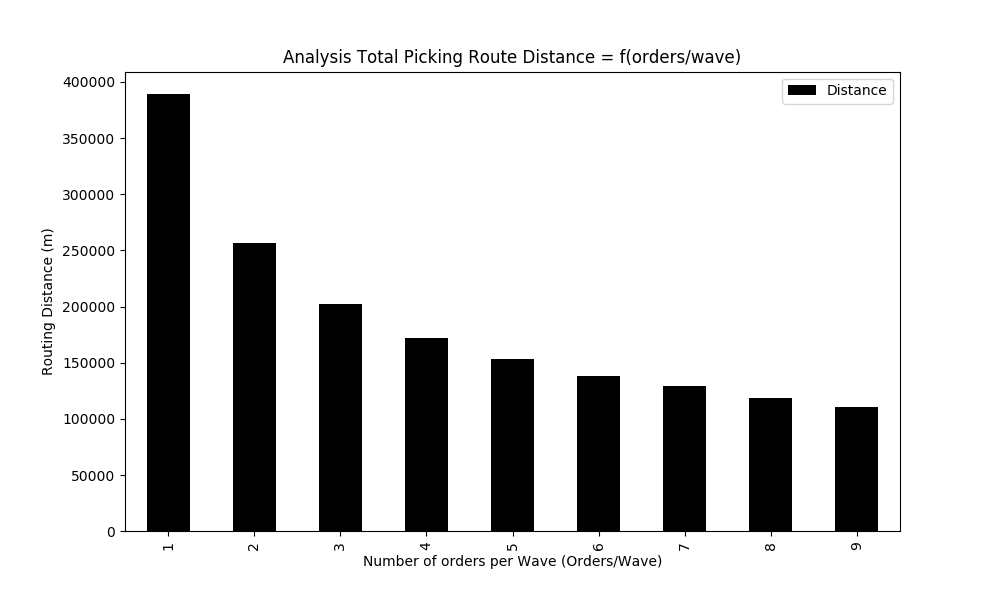
Results for 5,000 order lines with a ratio from 1 to 8 orders per route:
The total walking distance decreases as you increase the number of orders per wave.
More orders per wave means more shared locations, which means shorter total routes.
I built a full simulation model to test these scenarios with Python. You can access the source code and reproduce the results with your own data: Improve Warehouse Productivity using Order Batching with Python
But This Solution Is Far from Optimal
While wave picking improves productivity, it has a fundamental limitation: it groups orders by time of arrival, not by location.
Orders that arrive together may have picking locations scattered across opposite ends of the warehouse.
Orders can be grouped by geographical clusters of Picking Locations to reduce pickers' walking distance.
Strategy 2: Picking Location Clustering
This is where the real gains come from.

The Idea
Instead of grouping orders by arrival time, we group them by where their items are located in the warehouse.
Single-line orders have the advantage of being located in a single storage location; grouping several single-line orders by cluster can ensure that our picker will stay in a delimited zone.

Before looking at complex algorithms, we can find insights into optimising our algorithm with simple solutions.
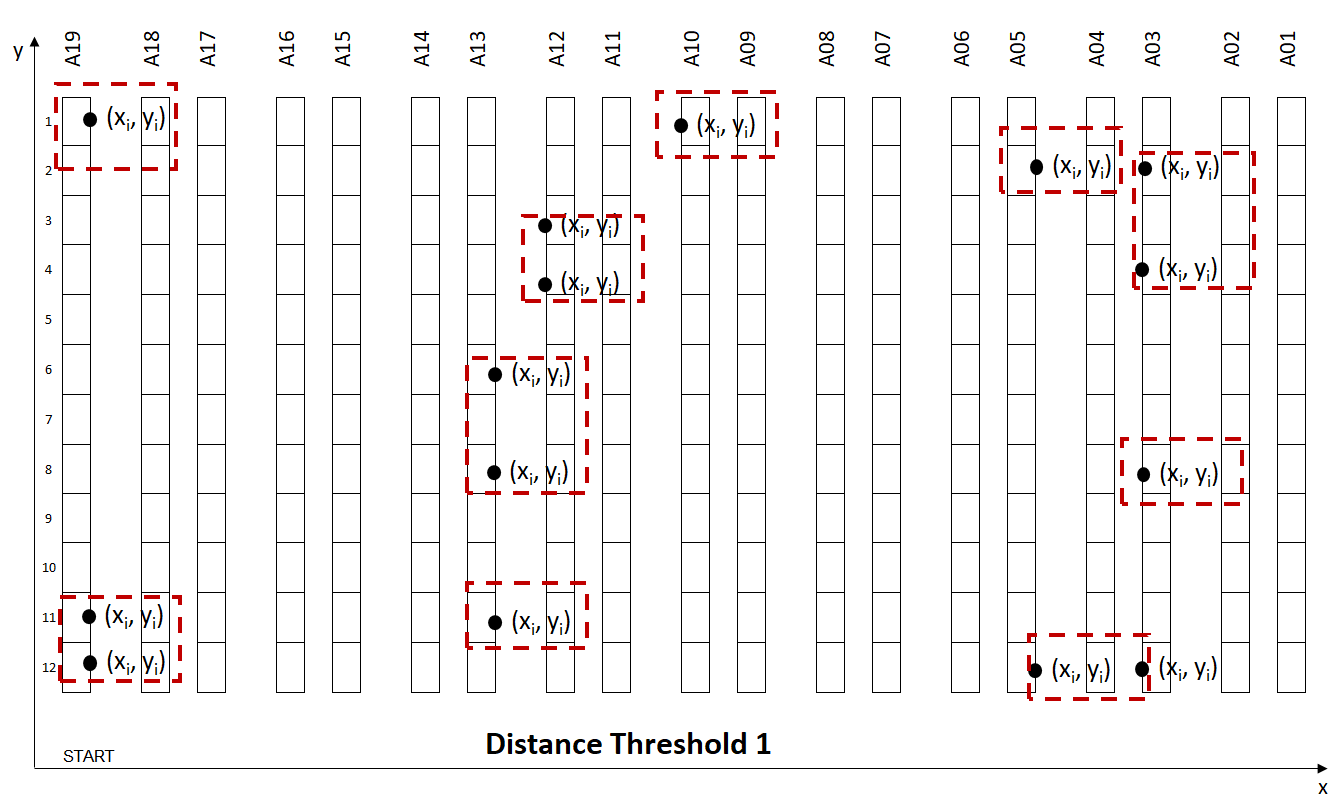
Where Are Single-Line Orders Located?


Insights: for the example of the distribution above:
- Scope: 5,000 order lines for 23 aisles
- Single line orders: 48% of orders located in alleys A11, A10, and A09
This concentration is exactly what makes clustering powerful. Nearly half of all single-line orders are in just three aisles.
How Clustering Works

Idea: Picking Locations Clusters
Group picking locations by clusters to reduce the walking distance for each picking route. (Example: the maximum walking distance between two locations is <15 m.)
Spatial clustering is the task of grouping together a set of points in a way that objects in the same cluster are more similar to each other than to objects in other clusters.

Here, the similarity metric will be walking distance from one location to another.
For instance, I would like to group locations to ensure the maximum walking distance between two locations is 10 m.
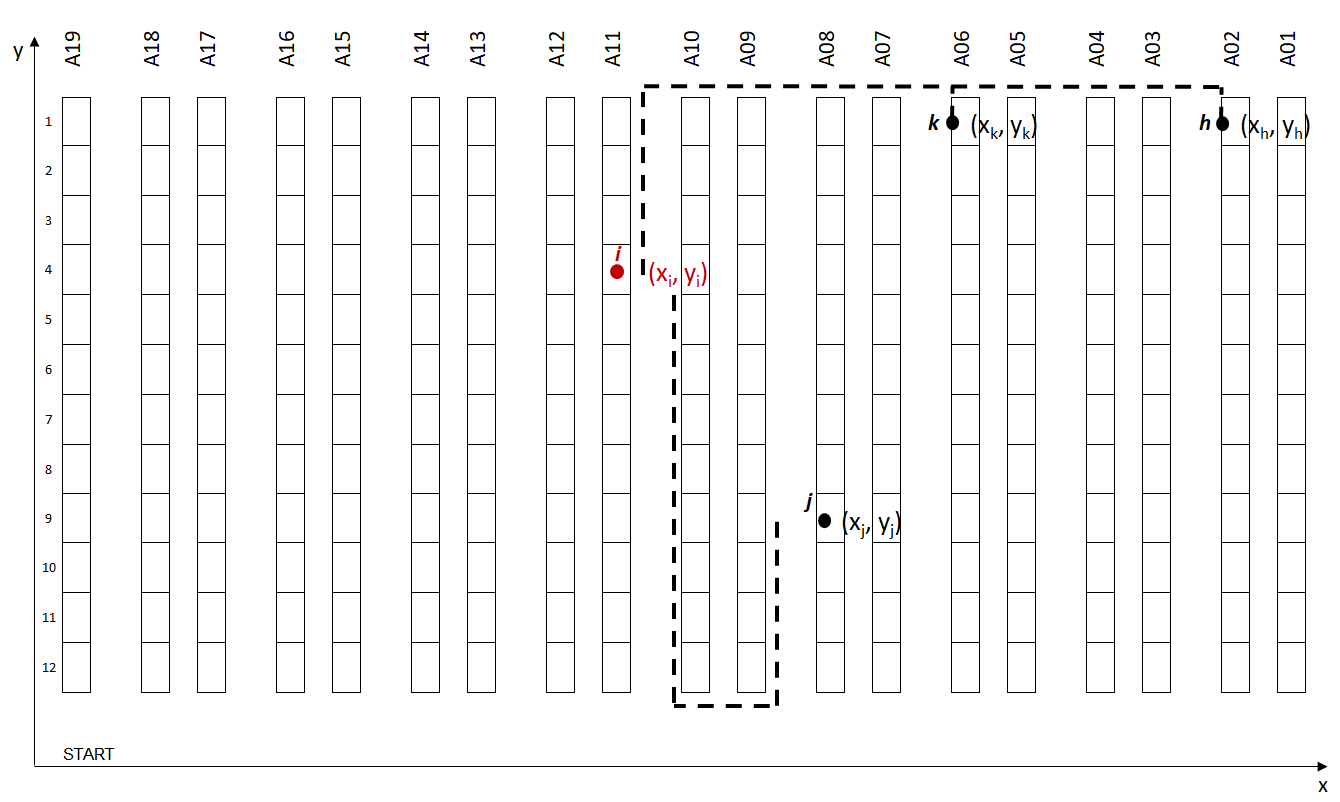
Challenge: Euclidean Distance vs. Walking Distance
For our specific model, we cannot use conventional clustering methods using Euclidean Distance.
Indeed, walking distance (using our warehouse layout) is different from Euclidean Distance.
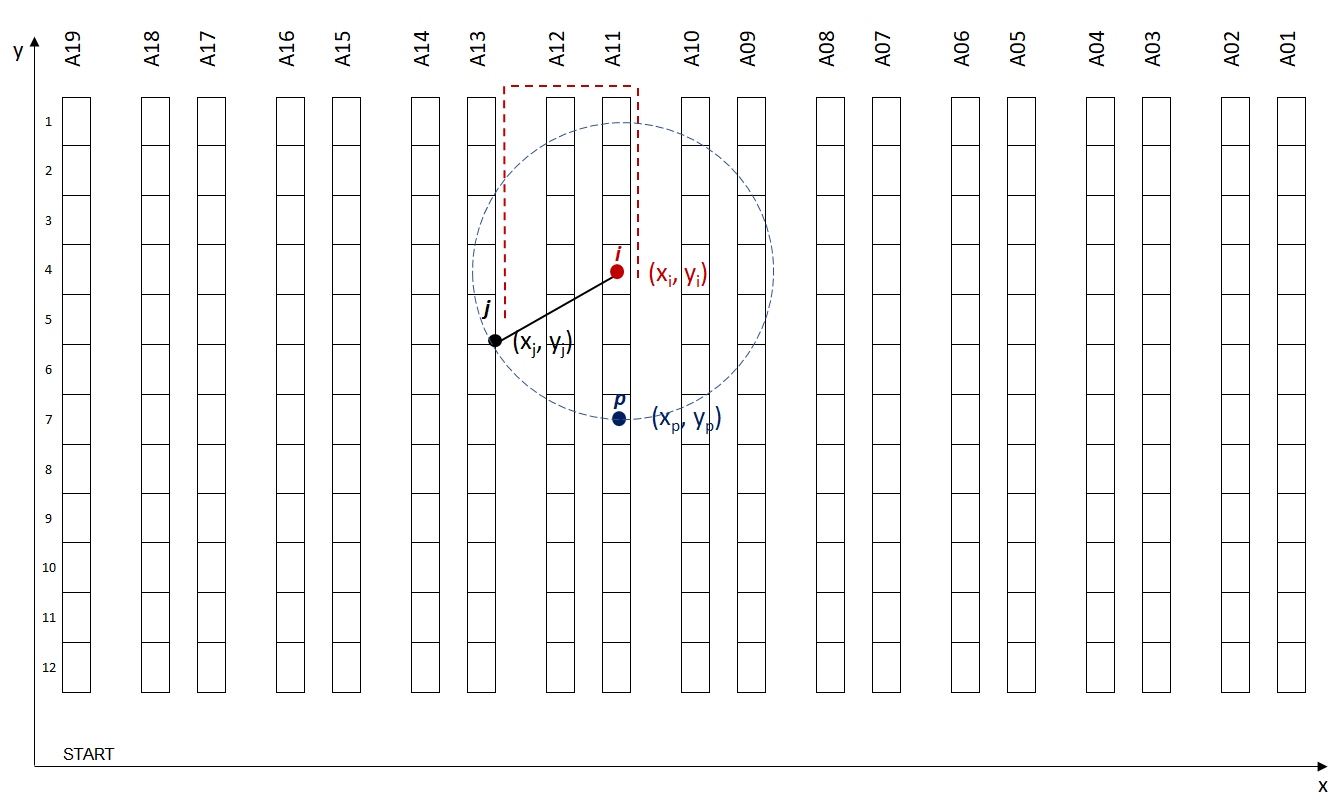
For this specific example, Euclidean distances between I (x1, Y1) and the two points p (x_p, y_p) and j (x_j, y_j) are equal.
But if we compare picker Walking Distance, p(x_p, y_p) is closer.
For this model, Picker's Walking Distance is the specific metric that we want to reduce. Therefore, the clustering algorithm should use our custom-made distance_walking function for better performance.
The implementation of the custom walking distance function and the clustering algorithm using Scipy's ward and fcluster is detailed step by step in: Improve Warehouse Productivity using Spatial Clustering with Python
Clustering Applied: Comparing Three Methods

The left example using Walking Distance is grouping locations within the same aisle, reducing picking route distance; while the right example can group locations covering several aisles.
Handling Multi-Line Orders
Unlike single-line orders, multi-line orders can cover several picking locations. However, we can apply the same methodology applied to the centroids of storage locations.

Example: Order with 3 lines covering 3 different picking locations.
For a set of orders, lines extract single lines (df) orders, clusters id and orders number; this function you map your Dataframe with cluster ID for wave creation.
Results: What Does This Actually Save?
Model Simulation
We have several steps before picking routes to create using wave processing.
At each step, we have a collection of parameters that can be tuned to improve performance:

Comparing Three Methods of Wave Processing

We'll first assess the impact of Order Wave processing by clusters of picking locations on total walking distance.
We'll be testing three different methods:
- Method 1: We do not apply clustering (i.e. Initial Scenario)
- Method 2: We apply clustering on single-line orders only
- Method 3: We apply clustering to single-line orders and centroids of multiline orders
Scenario for Simulation:
- Order lines: 20,000 Lines
- Distance Threshold: Maximum distance between two picking locations (distance_threshold = 35 m)
- Orders per Wave: orders_number in [1, 9]

Results:
- Best Performance: Method 3 for nine orders/Wave with 83% reduction of walking distance
- Method 2 vs. Method 1: Clustering for mono-line orders reduces the walking distance by 34%
- Method 3 vs. Method 2: Clustering for mono-line orders reduces the walking distance by 10%
You can reproduce these simulations with your own order data. The full model with source code and parameters is available in:
Improve Warehouse Productivity using Spatial Clustering with Python
Tuning the Distance Threshold
Now that we validated that Method 3 is the best for our particular scenario (20,000 order lines, 35 m Distance Threshold), let us look at the Distance Threshold's impact on total walking distance.
The trade-off between Walking Distance between two locations and Wave Size:
- Low Distance: The walking distance between two locations is low, but you have fewer orders per wave (more waves)
- High Distance: The walking distance between two locations is higher but you have more orders per wave (fewer waves)
[ARTICLE 2][Image 14: Route Distance for 5,000 lines — bar chart showing distance vs. distance threshold with a local minimum]

We can find a local minimum for Distance_Threshold = 60 m, where the distance is reduced by 39% vs. Distance_Threshold = 1 m.

We can find a local minimum for Distance_Threshold = 50 m, where the distance is reduced by 27% vs. Distance_Threshold = 1 m.
What This Means for Your Business
Let me translate these numbers into business impact.
If your warehouse processes 20,000 order lines per day with a team of 20 pickers:
- 60-70% of their time is walking. That is the equivalent of 12-14 full-time pickers doing nothing but walking.
- An 83% reduction in walking distance means you recover the equivalent of 10-11 FTEs of productive time.
- Even the conservative 27-35% improvement from basic clustering means 3-4 FTEs of recovered capacity — without hiring anyone.
This is not a technology investment. This is an algorithm change in how you assign orders to waves and sequence picks. The warehouse layout stays the same. The team stays the same. The WMS stays the same.
The only thing that changes is the logic behind order batching.
Want to test this on your warehouse data? I have published the complete methodology with source code for both strategies:Order Batching with Python — wave picking simulation and distance calculationSpatial Clustering with Python — clustering algorithm and parameter tuning
Next Step
Based on this feedback, the next steps will be:
- Picking Route Creation: For a list of Picking Locations, how can we find the best route minimising walking distance?
We will explore how pathfinding algorithms based on the Travelling Salesman Problem can be applied to design optimal picking routes within each cluster.

About Me
Let's connect on LinkedIn and Twitter. I am a Supply Chain Engineer that is using data analytics to improve logistics operations and reduce costs.
If you're looking for tailored consulting solutions to optimise your supply chain and meet sustainability goals, please contact me.
References
[1] Samir Saci, Improve Warehouse Productivity using Order Batching with Python
[2] Samir Saci, Improve Warehouse Productivity using Spatial Clustering with Python