
Supply Chain Planning Explained: Demand, Supply, S&OP and Where the Plan Breaks
The four planning functions between a forecast and a factory order, the two variabilities the plan must absorb, and why plans break between the desks.
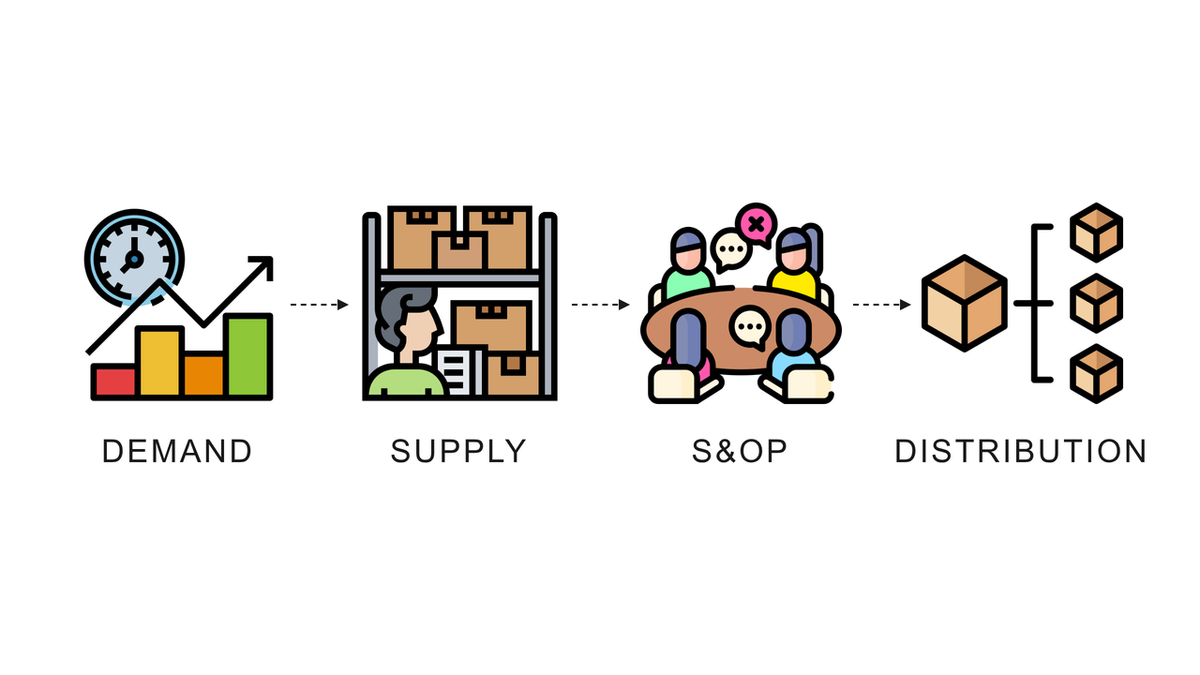
Supply chain planning is the set of decisions that turn an expected demand into orders: what to make, how much to hold, where to ship it and when.
It runs on a forecast, and the forecast is the part everybody argues about, but in ten years of doing this I have rarely seen a plan fail because the forecast was wrong.
They fail because the right number arrived too late to act on, or because the plan assumed a lead time that only happened half the time.
In this article, I will explain the four planning functions and what each one decides, the two variabilities a plan has to absorb, and the eleven-day story that shows where the plan actually breaks.
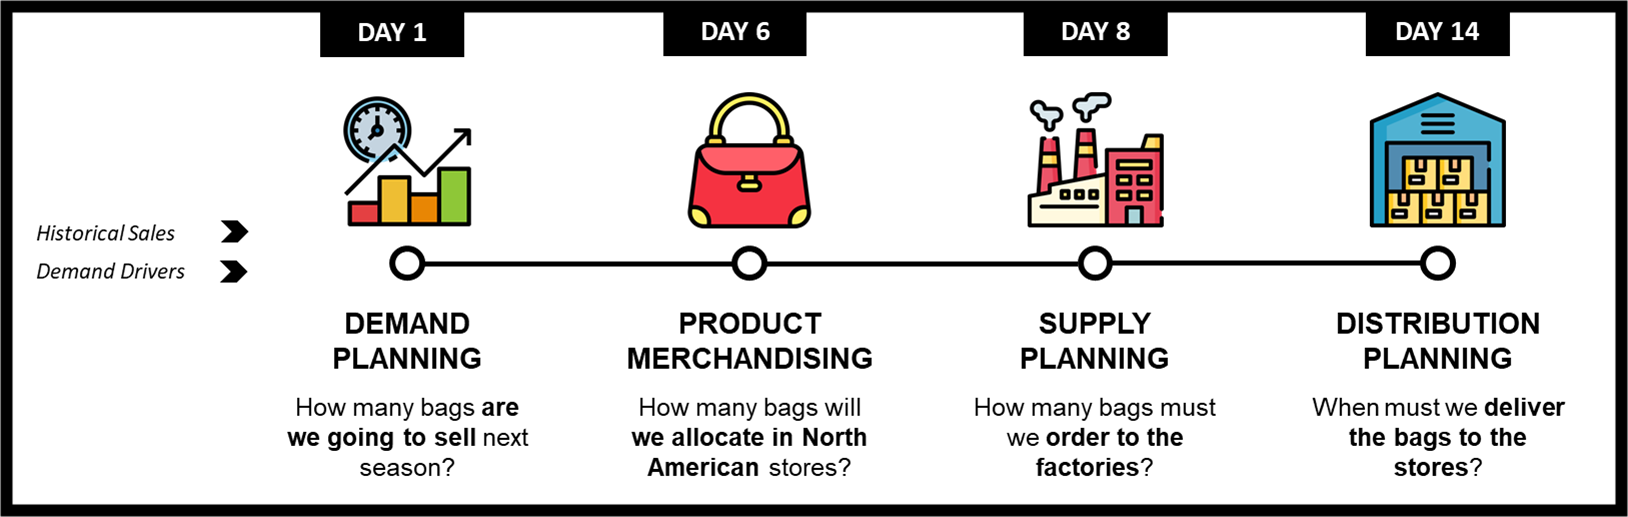
The scenario: a fashion retailer planning a season
Take a fashion retailer with stores across several countries, factories in Asia, and regional warehouses in between.
The demand planners forecast what each store will sell, and the merchandisers turn that into a buy plan per store.
The supply planners order from the factories, and the distribution planners replenish the stores from the warehouses.
The lead time from a factory order to a garment on a shelf runs to weeks, so every one of those decisions is made against a future nobody can see.
That is what planning is, and the four functions below are how the work is divided.
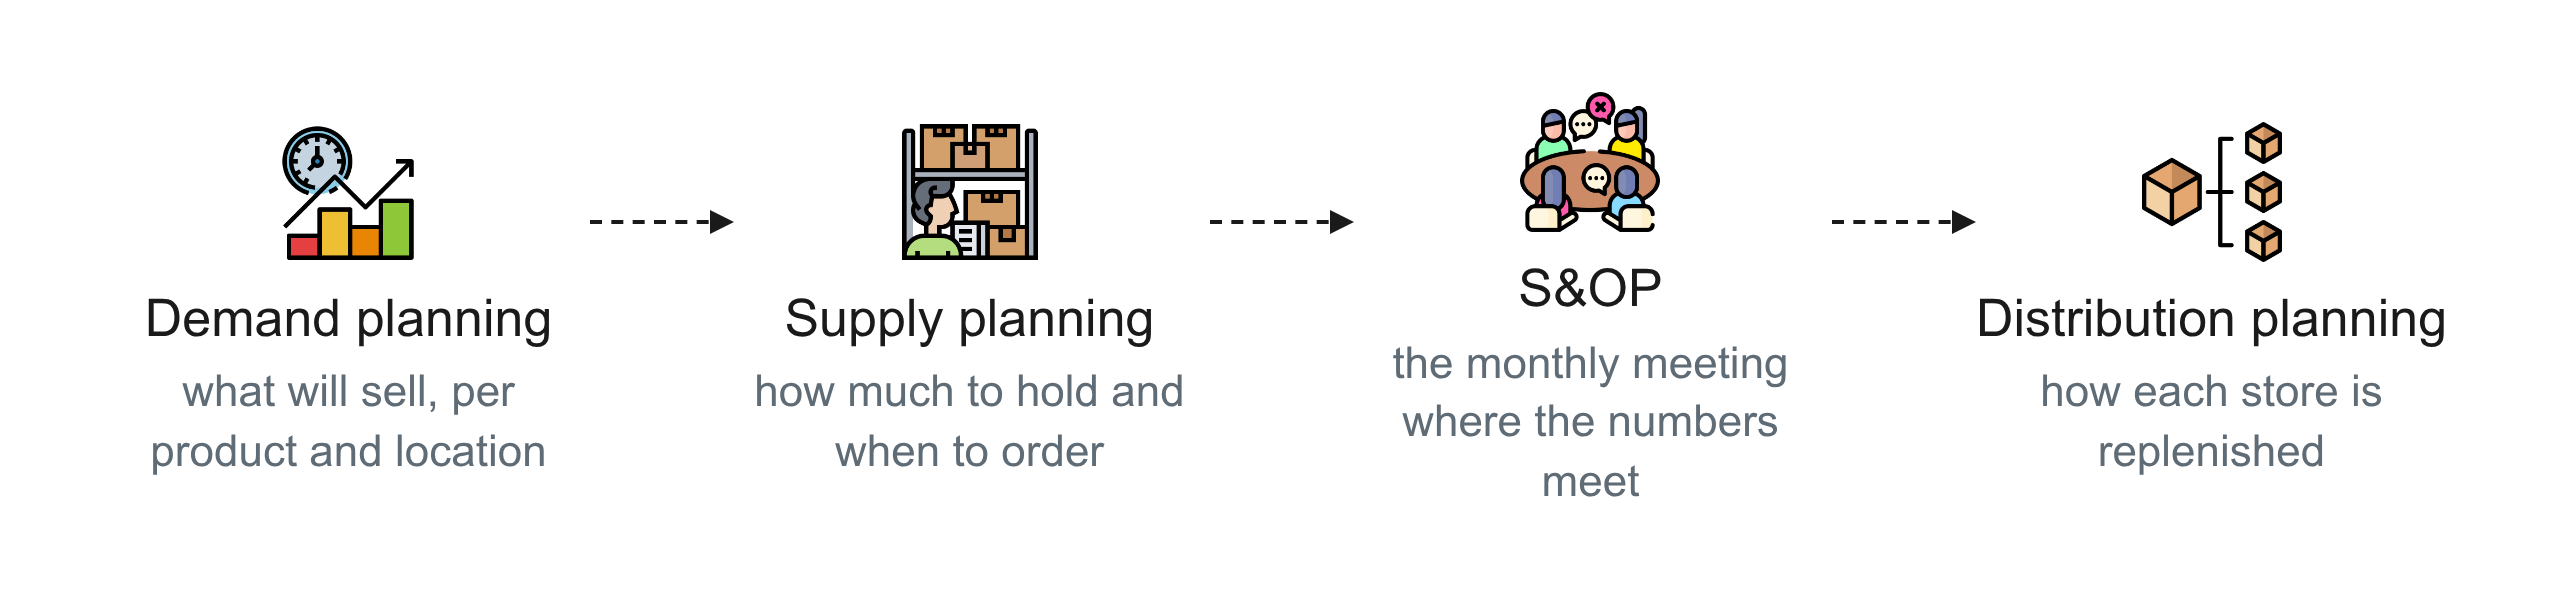
The four planning functions
Demand planning: what will sell
Demand planning produces the forecast, per product and per location, at the frequency the rest of the chain needs.
The methods range from a rolling mean of the last days to gradient boosting, and the comparison I ran on retail sales data in the demand forecasting case study shows when the extra complexity pays and when it does not.
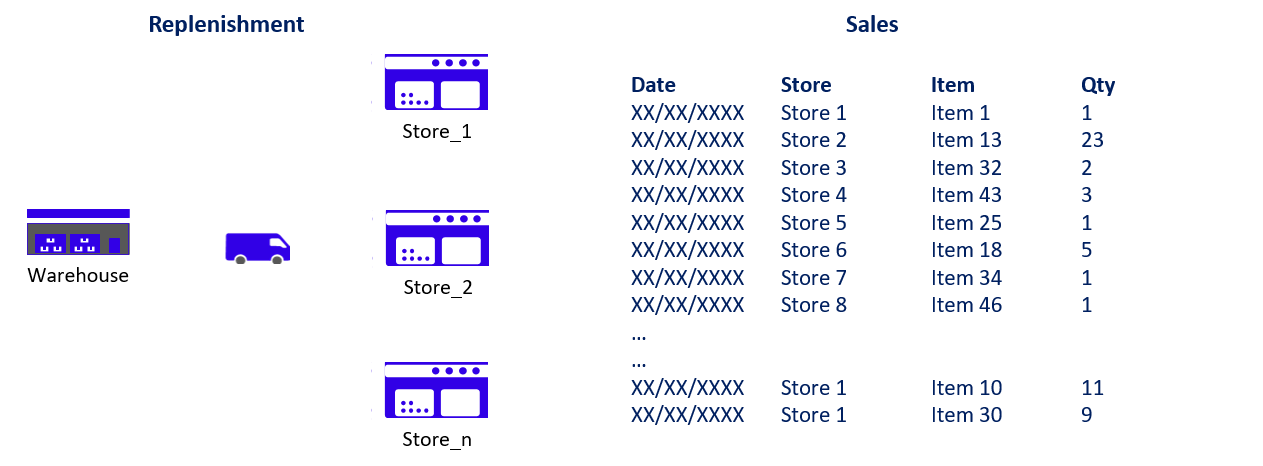
Whatever the method, the forecast needs history of the exact thing being predicted, at the frequency it will be predicted, and the feature engineering matters more than the algorithm.
Supply planning: how much to hold and when to order
Supply planning turns the forecast into inventory decisions: the safety stock, the reorder point, and the order quantity, per reference.
The rules are simple to state and expensive to get wrong.
A periodic review policy checks stock at a fixed interval and orders up to a target level, and a continuous review policy orders a fixed quantity whenever stock crosses a reorder point.
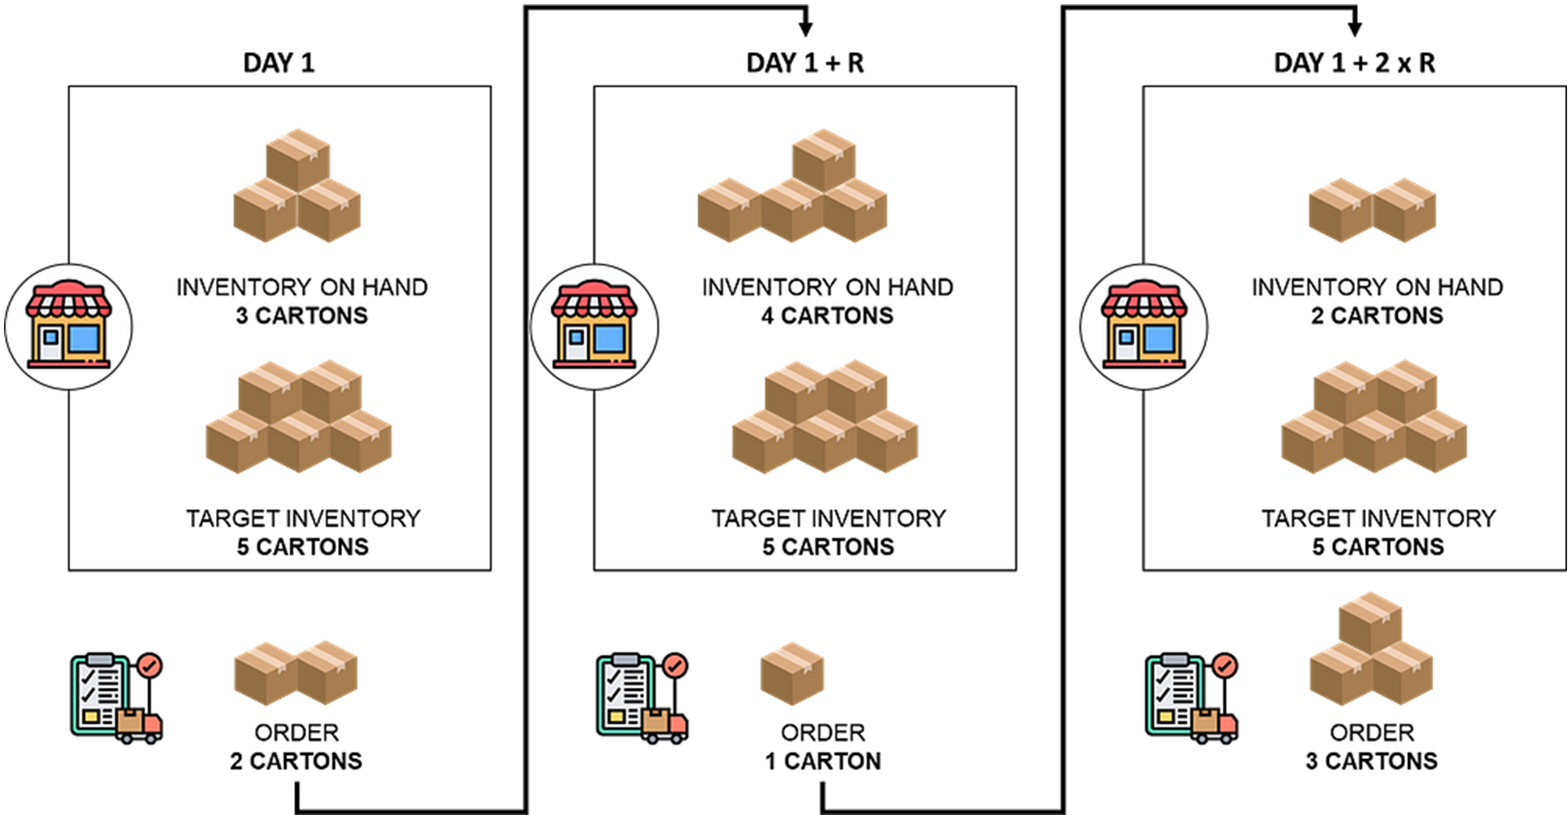
On one product the periodic review policy needs 27 replenishment orders a year.
On a portfolio of 2,294 references the same rule generated 19,267 replenishments in the first 100 days, which is the arithmetic behind the periodic review case study.
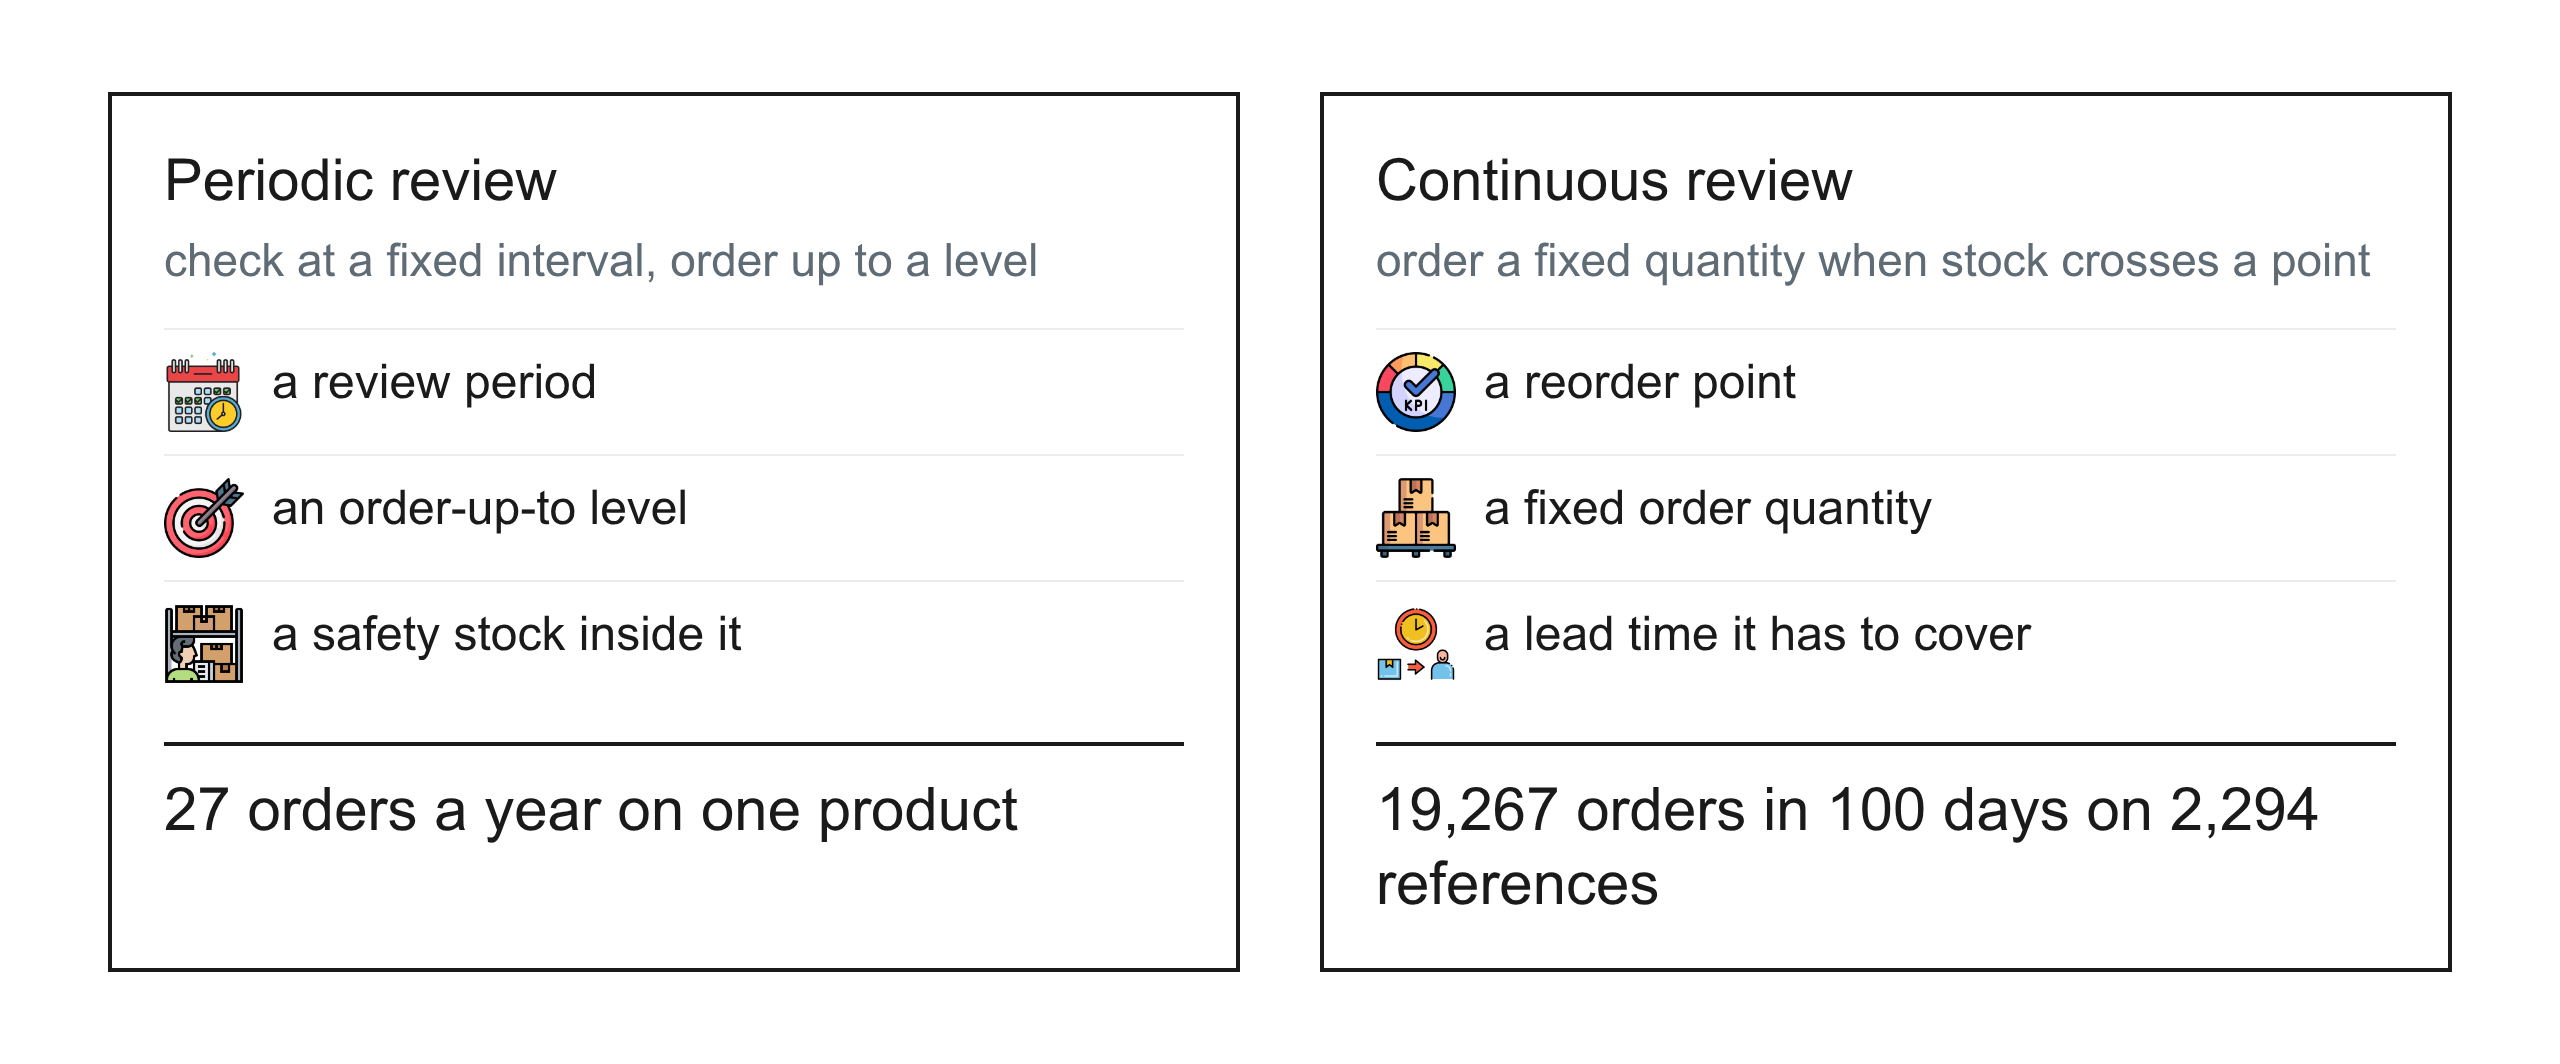
The stochastic demand version shows how the safety stock moves with the service level you target, and a 95% cycle service level and a 99% fill rate are very different amounts of stock.
Sales and operations planning: the meeting where the numbers meet
S&OP is the monthly process where sales, marketing, supply and finance agree one plan.
It is usually a meeting that reconciles the demand forecast with what the factories and the warehouses can actually deliver.
It is where a campaign gets its stock and where a capacity constraint gets its answer.
It is also the only place in the month where all four functions see the same number at the same time.
That last property is the one that matters, and the eleven-day story below is what happens when the number has to wait for the meeting.
Distribution planning: getting it to the store
Distribution planning replenishes the stores from the warehouses: how often each store is served, how much coverage it holds, and which warehouse serves it.
Those parameters were set once, years ago, and rarely reopened, which is why a network optimisation run on today's rate card is usually the study that finds money nobody was looking for.
The two variabilities the plan has to absorb
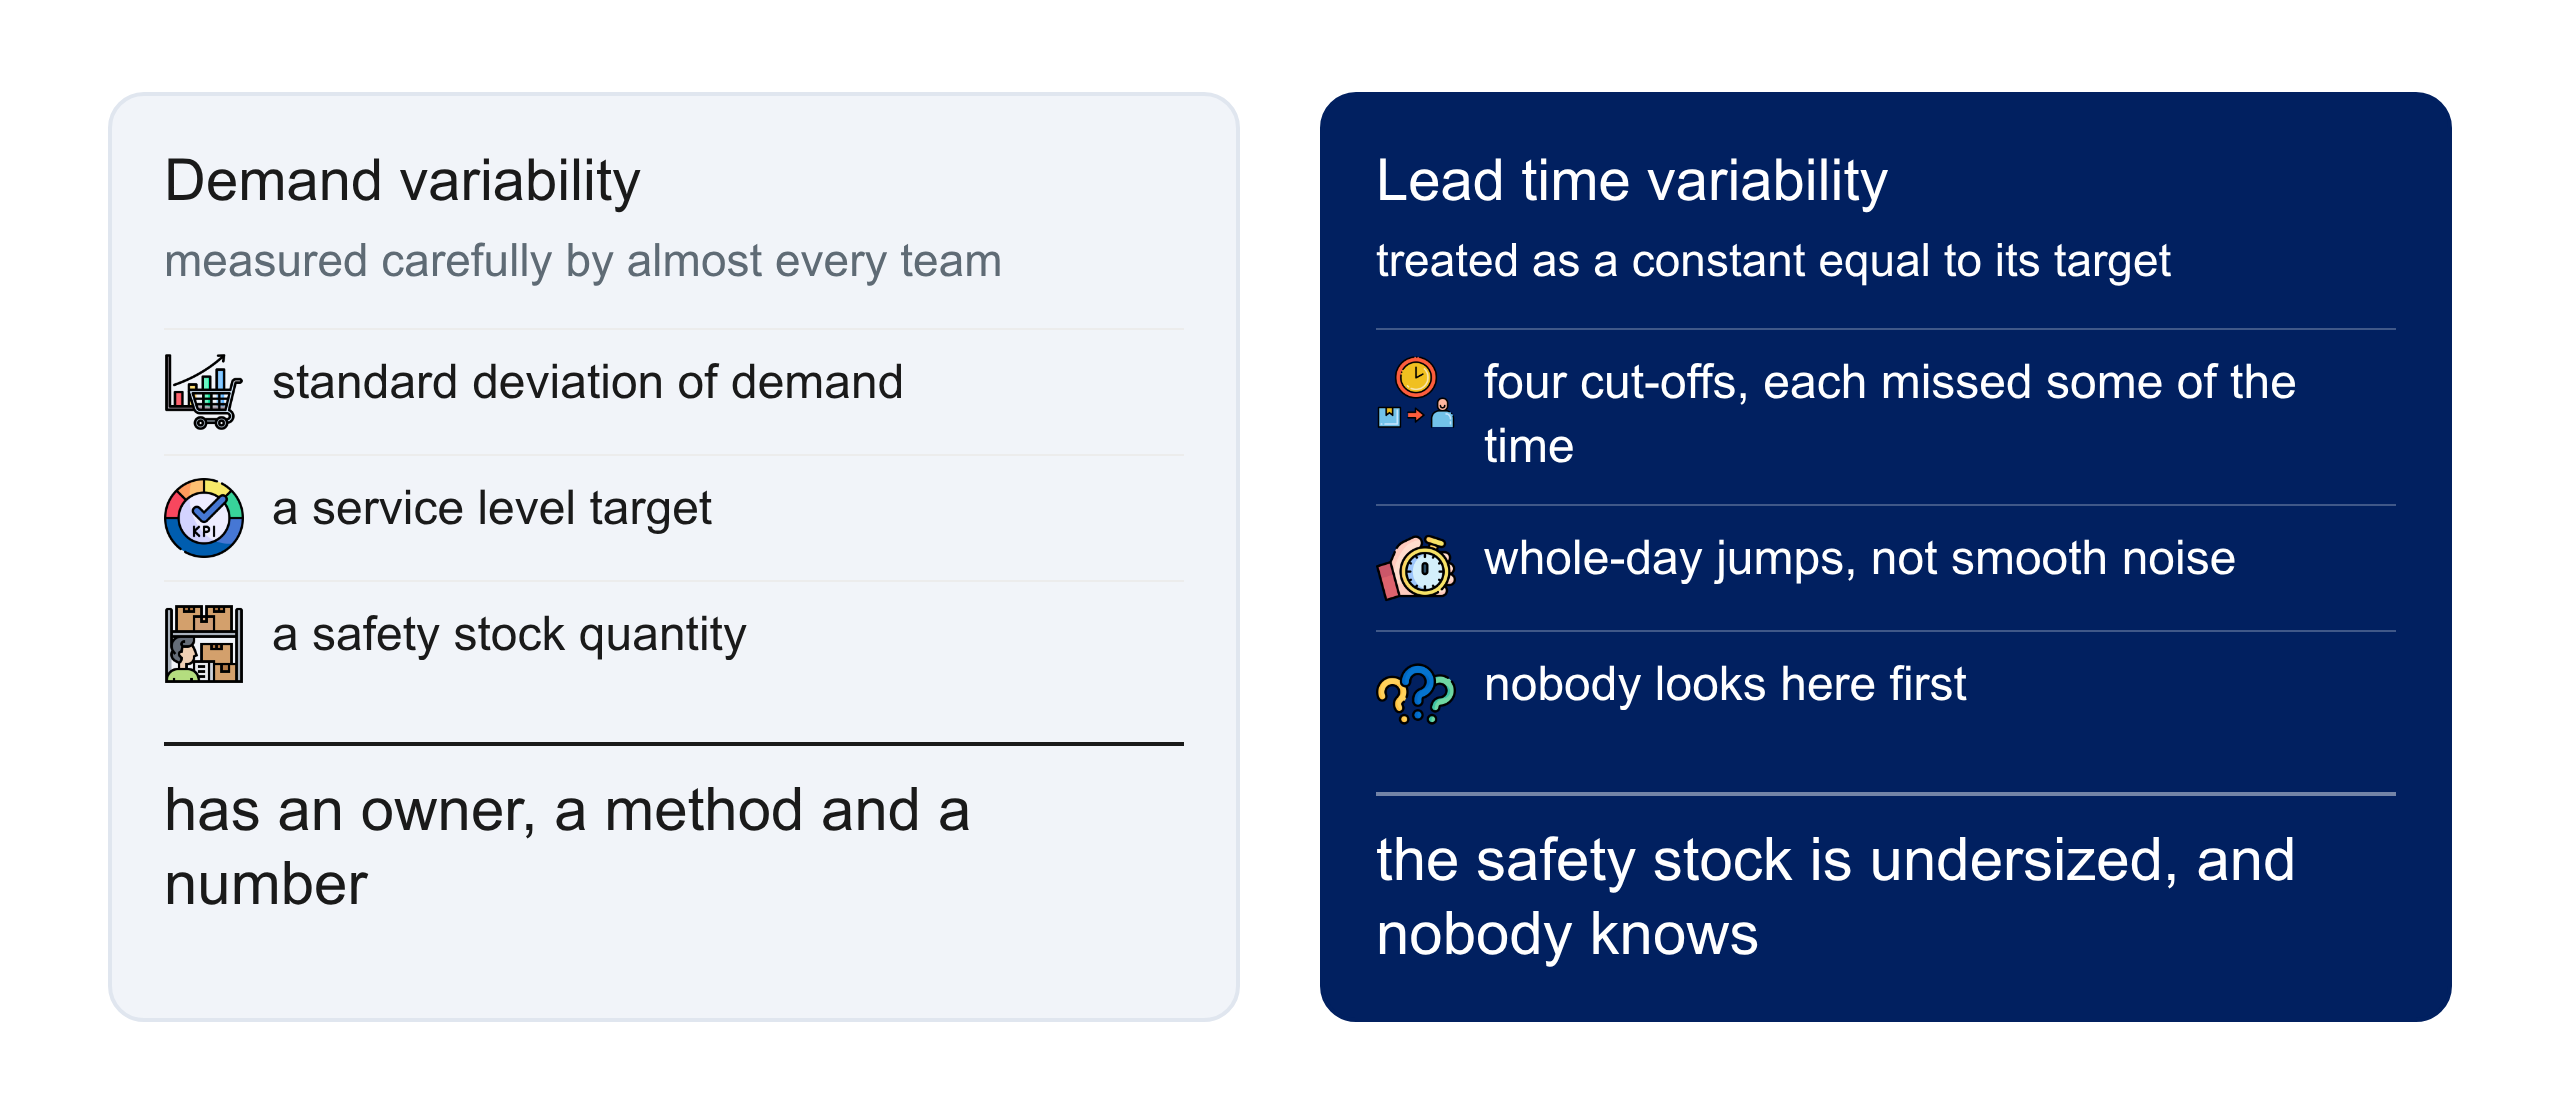
Demand variability, which everybody measures
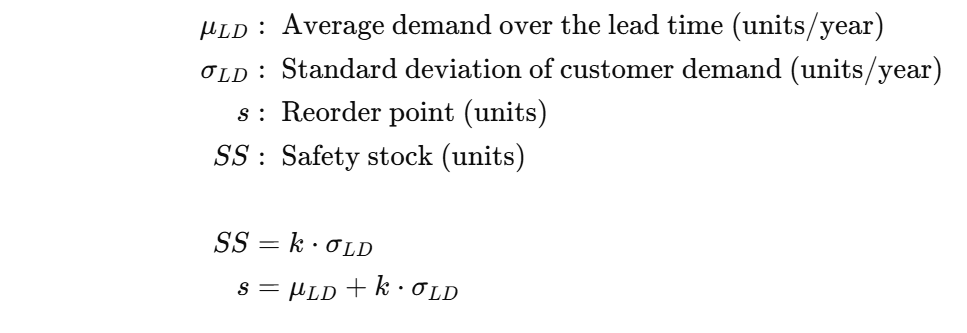
Demand varies, and the whole apparatus of safety stock exists to cover the demand during the replenishment lead time.
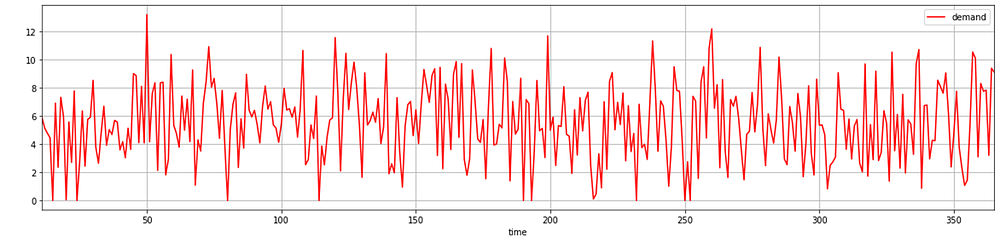
The safety stock formula takes the standard deviation of demand and a service level and gives a quantity, and every planning team I have worked with has that number.
Lead time variability, which almost nobody does
The same formula takes the variability of the lead time, and almost every team treats that as a constant equal to its target.
It is not, because a distribution chain rewards you in whole days.
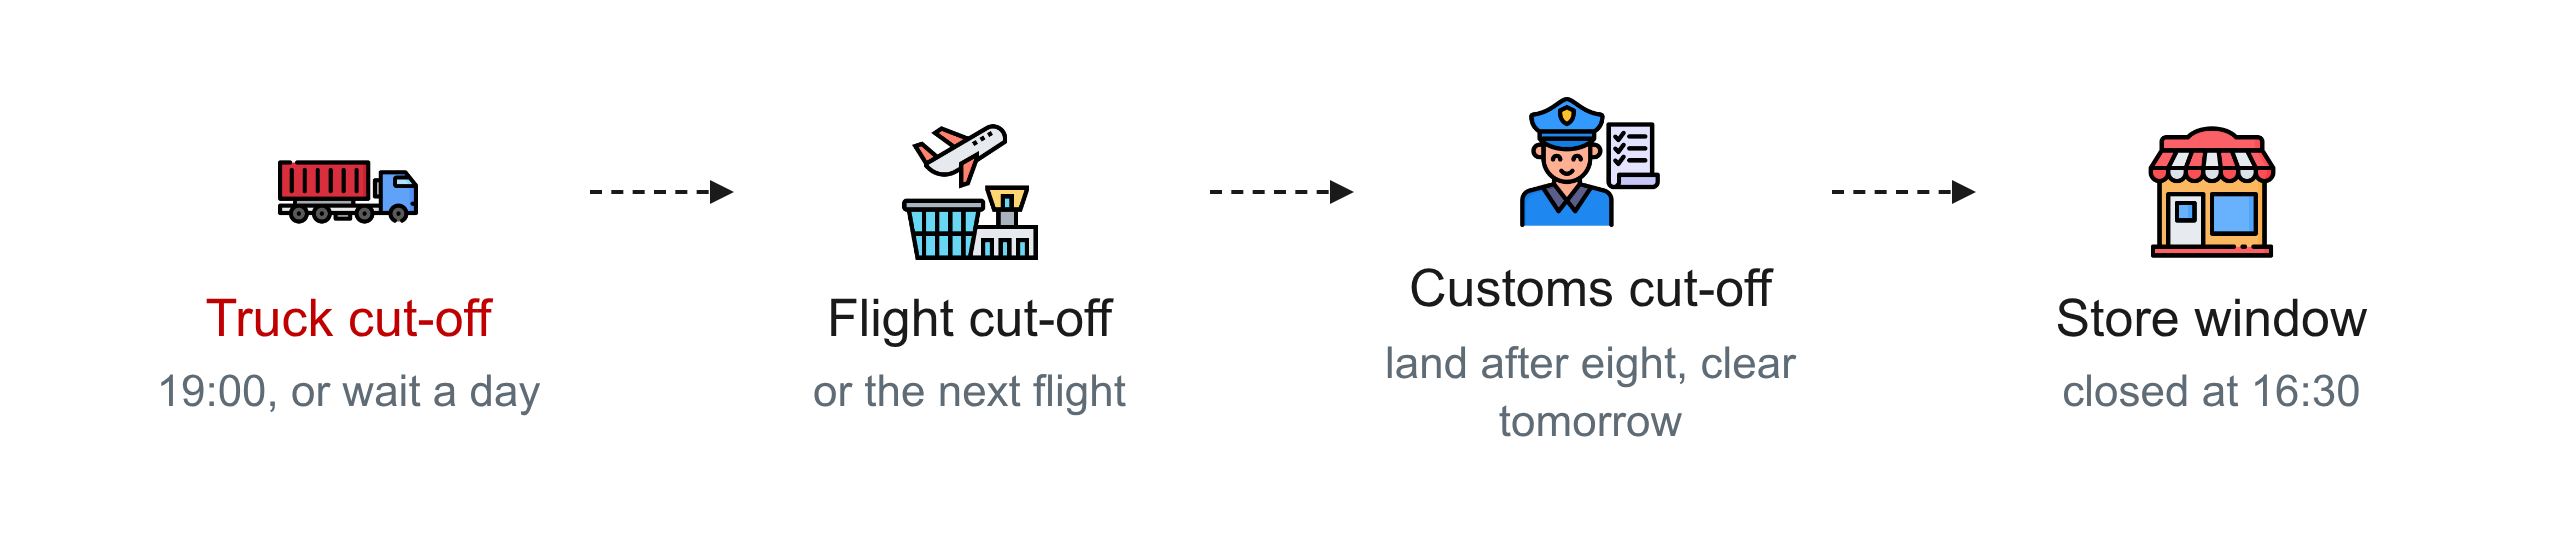
A pallet ready at 18:55 travels tonight and one ready at 19:05 waits twenty-four hours, and there are four such cut-offs between a warehouse and a store on another continent.
Your four-day average may be made of a large group at three days and a smaller group at five, with almost nothing actually arriving on day four.
Sizing a safety stock on that average protects you from a scenario that does not occur, and leaves you exposed to the one that does.
The fix is cheap: measure each leg of the lead time separately, plot the actual delivery times as a distribution, and set the safety stock on the spread rather than on the target.
That is the method in the lead time variability case study.
Where the plan actually breaks: eleven days across four desks
A fashion retailer was losing tens of thousands of dollars every time it ran a marketing campaign, because the products were not in the stores when the customers arrived.
The first assumption in the room was that the forecast was wrong, and it was not.
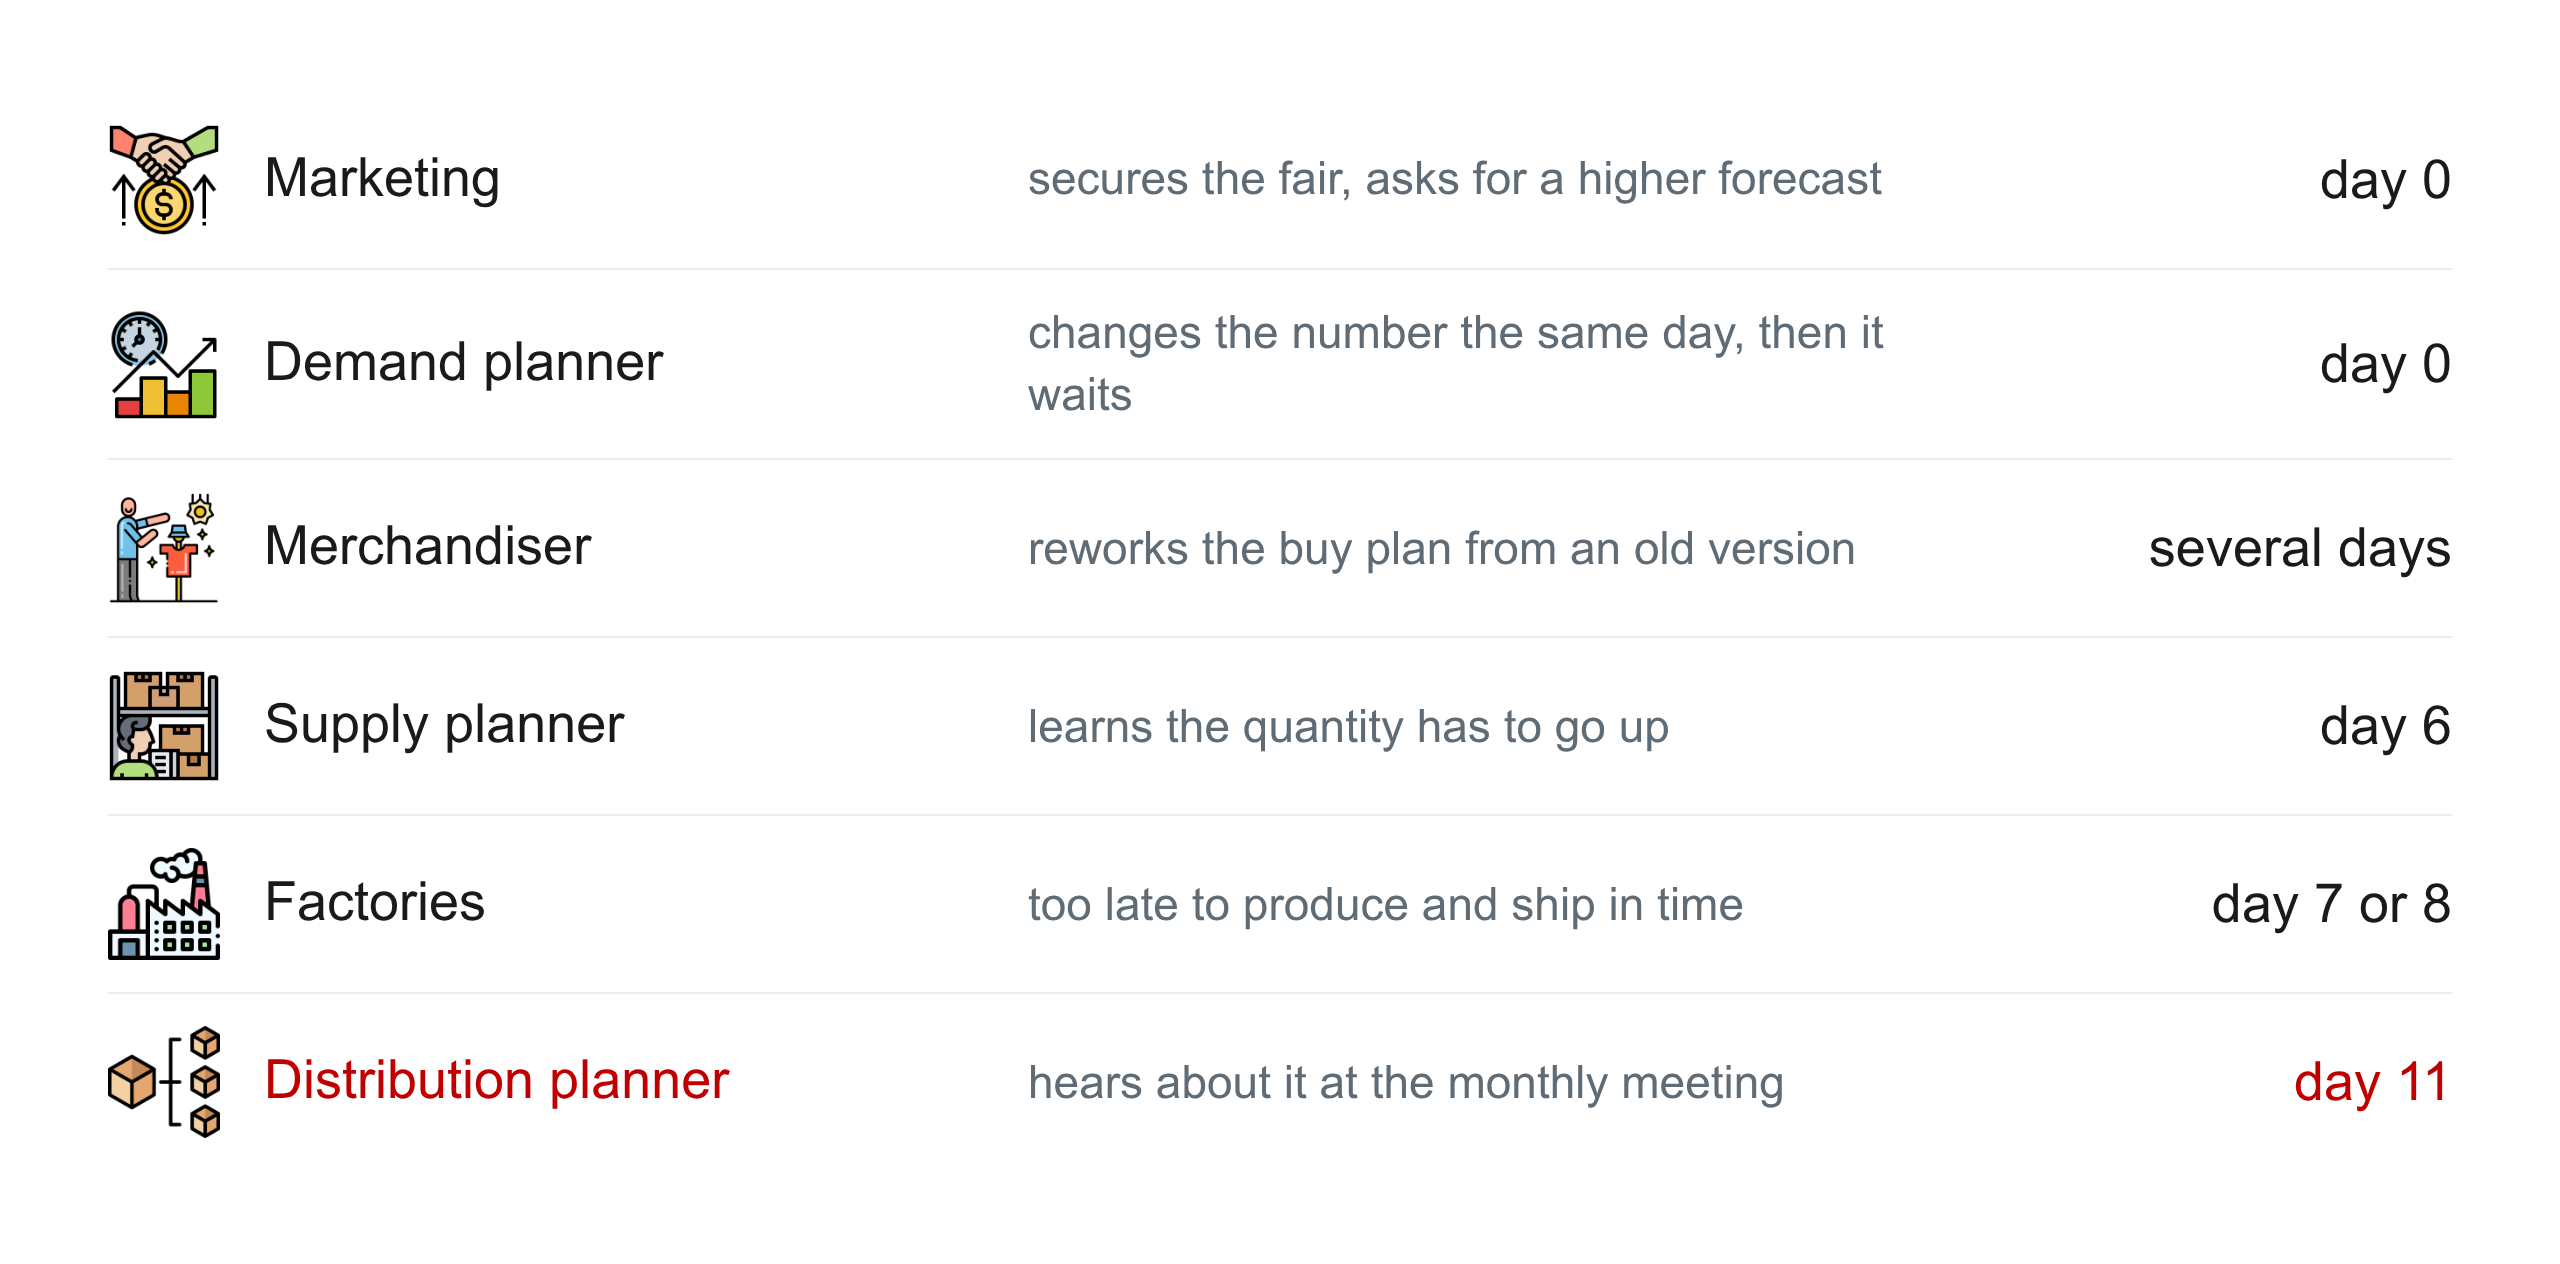
Marketing secured a spot at a sportswear fair, the demand planner raised the forecast the same day, and the number was right.
Then the file sat on her desk, reached the merchandiser several days later, and reached the supply planner six days after marketing first called.
It reached the factories a day or two after that, too late to produce.
The distribution planner heard about any of it eleven days in, at the monthly S&OP meeting.
Every individual delay is defensible, and the sum of them is not.
Nobody in that chain was slow, and the delay was created between the desks rather than at any one of them.
That is why no review ever finds it, and why the post-mortem lands on the forecast every time.
A forecast has a shelf life, set by the longest lead time behind it.
Everything spent moving the number between people comes out of that window, at the acting end rather than the thinking end.
The fix for that company was not a better forecasting model, it was connecting the four planning modules so that a change in one is visible in the next the same day.
Conclusion
Supply chain planning is four functions, two variabilities and one number that has to cross the desks before the factories can no longer help you.
What we covered in this article
Demand, supply, S&OP and distribution planning, and what each one decides.
The demand variability everybody measures, the lead time variability almost nobody does, and the eleven-day story of a correct forecast that arrived too late.
Where to go next
If the vocabulary is new, what supply chain analytics is covers the four types of question a planning team asks.
The Supply Science App has a planning track that tests you on exactly these concepts.
Related videos
The videos behind this article, already on the channel:
- Too Much Stock or Empty Shelves: Python Finds the Middle
- The Real Cost of Spreadsheet Planning (And How to Fix It)
- Understand Production Planning: Setup Cost or Holding Cost
- Production Planning Optimization with Python (Source Code)
The ones coming next, with the date each goes public:
- Procurement Optimisation: How Often Should You Reorder?, 30 September 2026
- We Saved 200,000 Euros by Changing One Inventory Rule, 11 November 2026
- Machine Learning for Retail Demand Forecasting (M5 Dataset), 30 November 2026
- When Exactly Do You Order More?, 23 December 2026
- How a Supermarket Never Runs Out of Milk, 20 January 2027
- The Meeting Where Sales and the Factory Fight, 3 February 2027
About Me
Let's connect on LinkedIn and Twitter. I am a Supply Chain Engineer who is using data analytics to improve logistics operations and reduce costs.