Are you Aware of the Potential of Your Data Expertise in Driving Business Profitability? A reflection of a supply chain data scientist who randomly discovered the power of data analytics to help small and large businesses.
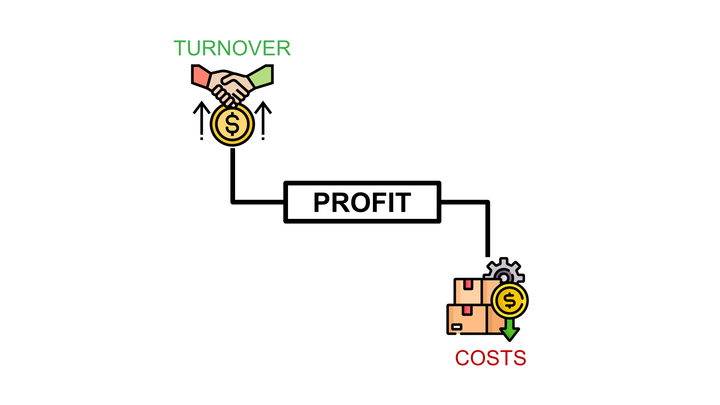
Business Planning with Python — Revenue Optimization How can you use data analytics to help small businesses maximize their revenue while maintaining or improving profitability?
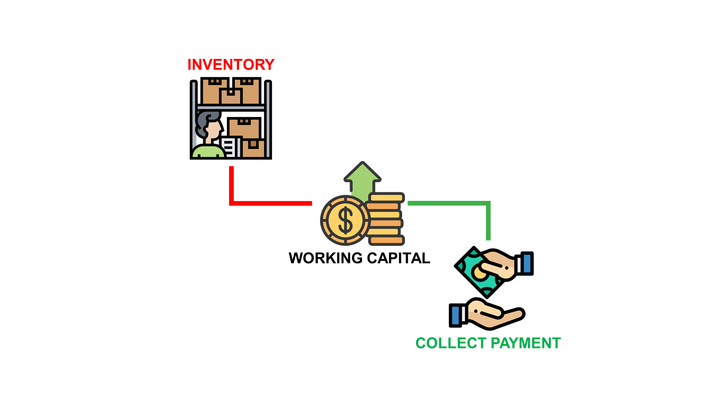
Business Planning with Python — Inventory and Cash Flow Management How can you use data analytics to help small businesses manage inventory, predict liquidity needs, and maximize profitability?
Create GPTs to Automate Supply Chain Analytics “The Supply Chain Analyst” is a Custom ChatGPT “GPT” that performs Pareto & ABC Analysis using sales data.
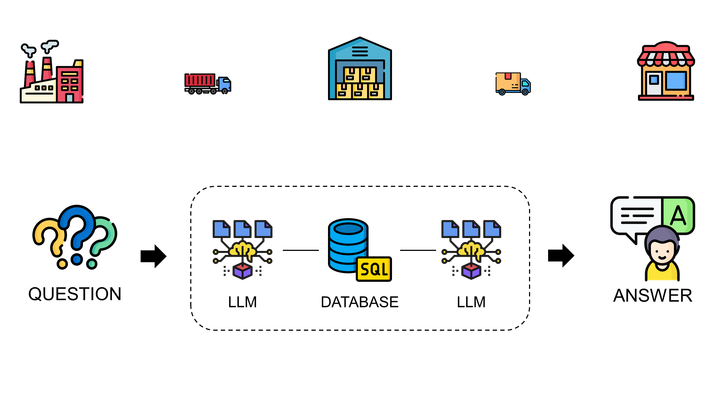
Leveraging LLMs with LangChain for Supply Chain Analytics — A Control Tower Powered by GPT Build an automated supply chain control tower with a LangChain SQL agent connecting an LLM with a database using Python.
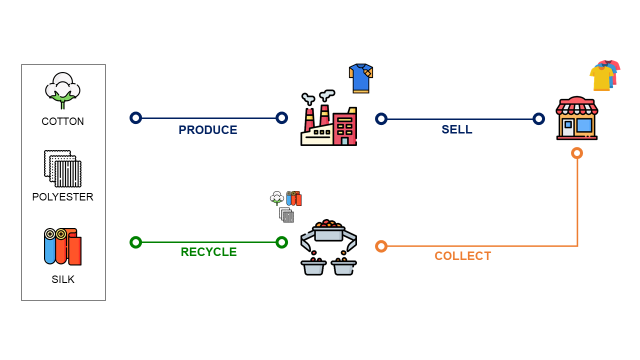
How Will Data Science Accelerate the Circular Economy? Actionable data science tips to overcome the operational challenges in transitioning to a circular economy.
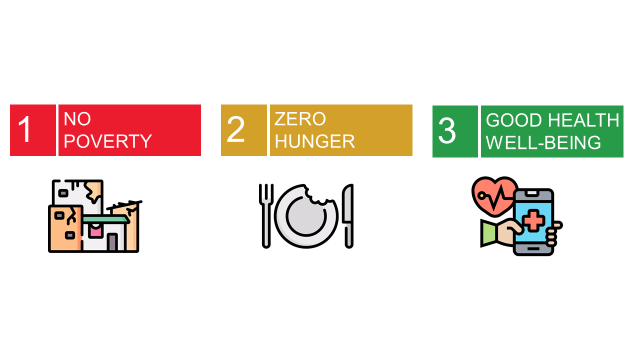
Data Science to Support the Sustainable Development Goals (SDGs) Linking Global Sustainability Initiatives with Companies’ Supply Chain Digital Transformations Using Data Science
What is ESG Reporting? Leveraging Data Science for Comprehensive and Effective Environmental, Social and Governance reporting of a company.
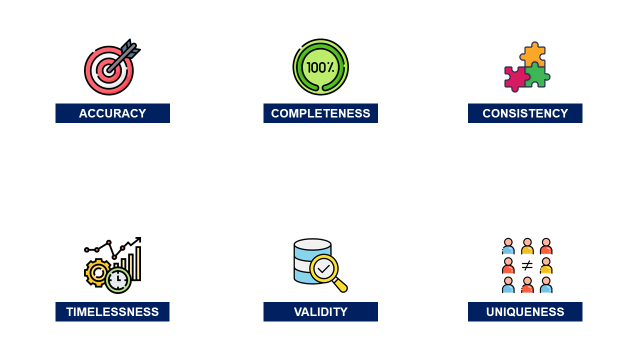
What Is Data Quality? Discover Methodologies to Ensure Accuracy, Consistency and Completeness of Supply Chain Data.
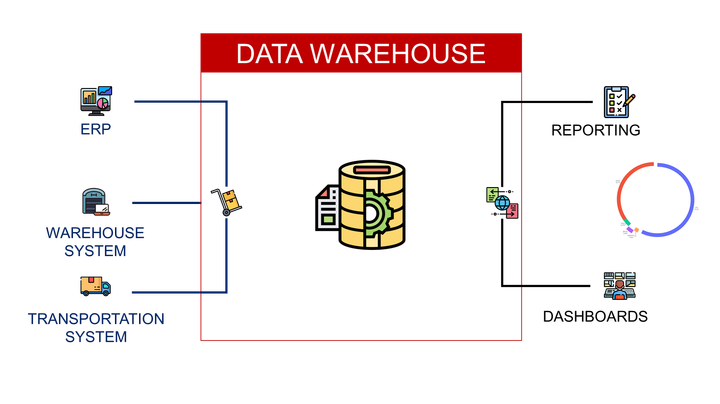
What is Business Intelligence? Discover the tools for data-driven decision-making applied to supply chain optimization.