What is ESG Reporting?
Leveraging Data Science for Comprehensive and Effective Environmental, Social and Governance reporting of a company.

Environmental, Social and Governance (ESG) reporting is a method used by companies to disclose their governance structures, societal impacts and their environmental footprint.
As stakeholders are increasingly demanding corporate social responsibility (CSR), ESG reporting has become a critical part of companies’ long-term strategies.
In this article, we will delve into the details of ESG reporting, highlight the challenges, and explore how data analytics can improve its accuracy.
💌 New articles straight to your inbox for free: Newsletter
I. Understanding ESG Reporting
1. What is ESG Reporting?
2. ESG Reporting supported with Data
II. Advanced Analytics for ESG Reporting
1. Lack of Standardization
2. Accuracy and Reliability of ESG Data
III. Data Science as a Game Changer
1. Sustainable Sourcing
2. ESG-Friendly Budget Planning
3. Supply Chain Network Optimization
III. Conclusion
Understanding ESG Reporting
What is ESG Reporting?
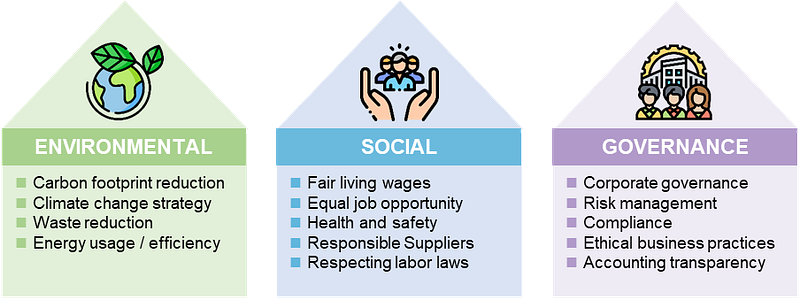
ESG Reporting is a form of non-financial reporting in which organisations communicate their environmental performance (E), social responsibility (S) and governance structures strength (G) to their stakeholders.
These three dimensions provide an in-depth understanding of a company’s sustainability and ethical impacts.

For instance, a company might report the
- Carbon emissions of its supply chain (E)
- Initiatives for community development (S)
- Diversity of its board members (G)
Let’s look at this type of reporting from the data analytics point of view.
ESG Reporting Supported with Data
Let us consider a hypothetical global fashion retailer: I&N.
I&N is a fast-fashion retailer that produces garments, bags and accessories in factories in Asia.
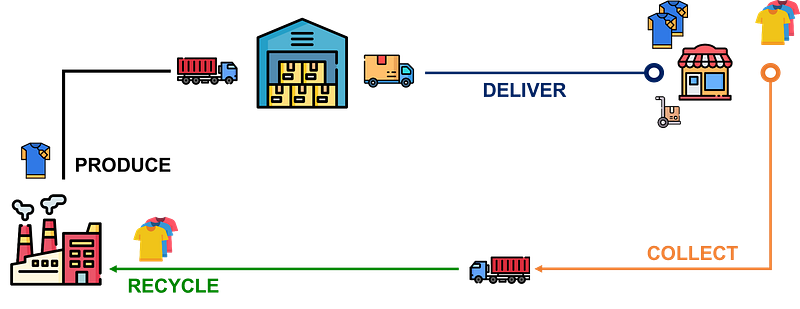
Stores (located in Europe) are delivered from local warehouses that are directly replenished by factories.
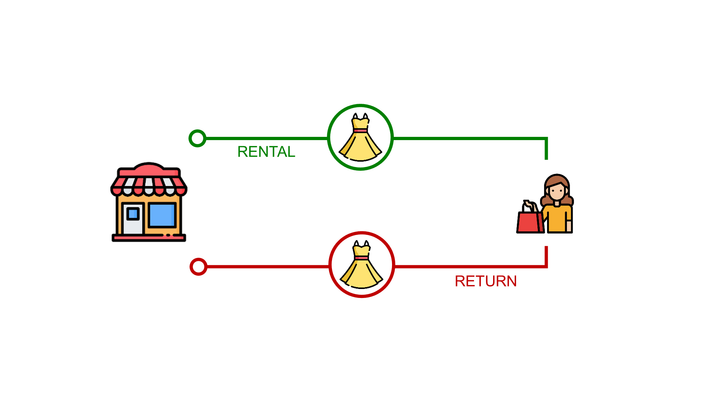
I&N is committed to sustainable practices (circular economy, renewable energy) and aims to build trust with its stakeholders through transparency.
Therefore, it regularly discloses its ESG performance in its annual sustainability report.
In its latest report, I&N discloses a number of key ESG metrics.,

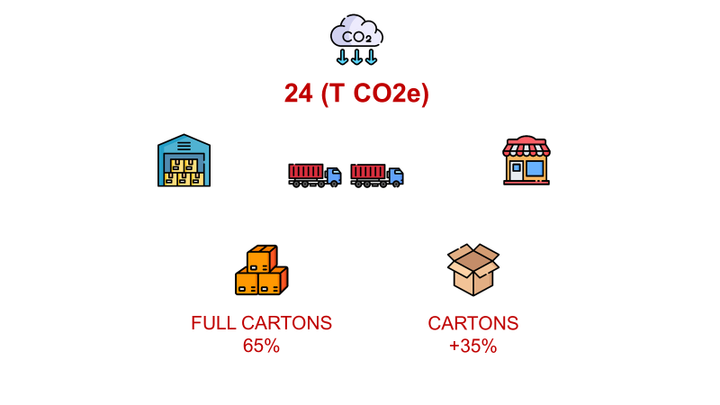
(E): For the environmental segment, I&N reports
- The total greenhouse gas emissions (kg CO2eq)
- The percentage of energy usage from renewable sources (%)
These indicators, which require advanced data processing, allow stakeholders to understand
- The environmental footprint of the products sold.
- The efforts to transition to cleaner energy sources.
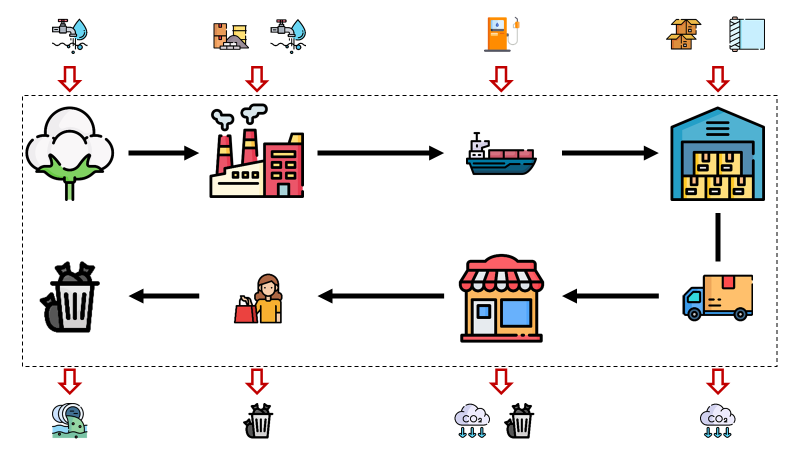
Product Life Cycle Assessment (LCA) is a data-driven methodology that can be used to evaluate environmental impacts from a product perspective.
The idea is to analyse each process, from raw material extraction to product disposal.
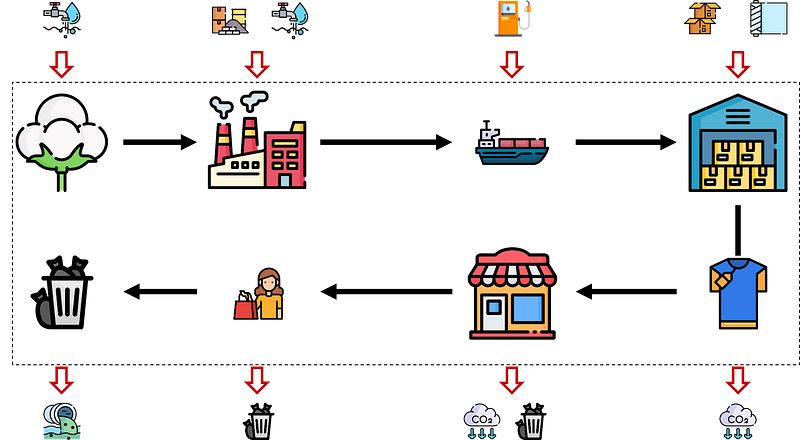
For each process, we have a look at the
- Consumption of natural resources, raw materials and energy
- Emissions of pollutants and CO2
- Waste generated
💡 For more details about these analytics solutions,
- What is a Life Cycle Assessment?
- Supply Chain Sustainability Reporting with Python
(S): For the social component, the company details
- The number of community development initiatives it has launched
- An average employee satisfaction score indicates the well-being of its workforce.
How does our company disclose the average employee satisfaction score?
To obtain this metric, organisations traditionally rely on surveys, which can often yield subjective and biased results.
Therefore, I&N decided to use Natural Language Processing (NLP) and Social Sentiment Analysis to analyse text data from employee reviews on platforms like Glassdoor or internal communication channels.

It can also be used on social media.
ESG sentiment analysis is a valuable tool for investors to track stakeholders' attitudes towards ESG issues and understand how these factors may impact a company’s stock price.
There are tools that perform audits on social media and job platforms.
They employ advanced NLP techniques to get the perspectives of customers and employees on critical topics linked to a company.
(G): For the Governance domain, I&N discloses
- The number of independent board members
- The percentage of female representation on its board.
This helps auditors and investors assess the I&N’s commitment to fair and responsible governance.
Board Composition Analysis is a data-driven evaluation of the diversity and experience of the board members and the management.
This could be done by analyzing data linked to a set of selected managers considered key to the strategy of the company.
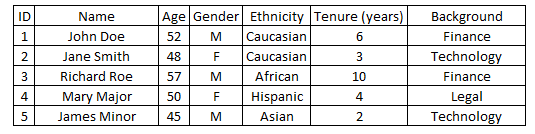
For instance, visuals can be built to analyze the diversity of the workforce using ethnicity distribution.
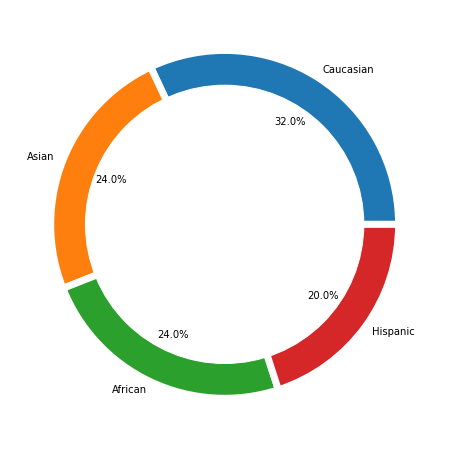
If I&N would like to promote gender equality, we can analyze the distribution of male and female managers by department.
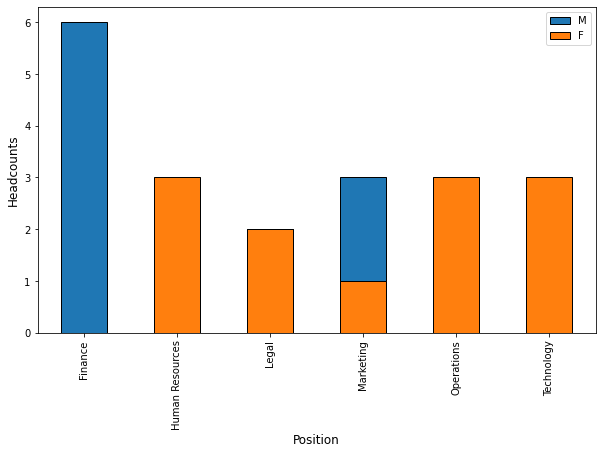
These visuals can help identify potential areas for improvement and make a strong case for diversity and inclusion, which is a key aspect of good governance.
In the next section, we will see how advanced analytics can help companies overcome the challenges of ESG reporting.
Advanced Analytics for ESG Reporting
ESG reporting can be complex due to the lack of standardisation in reporting practices and the difficulties in ensuring data accuracy.
Lack of Standardisation
The first is the lack of standardised reporting frameworks, which can lead to inconsistencies in how different companies report their ESG performance.
For example, two companies may measure their environmental impact in completely different ways
- Company 1 is a plastic toy manufacturer
- Company 2 sells fresh fruits in convenience stores
These two companies report plastic usage reduction
- -55% for company 2 by using carton packaging for some items
- -10% for company 1 by changing the design of toys
However, how can you evaluate the effort and impact when the first company uses plastic as a raw material for its products?
💡 How can data analytics support standardisation?
- Governmental entities can use databases of companies by industry and the environmental aspect of their products
- Automated data pipelines can extract, process and deploy standardised reports using data from different sources.
Now that you have a standard for your report, you must ensure that the data used is reliable.
Accuracy and Reliability of ESG Data
Maintaining quality can be an arduous task with data coming from many sources.
Business Intelligence (BI) provides capabilities to process and analyze large volumes of data from different systems to support ESG reporting.
- Flat files from external suppliers, utility bills or operational files
- Manufacturing data from factories’ management systems
- Logistics and retail operations data from ERPs, WMS and TMS
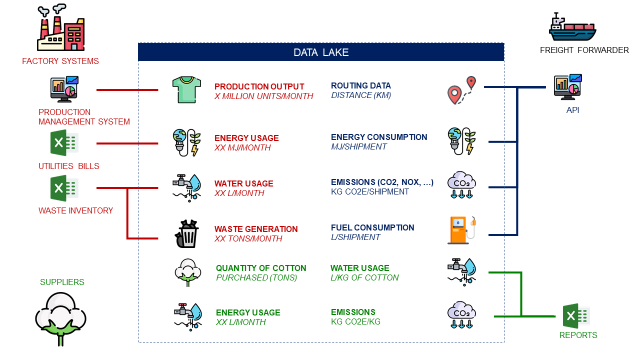
In the example above, this data architecture is used to extract, process and store data to perform a Life Cycle Assessment.
The idea is to estimate the impact of an item sold by
- Linking production output quantity with energy and resource usage
- Estimating CO2 and pollutant emissions from production to transportation
- Including additional non-financial indicators from suppliers and logistic operations
The ultimate goal is to automate the calculation of ESG indicators across the life cycle of products, from raw material extraction to disposal.
This can also support the traceability of the data used for your report.
For instance, I have implemented a system using file hashing to prove that a data source (from a freight forwarder) has not been modified during CO2 emissions calculations.
As you may be audited, it is important to show data sources and prove that results have not been manipulated.
Data Science as a Game Changer
Beyond measuring and reporting, these technologies can help your organization use the data generated by systems to get
- Prescriptive insights to support decision-making: select a supplier, budget allocation, supply chain network design
- Predictive analytics to help firms anticipate and mitigate future ESG risks
Example 1: Sustainable Sourcing
This is the process of integrating social, ethical and environmental performance factors when selecting suppliers of products or services.
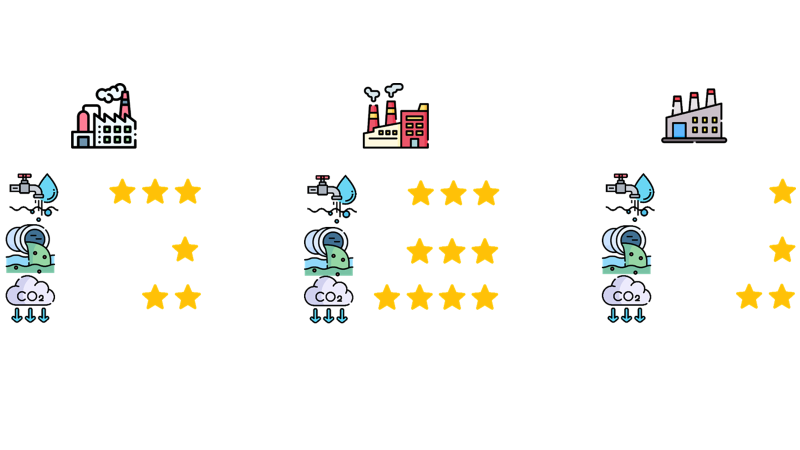
For each supplier, I&N has a set of scores measuring
- Usage of natural resources (water, cotton)
- Pollutants and CO2 emissions
- Social and governance compliance
With advanced analytics, you can automate the full process of
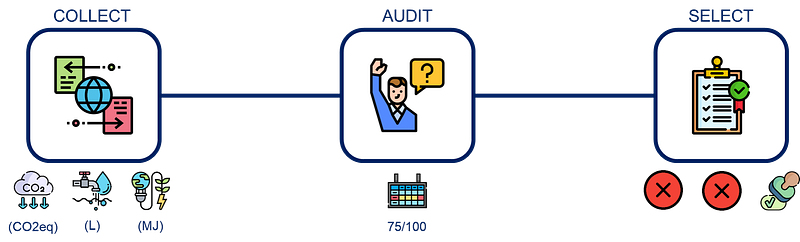
- Collection of data from suppliers
Example: sustainability KPIs (CO2, natural resources, Environmental Footprint), social and governance indicators - Suppliers' assessment based on ESG and business indicators
Example: fixed and variable costs, quality, and social responsibility - Decision-making using linear programming
Example: decide the set of suppliers that minimize the profit while respecting minimum levels of ESG scores
This is a real game-changer as it can help procurement teams align their sourcing strategy with the company's ESG roadmap.
💡 For more details about analytics for sustainable sourcing,
- What is Sustainable Sourcing?
Example 2: ESG-Friendly Budget Planning
Linear programming can also help you direct your investments in projects that will help support the company’s ESG roadmap.
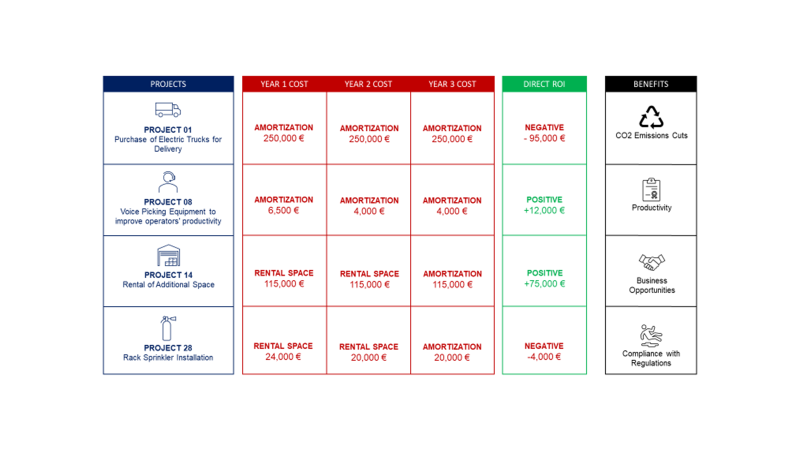
Let us imagine the budget allocation scenario of an international logistics company.
A Regional Director receives budget applications from 17 warehouse managers for projects impacting the next three years.
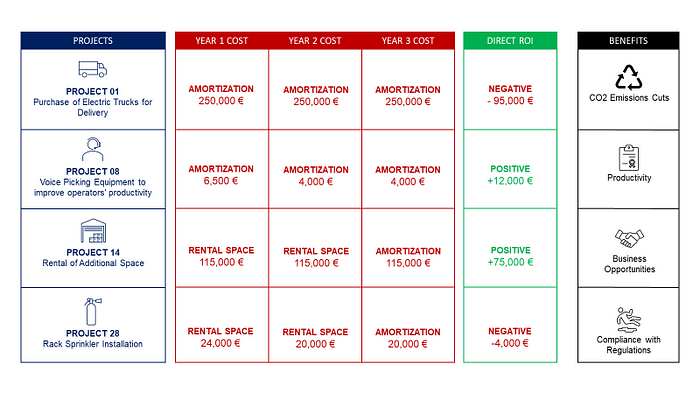
For each budget application, the manager includes
- A description of the project (equipment purchase, renovation, …)
- Yearly budget for the next three years
- Return On Investment = (Cost Reduction + Additional Turnover) — (Total Cost)
- Additional benefits impacting business development, productivity or ESG indicators
Our director must decide which project(s) to allocate her budget to based on financial factors (ROI) and ESG criteria.
How to maximize the Return On Investment while meeting ESG requirements?
With linear programming, we can automate the selection of projects that maximise ROI while respecting constraints on CSR, HSE, or sustainability.
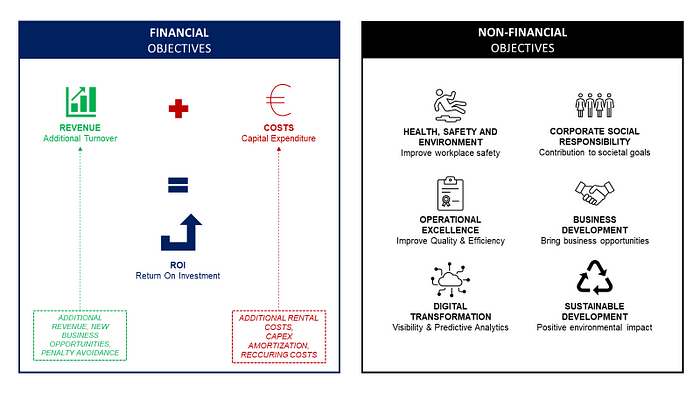
- Parameters: boolean values for each project (1: selected, 0: not selected)
- Constraints: business development and ESG benefits
- Objective function: maximise the ROI
By aligning the ESG targets set by top management, our director can ensure that the selected projects support the company’s long-term strategy.
💡 For more details about ESG-friendly budget planning,
- Automate Budget Planning Using Linear Programming
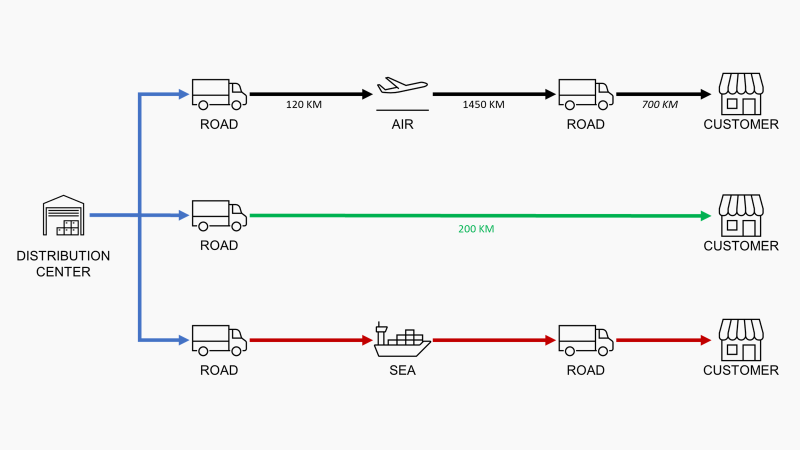
Example 3: Supply Chain Network Optimisation
A great way to improve your ESG score is to boost your green and ethical transformation.
Sustainable Supply Chain Optimisation is an approach that combines cost-effectiveness with sustainability.
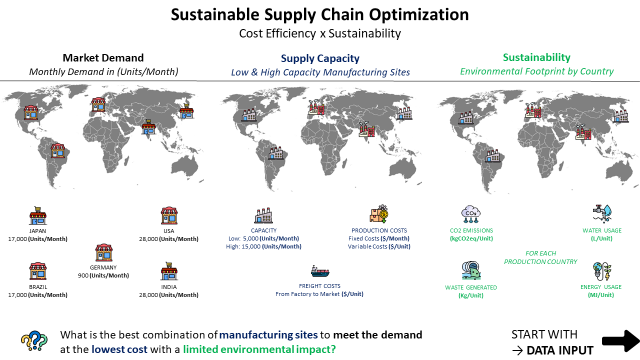
You have,
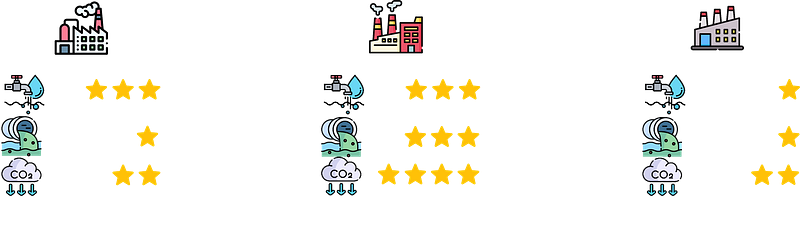
- Demand for each market location in (Units/Month)
- A set of potential manufacturing sites with different production costs, environmental impacts, social and governance scores
- Constraints on environmental footprint per unit, social and governance scores
What is the most sustainable (and economically viable ) combination?
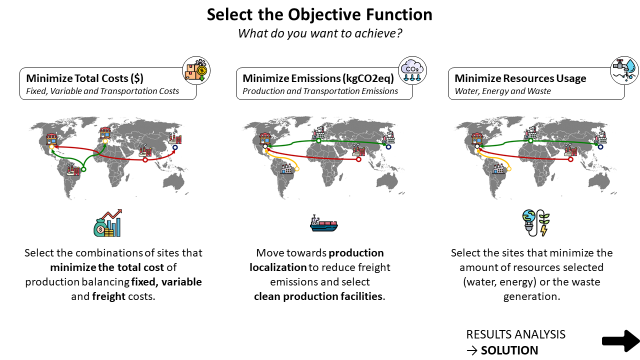
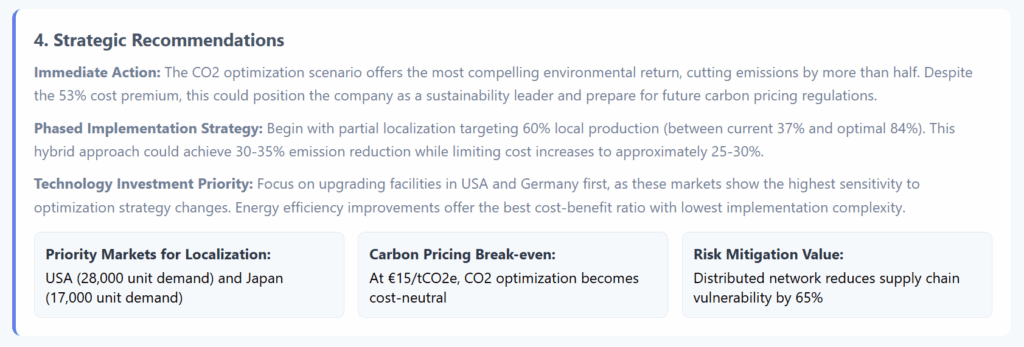
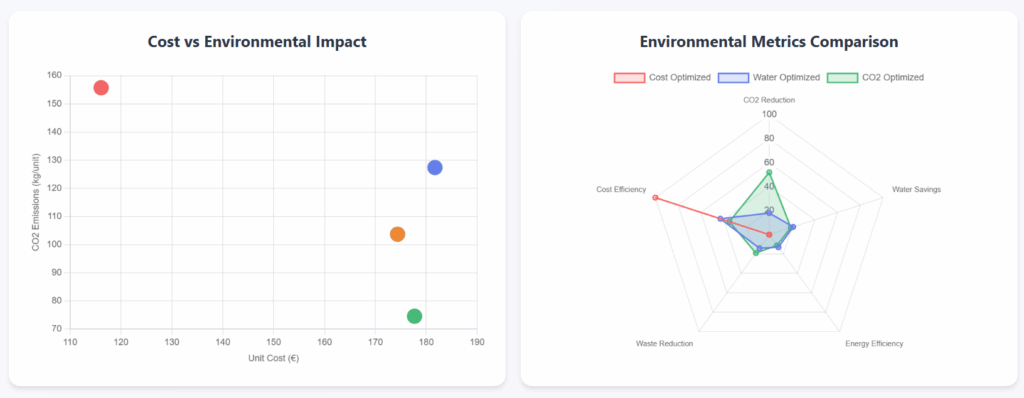
With advanced analytics, you can design a tool to test several scenarios
- What if I want to minimise costs?
Can I meet my ESG targets? - What if I want to minimise CO2 emissions?
Can I keep my profitability level?
I have implemented such a model on a web application deployed online:
- Upload your market demand data (Units) per Market
- Add your manufacturing footprint data: factories by location with (costs, CO2 emissions, resource usage and Social Scores)
- Select the objective function: minimise the cost, CO2 emissions or resource usage
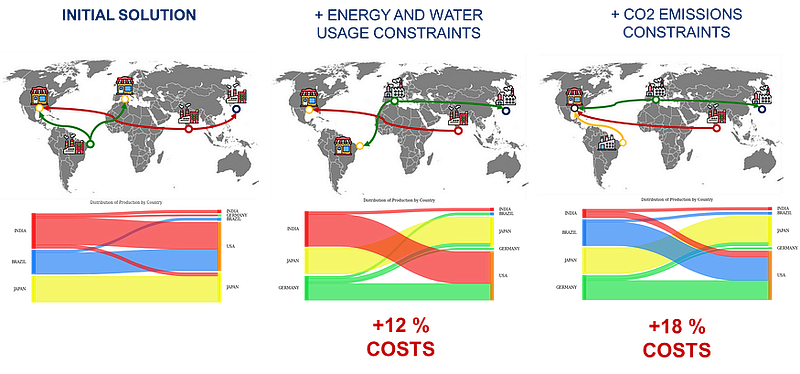
You can quickly switch between objectives to decide which solution is most viable.
You can even link this tool to AI agents that will run multiple scenarios and provide insights.
This is what we did at LogiGreen: we equipped Claude (Anthropic's Model) with a productized version of the algorithm and asked the agent to run scenarios.
The results are mindblowing.
Claude understands the levers of optimisation and supports decision-making with data-backed insights.
For more details, check this video.
I hope these examples gave you an idea of how data analytics can help you to improve ESG reporting and reach the targets set by your top management.
Conclusion
As ESG reporting becomes increasingly prevalent, the role of data analytics in enhancing its accuracy and efficiency is set to grow.
The future may bring advanced solutions tailored to ESG reporting.
These solutions could automate the ESG reporting process, from data collection to analysis and decision-making.
By leveraging these tools, companies can improve their ESG reporting and gain valuable insights to drive their sustainability strategies.
About Me
Let’s connect on LinkedIn and Twitter. I am a Supply Chain Engineer using data analytics to improve logistics operations and reduce costs.
If you’re looking for tailored consulting solutions to optimize your supply chain and meet sustainability goals, feel free to contact me.