Sustainable Business Strategy with Data Analytics
Use data analytics to help companies design and implement strategic sustainability roadmaps to reduce their environmental footprint.
Use data analytics to help companies design and implement strategic sustainability roadmaps to reduce their environmental footprint.
Consensus means that everyone agrees to say collectively what no one believes individually.
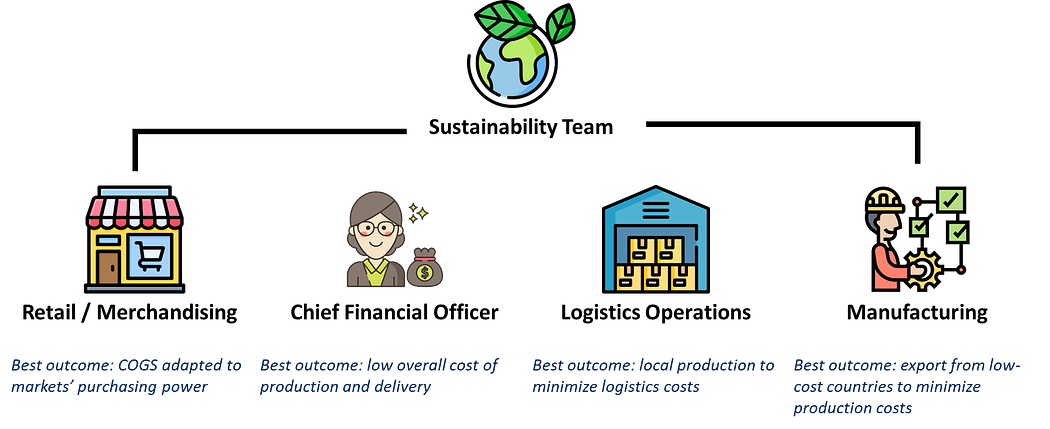
This quote captures a critical issue many companies face during their strategic green transformation: aligning diverse objectives across teams and departments.
Sustainability Team: “We need to reduce emissions by 30%”.
Imagine a hypothetical manufacturing company with, at the centre of its business strategy, an ambitious target of reducing CO2 emissions by 30%.

The sustainability team's challenge is to enforce process changes that may disrupt the activities of multiple departments along the value chain.

How do you secure the approval of multiple stakeholders, that potentially have conflicting interests?
In this article, we will use this company as an example to illustrate how analytics models can support a sustainable business strategy.
How to Build a Sustainability Roadmap?
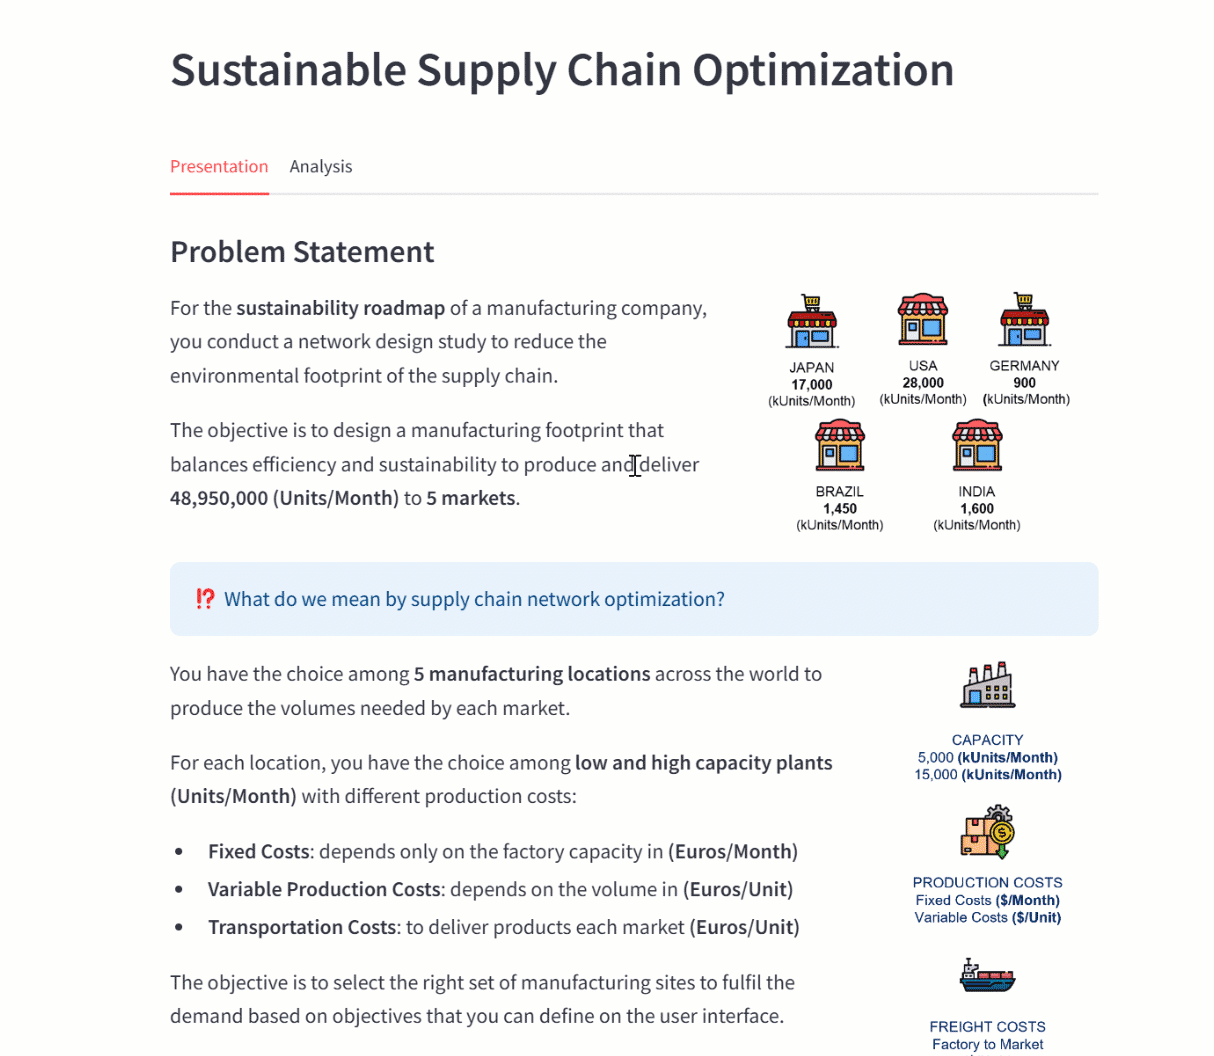
You are a Data Science Manager in the Supply Chain department of this international manufacturing group.
Under pressure from shareholders and European regulations, your CEO set ambitious targets for reducing the environmental footprint by 2030.
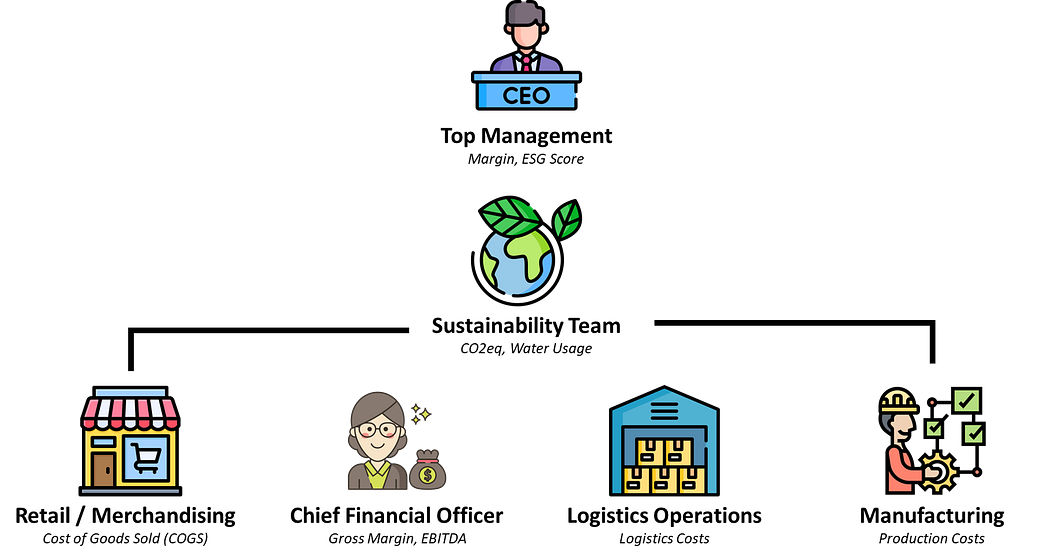
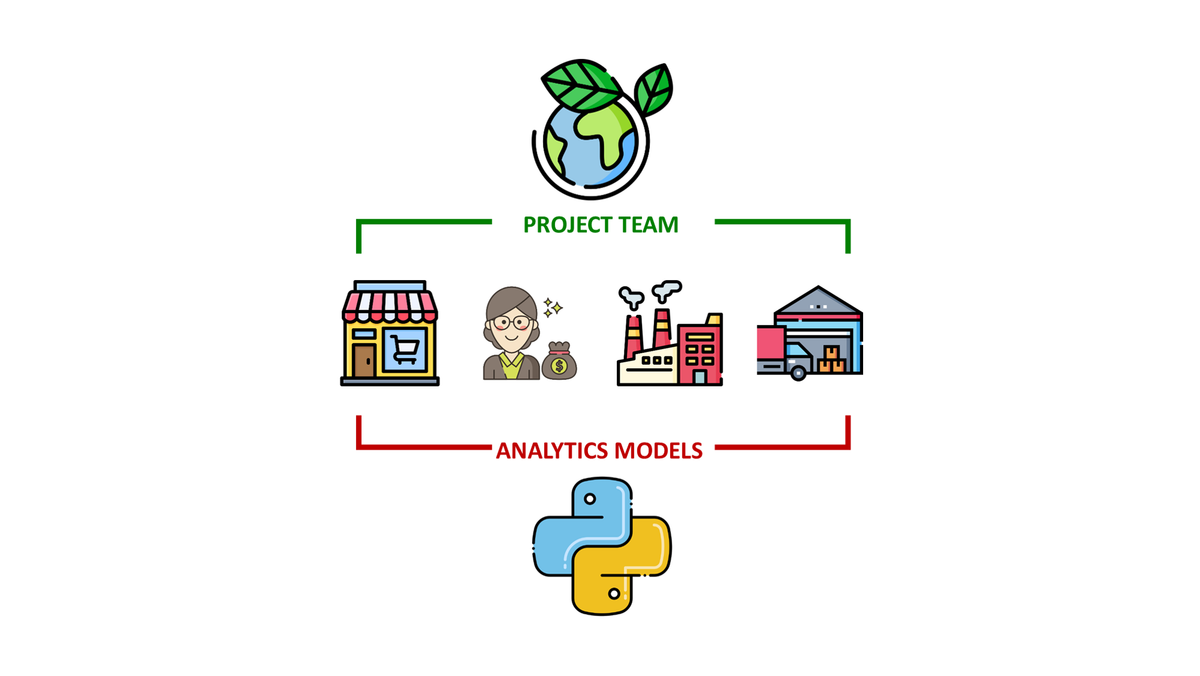
The sustainability department leads a cross-functional transformation program that brings together multiple departments to implement green initiatives.
Sustainable Supply Chain Network Optimisation
To illustrate my point, I will focus on Supply Chain Network Optimisation.
The objective is to redesign the network of factories to meet market demand while optimizing cost and environmental footprint.

The total demand is 48,950 units per month, spread across five markets: Japan, the USA, Germany, Brazil, and India.
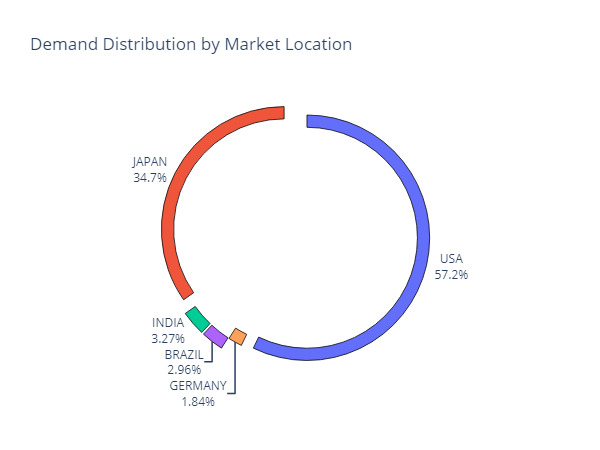
Markets can be categorised based on customer purchasing power:
- High-price markets (USA, Japan and Germany) account for 93.8% of the demand but have elevated production costs.
- Low-price markets (Brazil and India) only account for 6.2% of the demand, but production costs are more competitive.
What do we want to achieve?
Meet the demand at the lowest cost with a reasonable environmental footprint.
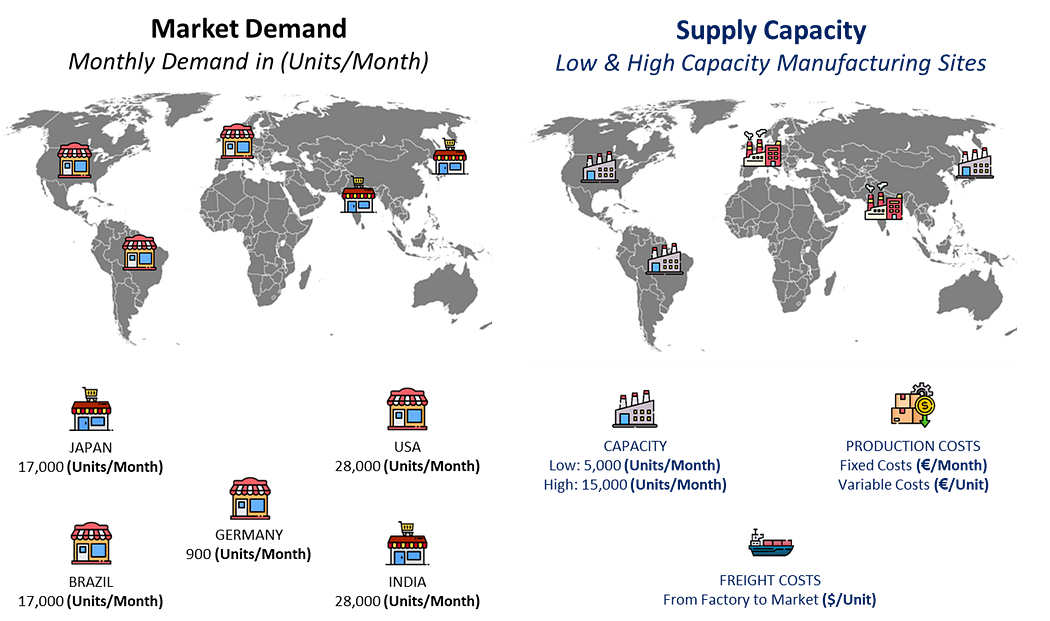
We must decide where to open factories to balance cost and affect a location's competitivenessnvironmental impacts (CO2 Emissions, waste, water and energy usage).
Manufacturing Capacity
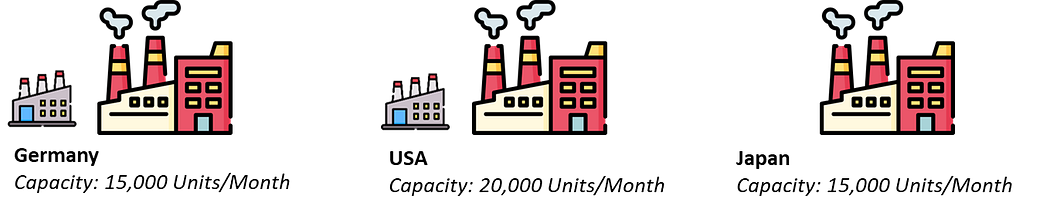
In each location, we can open low or high-capacity plants.
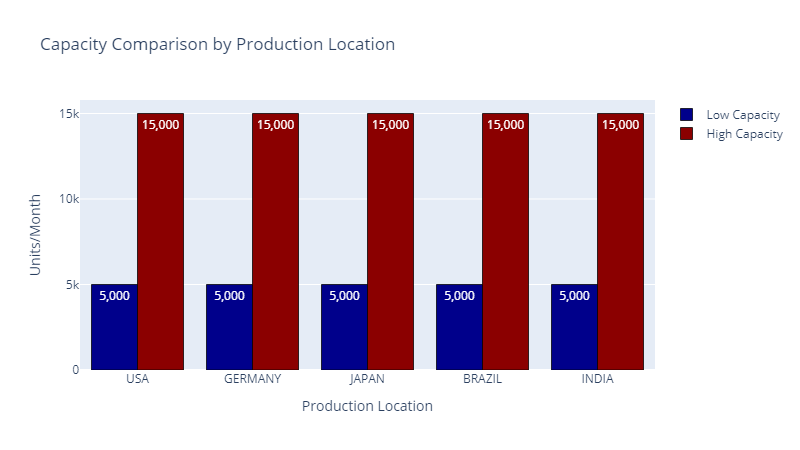
Fixed Production Costs
High-capacity plants have elevated fixed costs but can achieve economies of scale.
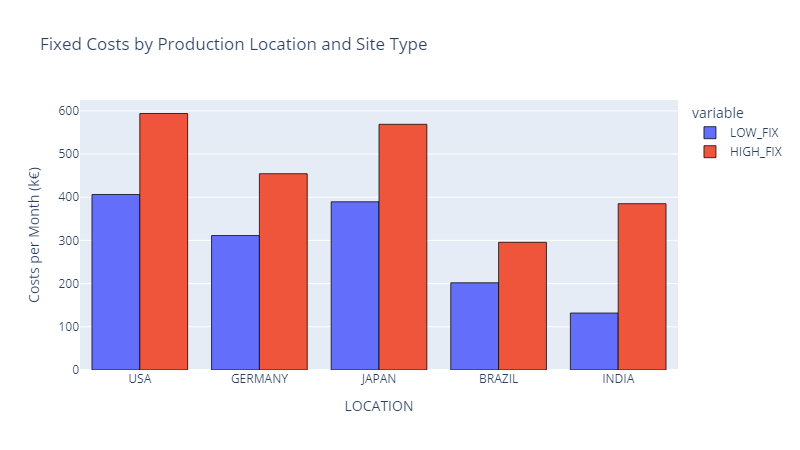
A high-capacity plant in India has lower fixed costs than a low-capacity plant in the USA.
Fixed costs per unit are lower in an Indian high-capacity plant (used at full capacity) than in a US low-capacity factory.
Variable Costs
Variable costs are mainly driven by labour costs, which affect a location's competitiveness.
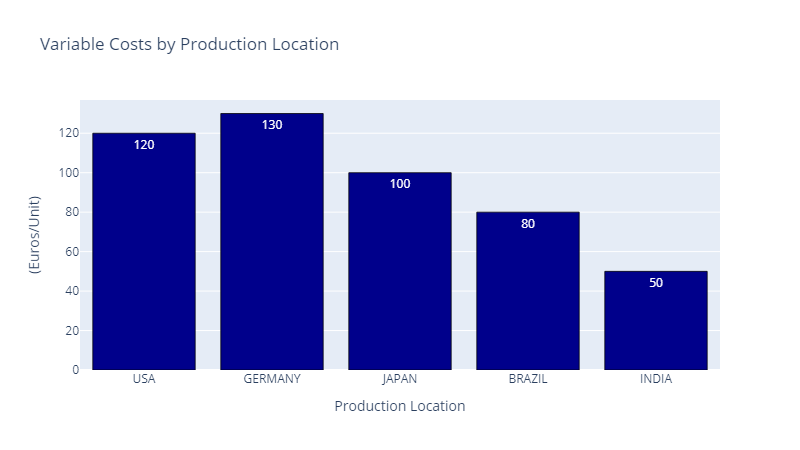
However, we need to add freight delivery rates from the factory to the markets in addition to production costs.
If you move the production (for the North American market) from the USA to India, you will reduce production costs but incur additional freight costs.
What about the environmental impacts?
Manufacturing teams collected indicators from each plant to calculate the impact per unit produced.
- CO2 emissions of the freight are based on the distance between the plants and their markets.
- Environmental indicators include CO2 emissions, waste generated, water consumed and energy usage.
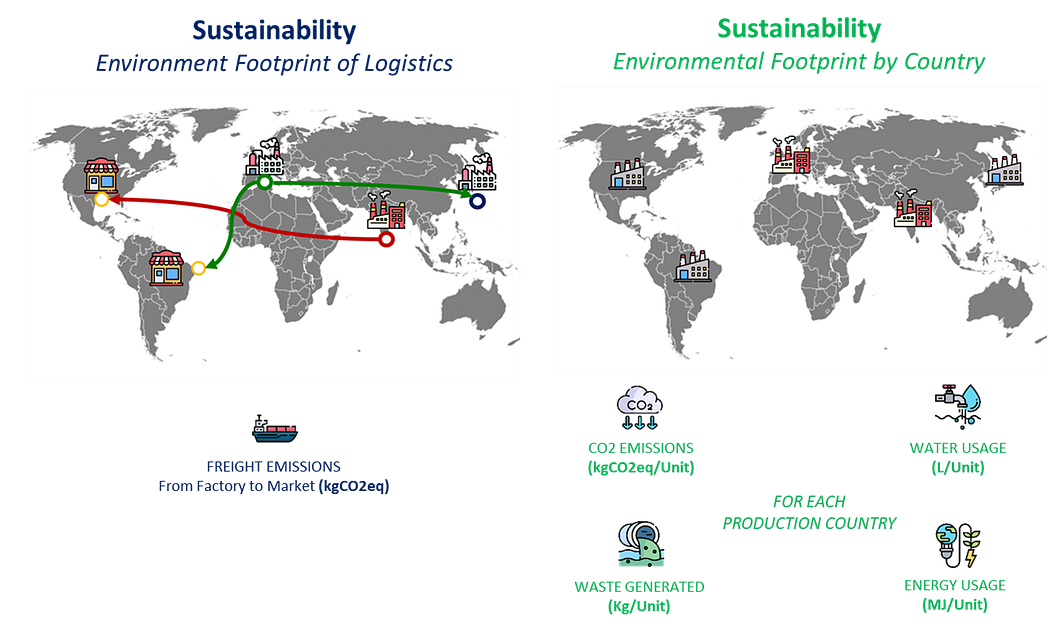
We take the average output per unit produced to simplify the problem.
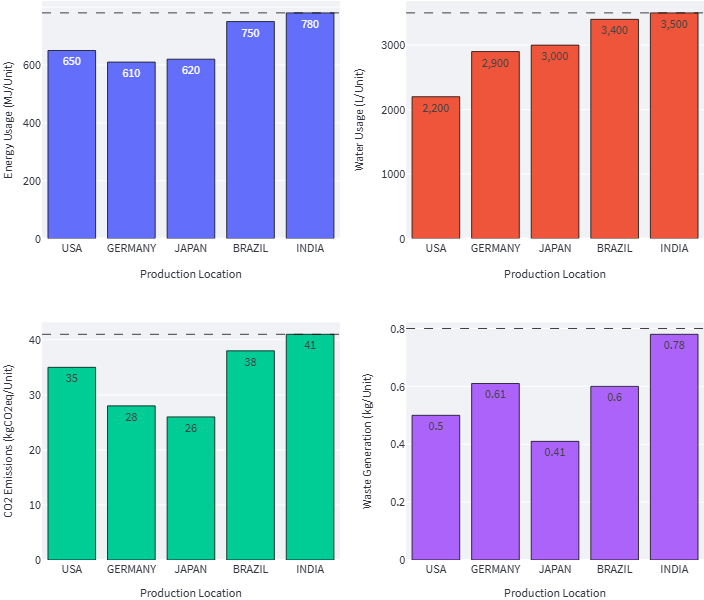
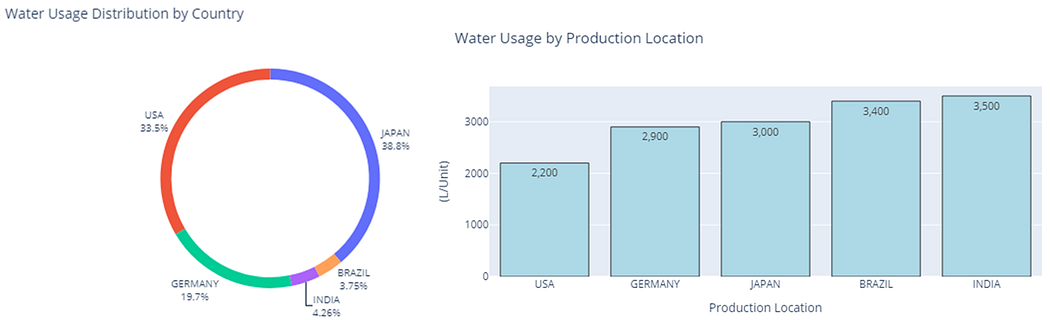
For instance, producing a single unit in India requires 3,500 litres of water.
To summarise these four graphs, high-cost manufacturing locations are “greener” than low-cost locations.
You can sense the conflicting interests of reducing costs and minimising environmental footprint.
What is the optimal footprint of factories to minimize CO2 Emissions?
Data-driven Supply Chain Network Design
If we aim to reduce the environmental impact of our production network, the trivial answer is to produce only in high-end “green” facilities.
Unfortunately, this may raise additional questions:
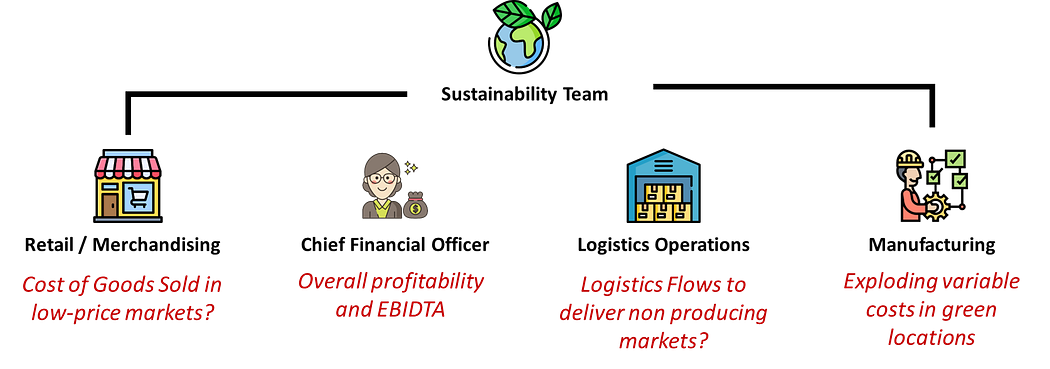
- Logistics Department: What about the CO2 emissions of transportation for countries that don’t have green facilities?
- Finance Team: How much will the overall profitability be impacted if we move to costly facilities?
- Merchandising: If you move production to expensive “green” locations, what will happen to the cost of goods sold in India and Brazil?
These are questions that your steering committee may raise when the sustainability team pushes for a specific network design.
In the next section, we will simulate each initiative to measure the impact on these KPIs and give a complete picture to all stakeholders.
Data Analytics for Sustainable Business Strategy
In another article, I introduce the model we will use to illustrate the complexity of this exercise with two scenarios:
- Scenario 1: Your finance director wants to minimise the overall costs
- Scenario 2: sustainability teams push to minimise CO2 emissions
Model outputs will include financial and operational indicators to illustrate scenarios’ impact on KPIs, followed by each department.
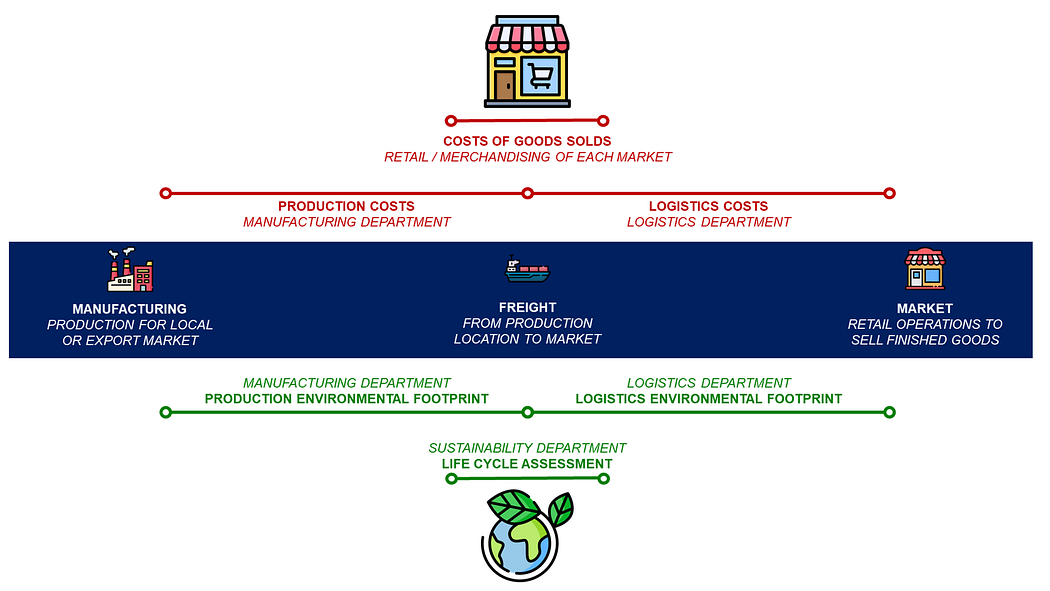
- logisticsManufacturing: CO2 emissions, resource usage and cost per unit
- Logistics: freight costs and emissions
- Retail / Merchandising: Cost of Goods Sold (COGS)
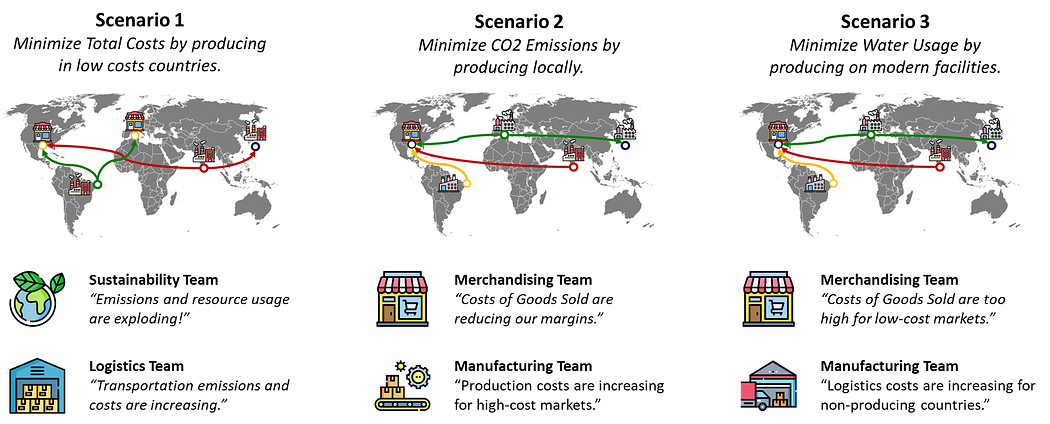
As we will see in the different scenarios, each scenario can be favourable for some departments and detrimental for others.
Do you imagine a logistics director, pressured to deliver on time at a minimal cost, accepting the disruption of her distribution chain for a random sustainable initiative?
Data (may) help us to find a consensus.
Scenario 1: Minimise Costs of Goods Sold
I propose to fix the baseline with a scenario that minimises the Cost of Goods Sold (COGS).
The model found the optimal set of plants to minimise this metric by opening four factories.
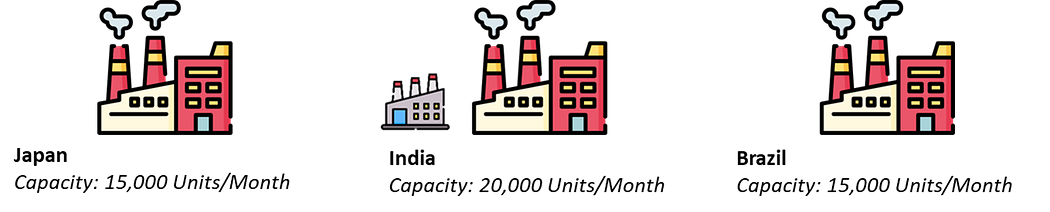
- Two factories in India (low and high) will supply 100% of local demand and use the remaining capacity for the German, US, and Japanese markets.
- A single high-capacity plant in Japan is dedicated to meeting (partially) the local demand.
- A high-capacity factory in Brazil for its market and export to the USA.
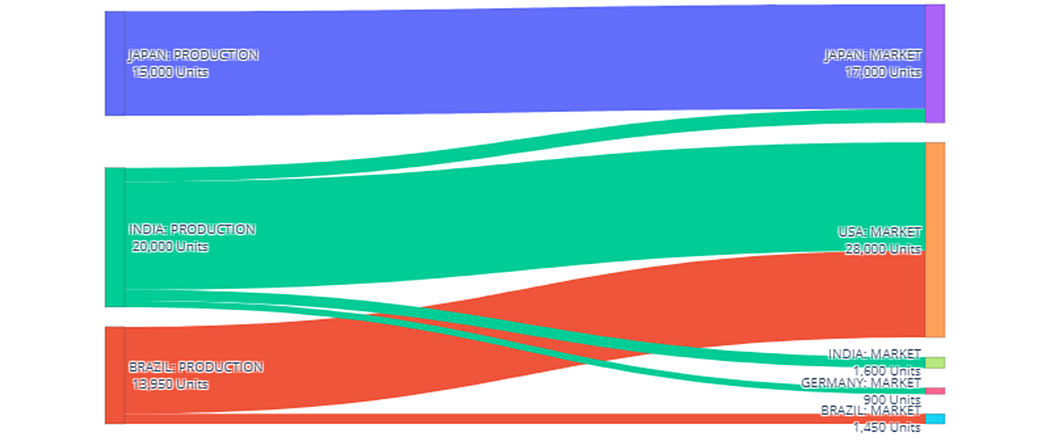
- Local Production: 10,850 Units/Month
- Export Production: 30,900 Units/Month
With this export-oriented footprint, our total cost is 5.68 M€/month, including production and transportation.
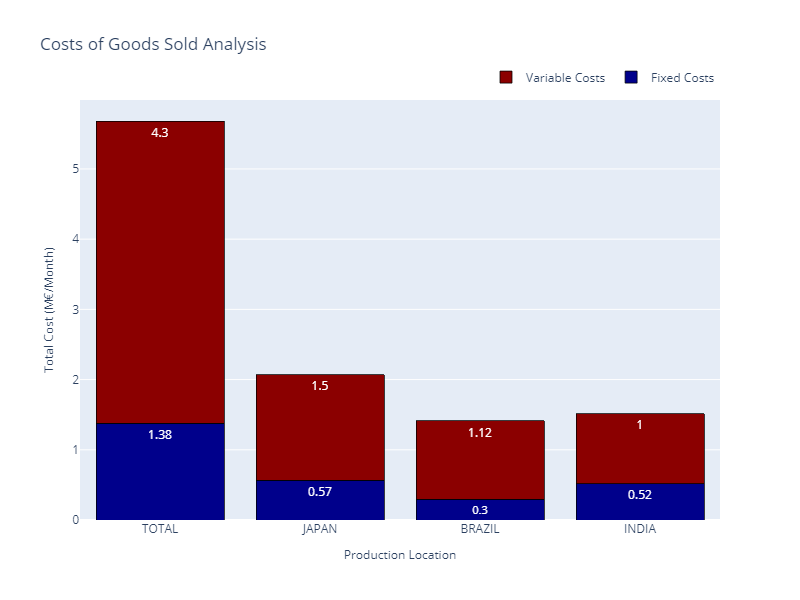
The good news is that the model allocation is optimal; all factories are used at maximum capacity.
What about the Costs of Goods Sold (COGS)?
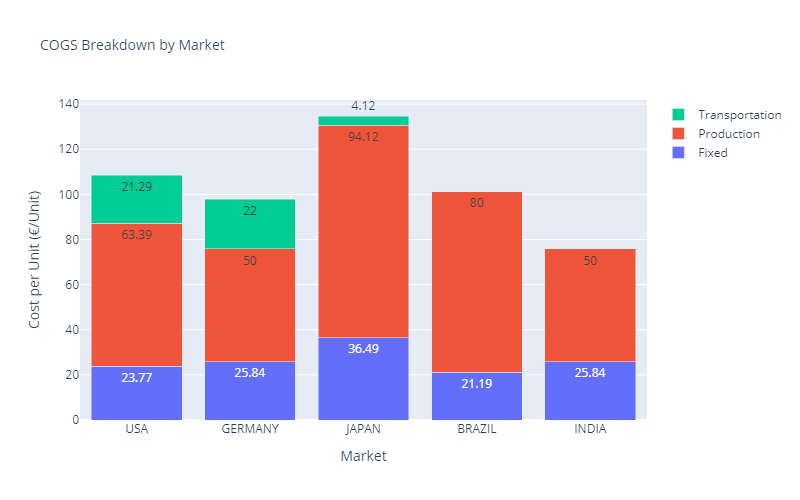
Except for the Brazilian market, the costs of goods sold are roughly in line with the local purchasing power.
A step further would be to increase India's production capacity or reduce Brazil's factory costs.
From a cost point of view, it seems perfect. But is it a good deal for the sustainability team?
The sustainability department is raising the alert as CO2 emissions are exploding.
We have 5,882 (Tons CO2eq) of emissions for 48,950 Units produced.
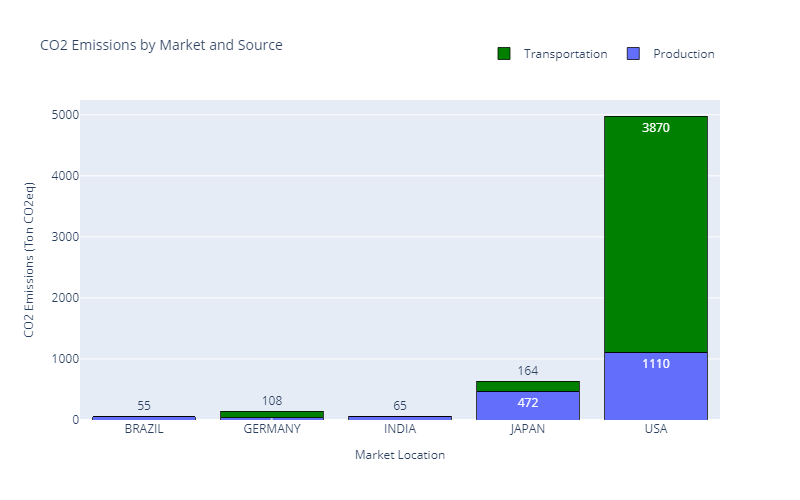
Most of these emissions are due to the transportation from factories to the US market.
The top management is pushing to propose a network transformation to reduce emissions by 30%.
What would be the impact on production, logistics and retail operations?
Scenario 2: Localisation of Production
We switch the model’s objective function to minimise CO2 emissions.
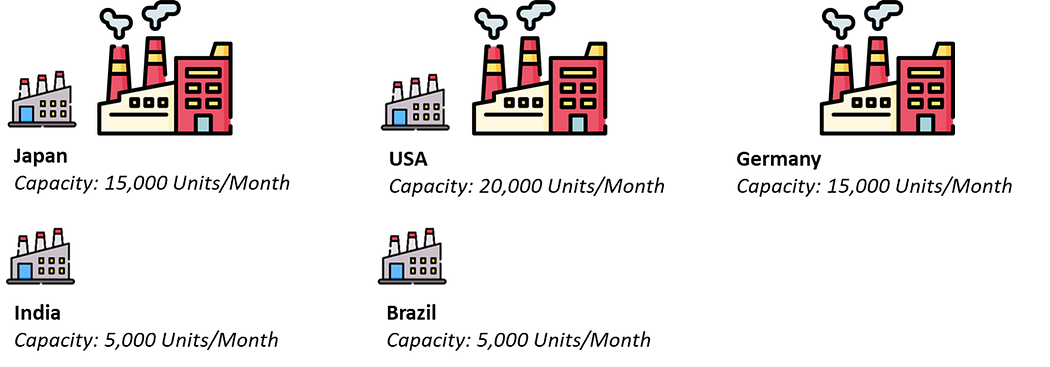
As transportation is the major driver of CO2 emissions, the model proposes to open seven factories to maximize local fulfilment.
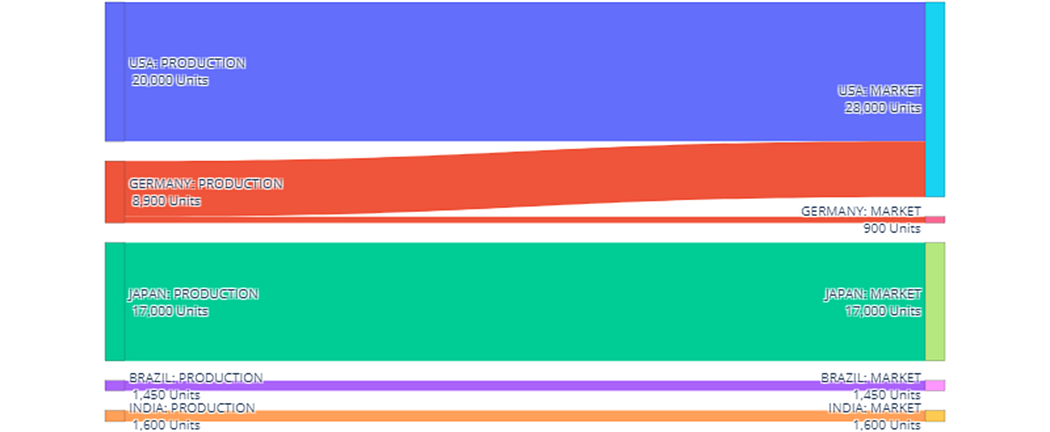
- Two low-capacity factories in India and Brazil fulfil their respective local markets only.
- A single high-capacity factory in Germany serves the local market and exports to the USA.
- We have two pairs of low and high-capacity plants in Japan and the USA dedicated to local markets.
From the manufacturing department's perspective, this setup is far from optimal.
We have four low-capacity plants in India and Brazil that are used way below their capacity.
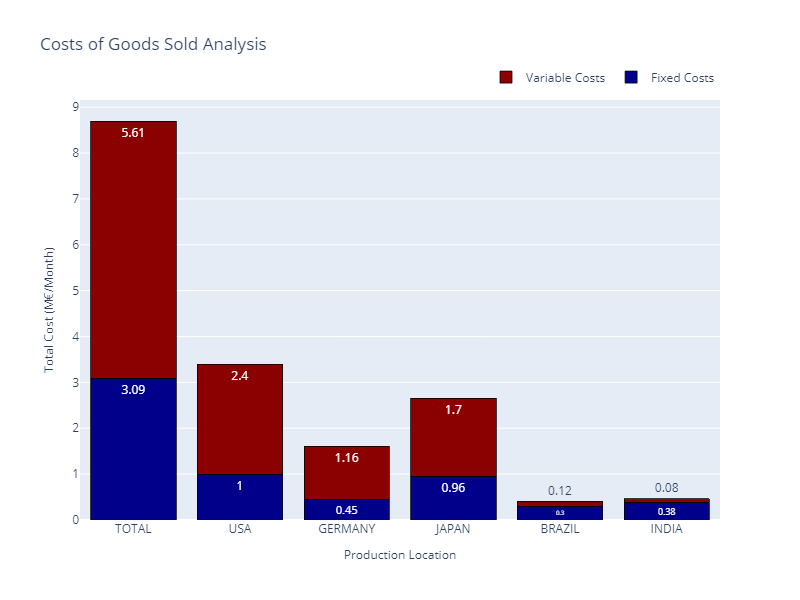
Therefore, fixed costs have more than doubled, resulting in a total budget of 8.7 M€/month (versus 5.68 M€/month for Scenario 1).
Have we reached our target of Emissions Reductions?
Emissions have dropped from 5,882 (Tons CO2eq) to 2,136 (Tons CO2eq), reaching the target fixed by the sustainability team.
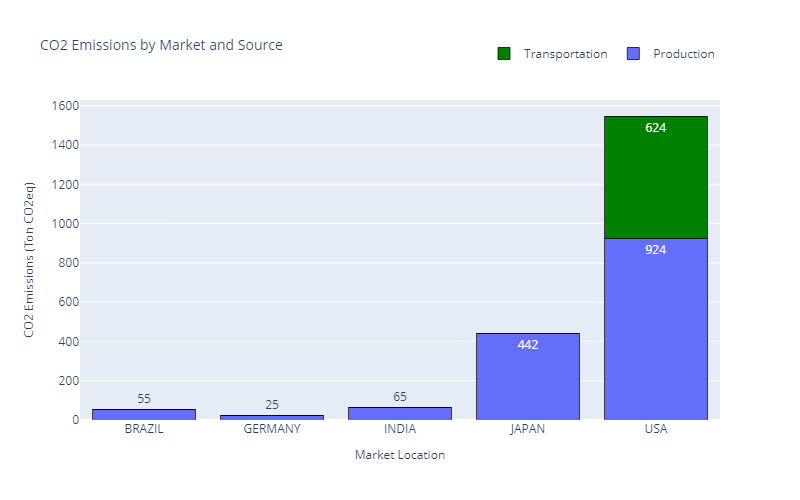
However, your CFO and the merchandising team are worried about the increased cost of sold goods.
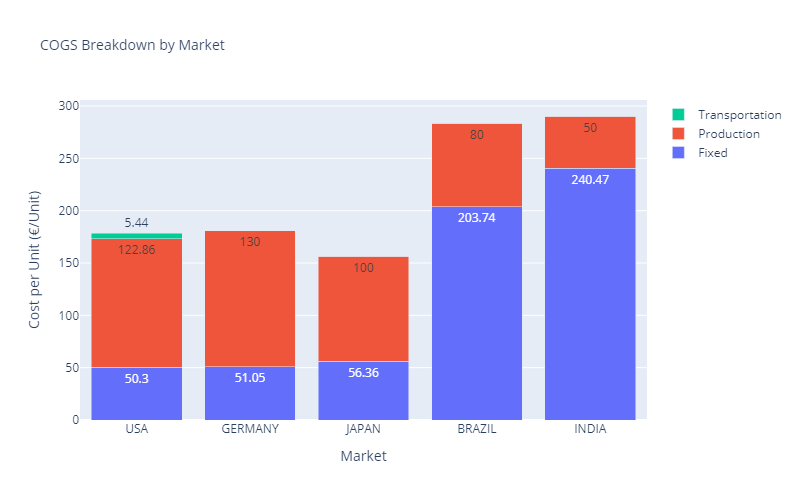
Because output volumes do not absorb the fixed costs of their factories, Brazil and India now have the highest COGS, going up to 290.47 €/unit.
However, they remain the markets with the lowest purchasing power.
Merchandising Team: “As we cannot increase prices there, we will not be profitable in Brazil and India.”
We are not yet done. We did not consider the other environmental indicators.
The sustainability team would like also to reduce water usage.
Scenario 3: Minimise Water Usage
With the previous setup, we reached an average consumption of 2,683 kL of Water per unit produced.
To meet the regulation in 2030, there is a push to reduce it below 2650 kL/Unit.
This can be done by shifting production to the USA, Germany and Japan while closing factories in Brazil and India.
Let us see what the model proposed.
It looks like the mirrored version of Scenario 1, with a majority of 35,950 units exported and only 13,000 units locally produced.
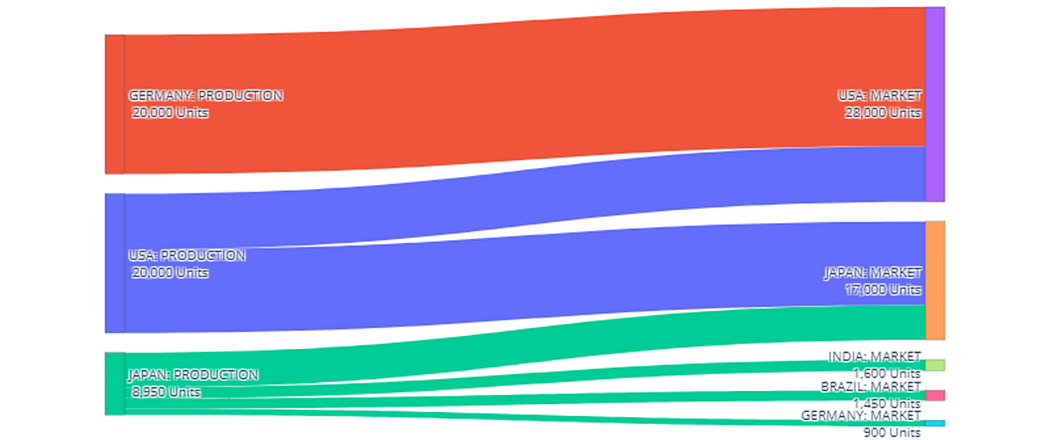
But now, production is pushed by five factories in “expensive” countries
- Two factories in the USA deliver locally and in Japan.
- We have two more plants in Germany, only to supply the USA market.
- A single high-capacity plant in Japan will be opened to meet the remaining local demand and deliver to small markets (India, Brazil, and Germany).
Finance Department: “It’s the least financially optimal setup you proposed.”
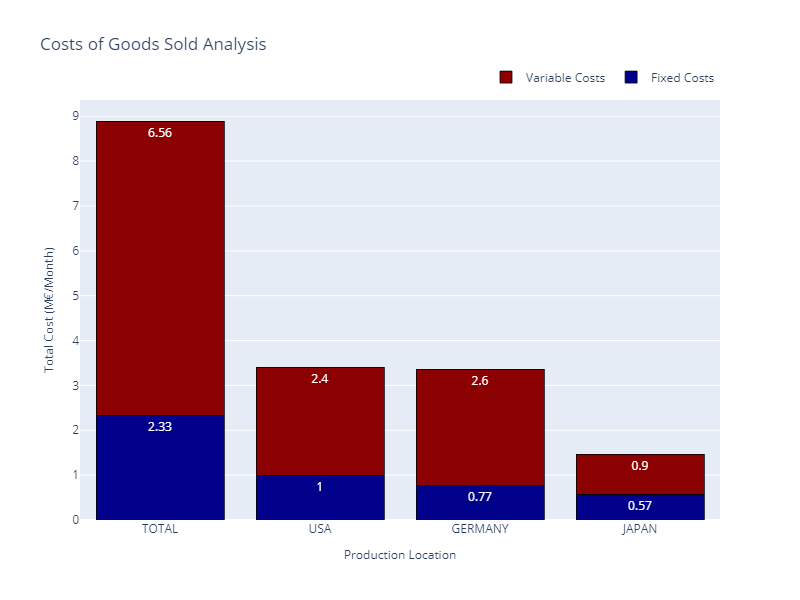
From a cost perspective, this is the worst-case scenario, as production and transportation costs are exploding.
This results in a budget of 8.89 M€/month (versus 5.68 M€/month for Scenario 1).
Merchandising Team: “Units sold in Brazil and India have now more reasonable COGS.”
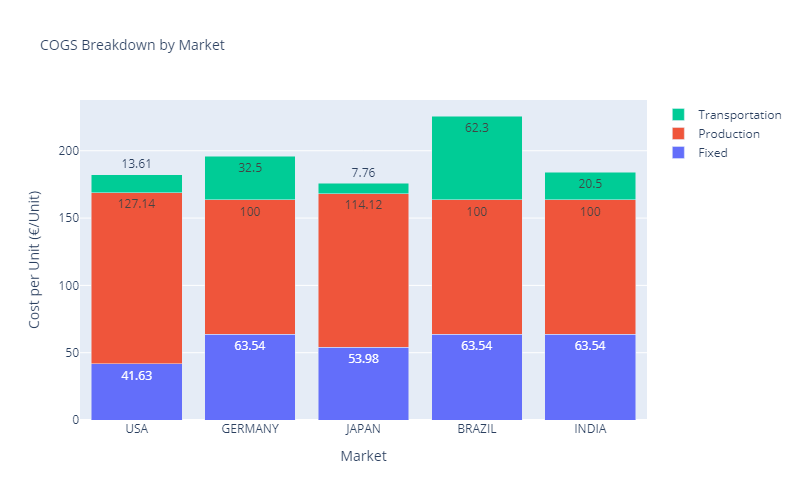
From a retail point of view, things are better than in Scenario 2 as the Brazil and India markets now have COGS in line with the local purchasing power.
However, the logistics team is challenged because we handle most of the volumes for export markets.
Sustainability Team: “What about water usage and CO2 emissions?”
Water usage is now 2,632 kL/Unit, below our target of 2,650 kL.
However, CO2 emissions exploded.
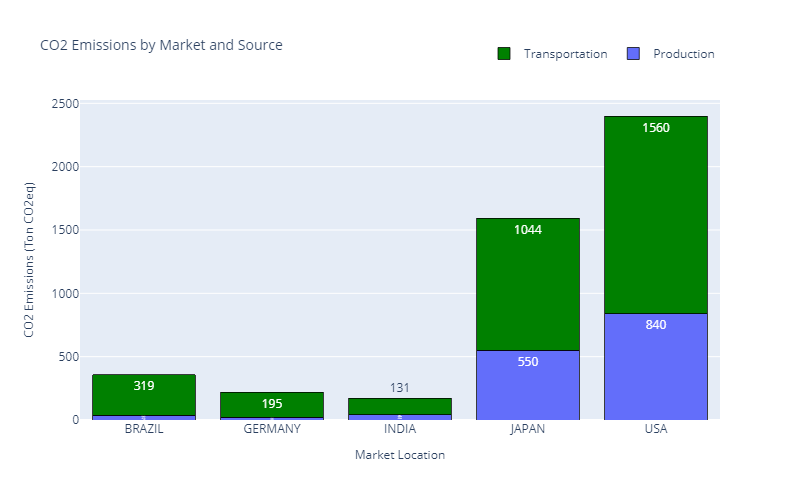
We returned to the Scenario 1 situation, with 4,742 (Tons CO2eq) of emissions (versus 2,136 (Tons CO2eq) for Scenario 2).
We can assume that this scenario is satisfying for no parties.
The difficulty of finding a consensus
As we observed in this simple example, we (as data analytics experts) cannot provide the perfect solution that meets every party's needs.
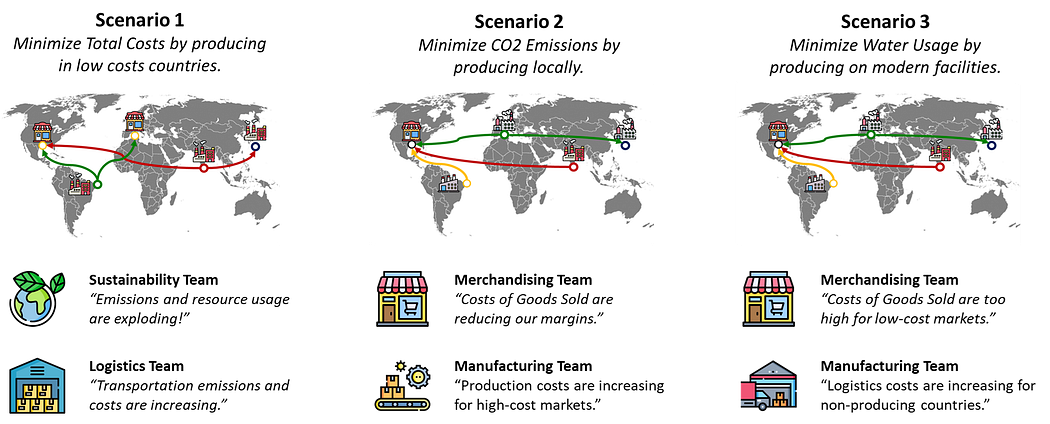
Each scenario improves a specific metric to the detriment of other indicators.
CEO: “Sustainability is not a choice, it’s our priority to become more sustainable.”
However, these data-driven insights will inform advanced discussions to reach a final consensus and move to implementation.
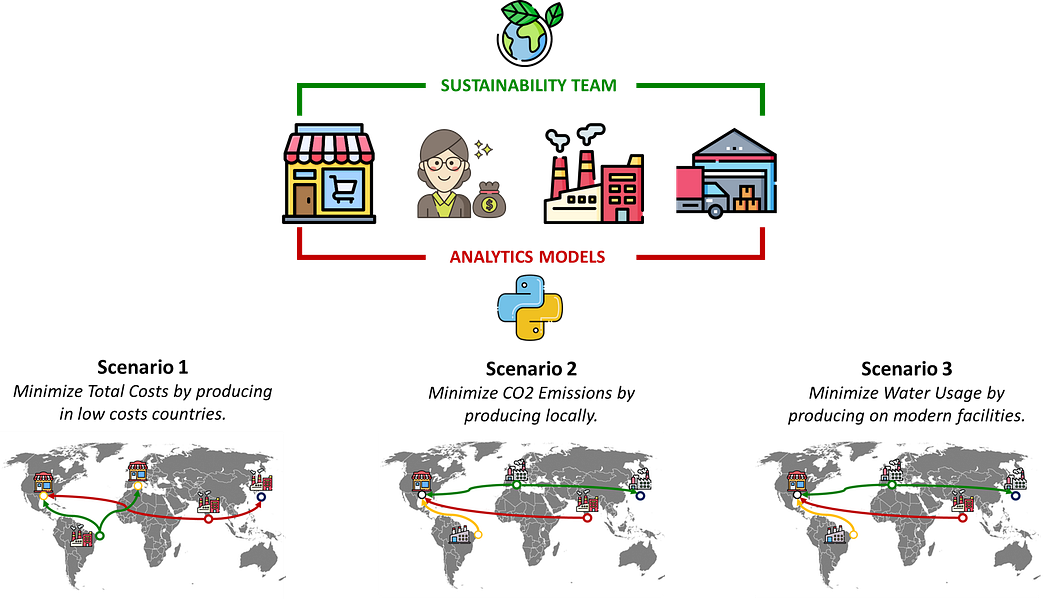
In this spirit, I developed this tool to address the complexity of company management and conflicting interests between stakeholders.
Conclusion
This article used a simple example to explore the challenges of balancing profitability and sustainability when building a transformation roadmap.
This network design exercise demonstrated how optimising for different objectives (costs, CO2 emissions, and water usage ) can lead to trade-offs that impact all stakeholders.
These examples highlighted the complexity of achieving consensus in sustainability transitions.
As analytics experts, we can play a key role on providing all the metrics to animate discussions.
The visuals and analysis presented are based on the Supply Chain Optimisation module of a web application I have designed to support companies in tackling these multi-dimensional challenges.
How to reach a consensus among stakeholders?
To prove my point, I used extreme examples in which we set the objective function to minimise CO2 emissions or water usage.
Therefore, we get solutions that are not financially viable.
Using the app, you can do the exercise of keeping the objective of cost efficiency and add sustainability constraints like
- CO2 emissions per unit produced should be below XX (kgCO2eq)
- Water usage per unit produced
This may provide more reasonable solutions that could lead to a consensus.
Can we have the support of Generative AI?
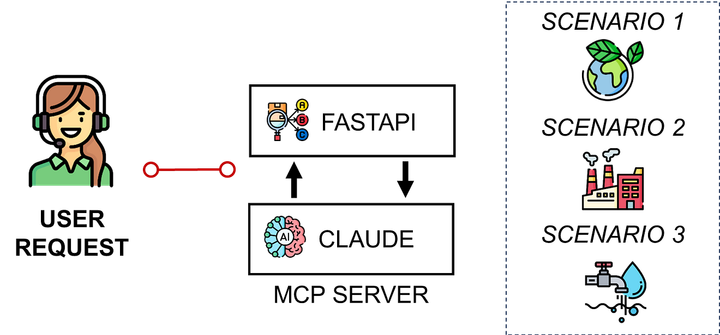
In an experiment, I decided to connect this model to Claude via an MCP implementation.
The idea was to leverage this model to automatically test multiple scenarios and process the results.
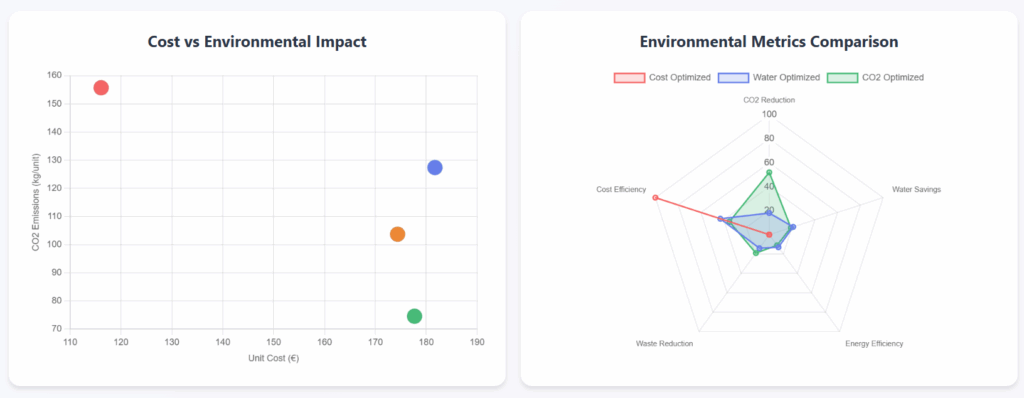
The ability of Claude Opus 4.5 to understand the optimization levers and the balance to have between cost and sustainability is remarkable.
For more details, I share the results of this experiment in this video.
Logistics Operations: We need support to implement this transformation.
What’s next?
Your contribution to the sustainability roadmap can be greater than providing insights for a network design study.
In this blog, I shared several case studies using analytics to design and implement sustainable initiatives across the value chain.
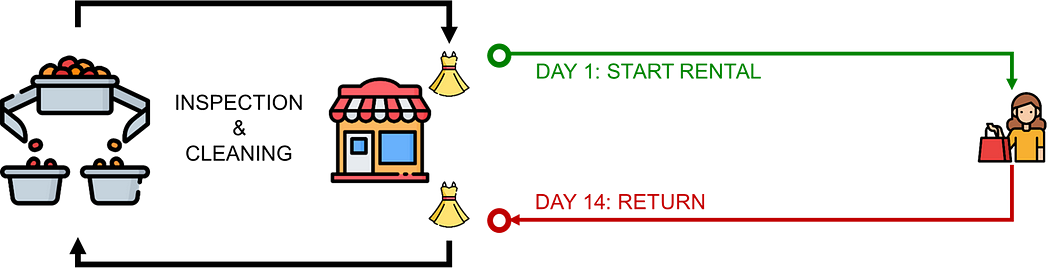
For instance, you can contribute to implementing a circular economy by estimating the impact of renting products in your stores.
A circular economy is an economic model that aims to minimize waste and maximize resource efficiency.
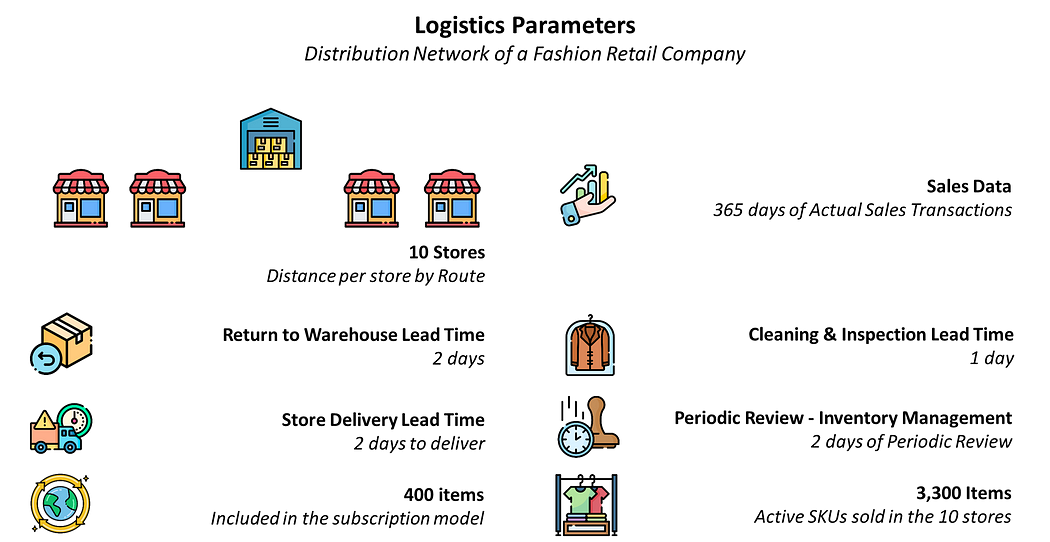
In a detailed case study, I present a model for simulating logistics flows covering 3,300 unique items rented across 10 stores.
Results show that you can reduce emissions by 90% for some references in the catalogue.
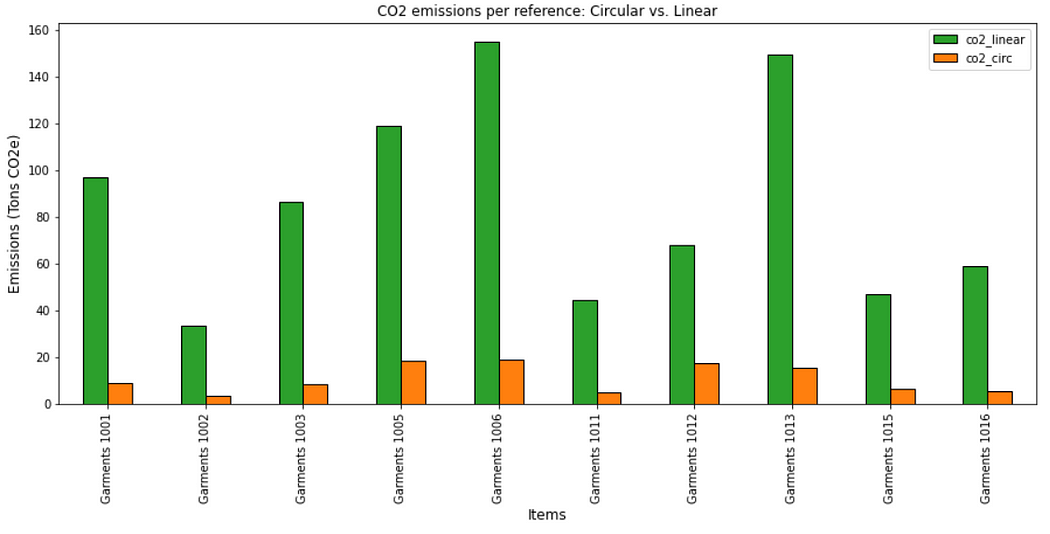
These insights can convince the management to invest in implementing the additional logistics processes required to support this model.
For more information, have a look at the complete article
 Samir Saci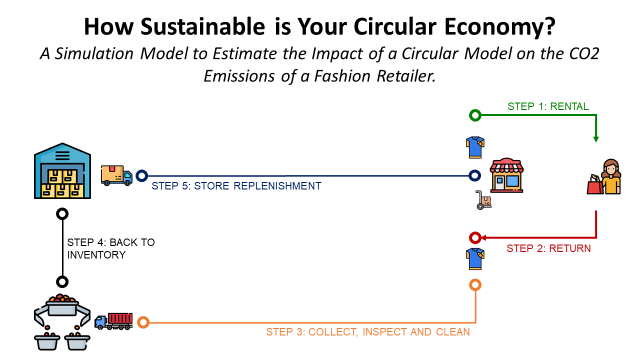
About Me
Let’s connect on LinkedIn and Twitter. I am a Supply Chain Data Scientist who uses data analytics to improve logistics operations and reduce costs.