Lead Times Variability and Supply Chain Resilience
Understand the sources of lead times variability and its impact on the robustness of your inventory management strategies.
For a retail group, inventory managers build replenishment policies to minimise stock levels and reduce ordering costs while avoiding shortages.
They need to consider the distribution of demand and the lead times for replenishing stores.
However, they often assume a constant lead time based on targets fixed with suppliers and logistics teams.
In this article, we will understand how process variability can lead to longer lead times and break the resilience of your supply chain.
💌 New articles straight to your inbox for free: Newsletter
If you prefer watching, have a look at the video version
Inventory Management & Lead Time
As an Inventory Manager of an international fashion retail chain, you are in charge of setting replenishment rules in the ERP.
Demand Variability
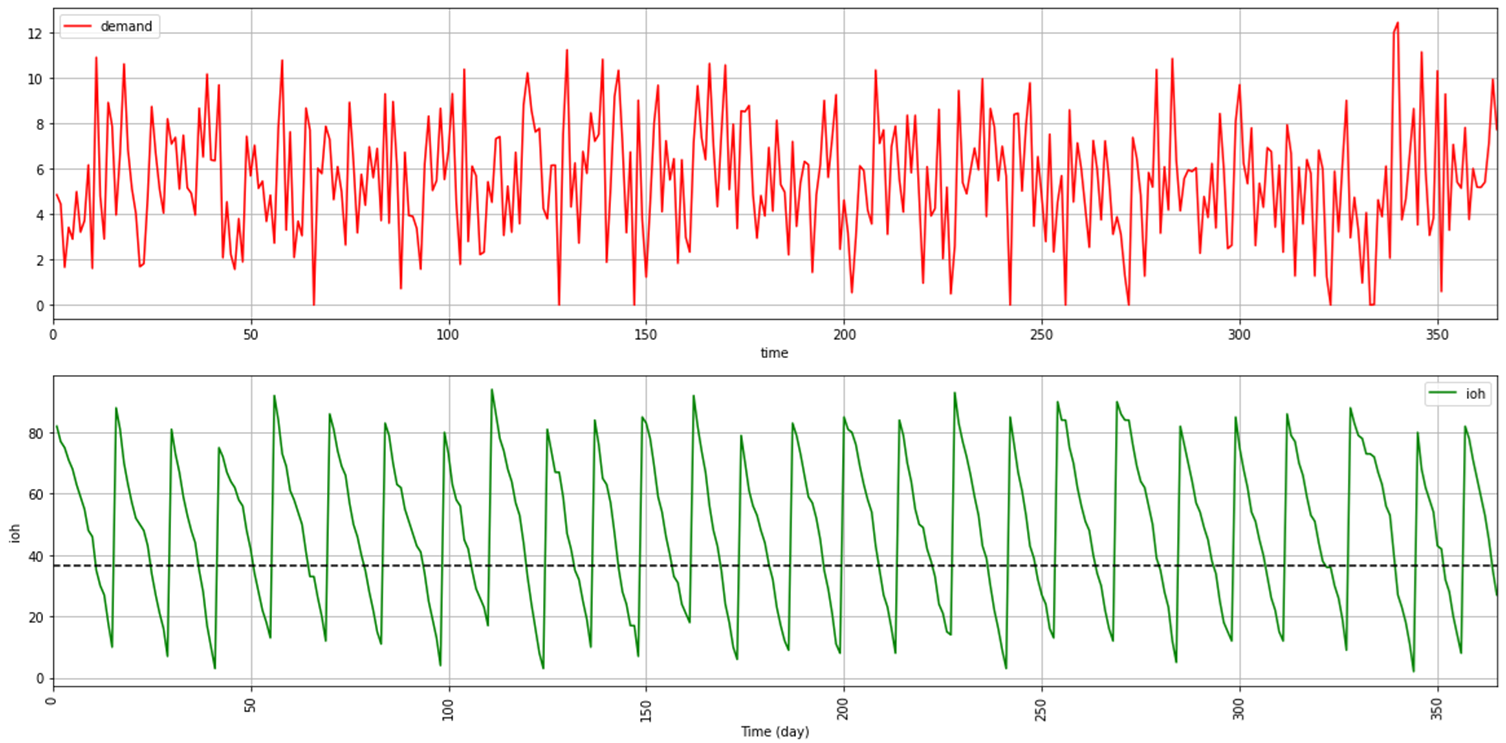
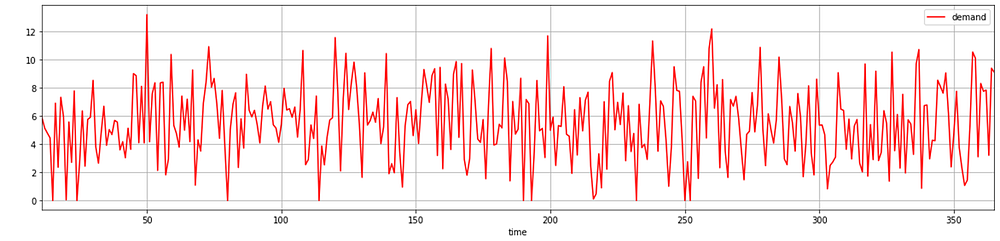
You have visibility of the daily fulfilled demand for each store.
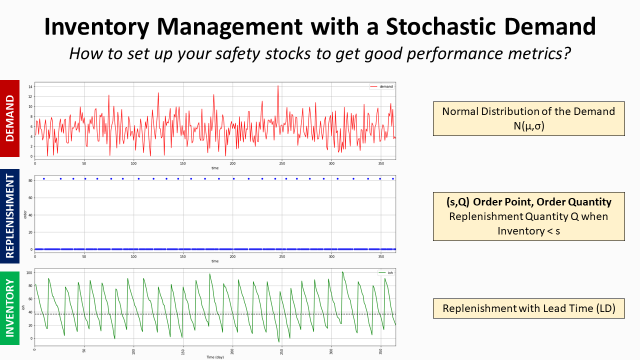
We will assume, in this example, that demand follows a normal distribution.
Continuous Review Policy
You implemented a continuous review policy using: Order Point, Order Quantity (s, Q).
If the level is below the minimum threshold s, called safety stock, you reorder Q pieces.
Safety Stock Calculation
The safety stock is necessary to cover the demand during the replenishment, but also to compensate for the volatility of the demand.
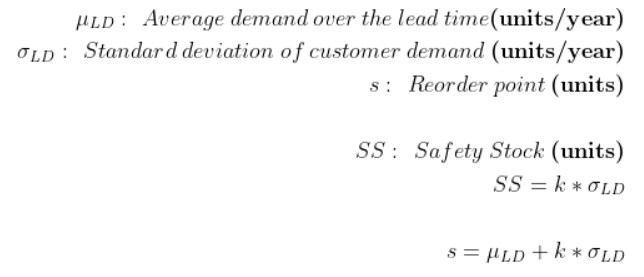
A key element here is the replenishment lead time. If it is underestimated, you can face stock-outs in stores.
For more information
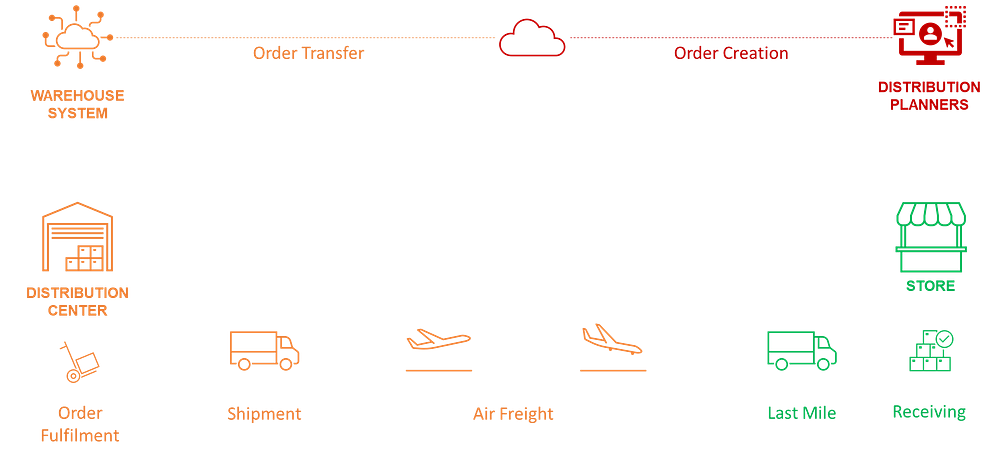
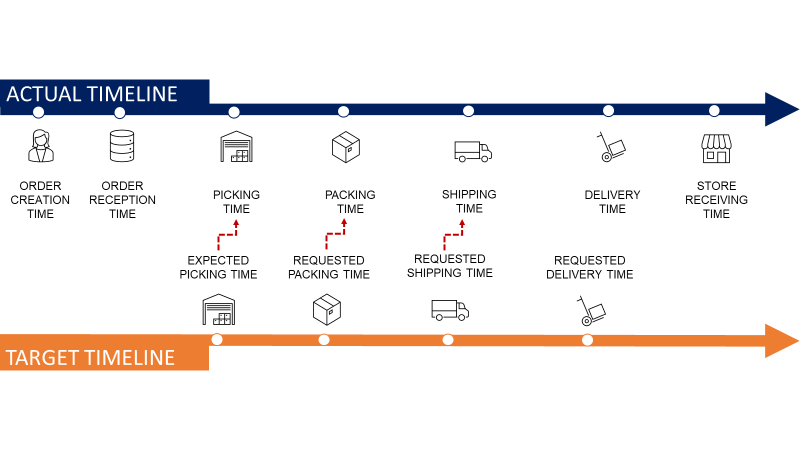
Lead Times: Expectation vs. Reality
The replenishment lead time is the time between the order creation and the store delivery.
Target Lead Times (LT)
When you designed replenishment rules, you used target lead times provided by the logistics teams.
Their responsibility is to ensure optimal execution of the tasks from the order creation to store delivery.
- Step 1: Replenishment orders are created in the ERP
- Step 2: Orders are transmitted to the Warehouse Management System
- Step 3: Orders are prepared and packed by warehouse teams
- Step 4: Transportation teams organise the transportation from the distribution centre to the stores
What is a cut-off time?
For each step, you have a target lead time and a cut-off time.
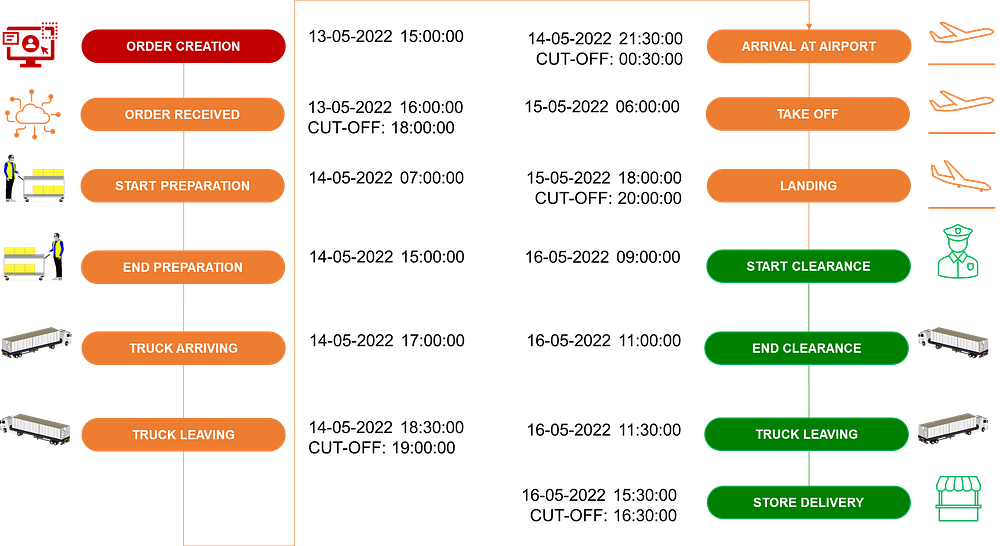
These cut-off times can greatly impact the total lead time (LT):
- Order Reception: if an order is received after 18:00:00, it cannot be prepared the day after (+24 hours in LT)
- Truck leaving: if an order is not packed before 19:00:00, it cannot be loaded the same day (+24 hours in LT)
- Arrival at Airport: if your shipment arrives after 00:30:00, it misses the flight (+24 hours LT)
- Landing: if your flight lands after 20:00:00, you need to wait an extra day for customs clearance (+24 hours LT)
- Store Delivery: if your trucks arrive after 16:30:00, your shipments cannot be received by store teams (+24 hours LT)
Introduce some variability
In the example below, the different steps are smoothly coordinated and cut-off times are respected because the targets are respected.
Let’s now introduce some variability around the targets to better reflect the realities of logistics operations.
Simulation with process variability
Stochastic Lead Times
For each process, we add some variability around the target to simulate real-world operations.
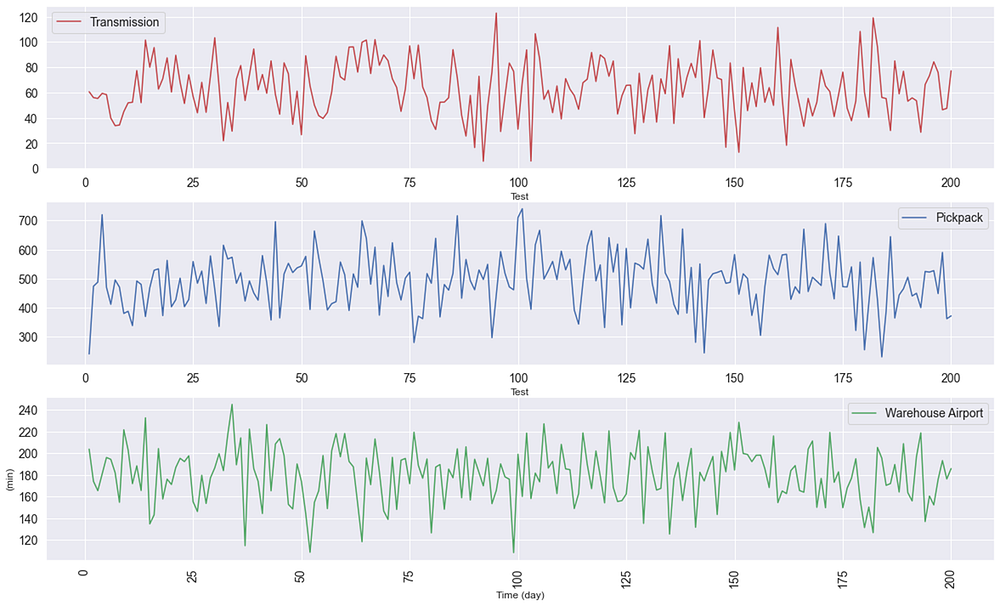
In the example below, I have simulated variations around the lead time targets using normally distributed variables.
Below are the parameters used:
{
'Transmission': [60, 0.4],
'Pickpack': [480, 0.2],
'Loading': [90, 0.05],
'Warehouse Airport': [180, 0.15],
'Flight': [720, 0.15],
'Custom Clearance': [120, 0.3],
'Truck Preparation': [45, 0.2],
'Airport Store': [240, 0.25]
}
Scenarios Simulation: Results
For the normal scenario, the total lead time is 72.5 hours.
Let us now measure the gap between this ideal result and 200 scenarios with lead-time variability.
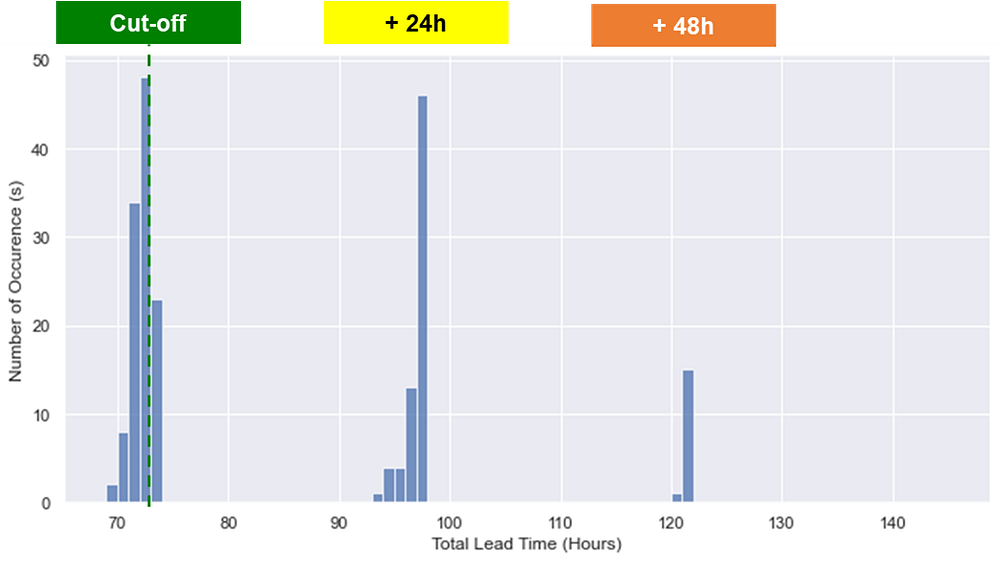
Results are split into four categories:
- All cut-off times are respected: lead times are very close to 72.5 hours
- +24 h: 1 cut-off time missed
- +48 h: 2 cut-off times missed
Root-Cause Analysis
We are lucky that only 2 out of 5 cut-offs have been missed.
Now, let us deep-dive into each leg of transportation to identify the root causes.
Loading Lead Time
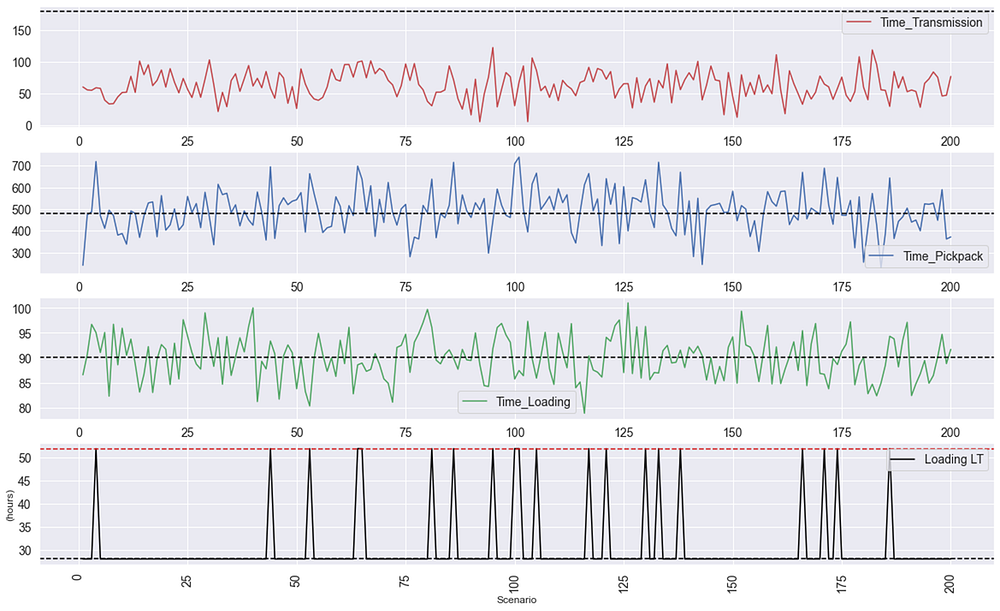
20 scenarios
Lead Time Take-off
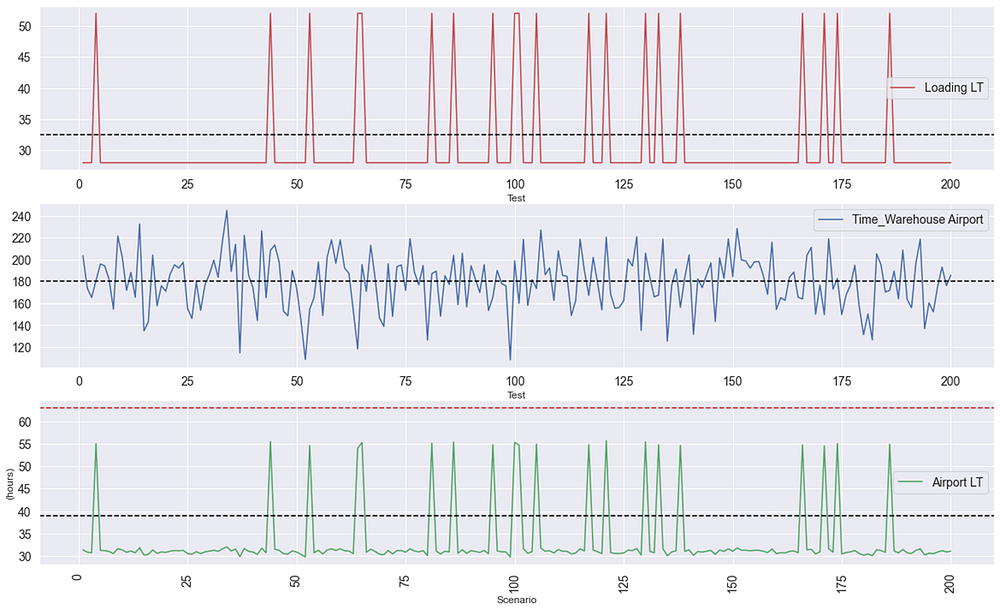
same 20 scenarios did not cause any late arrival
Lead Time Custom Clearance
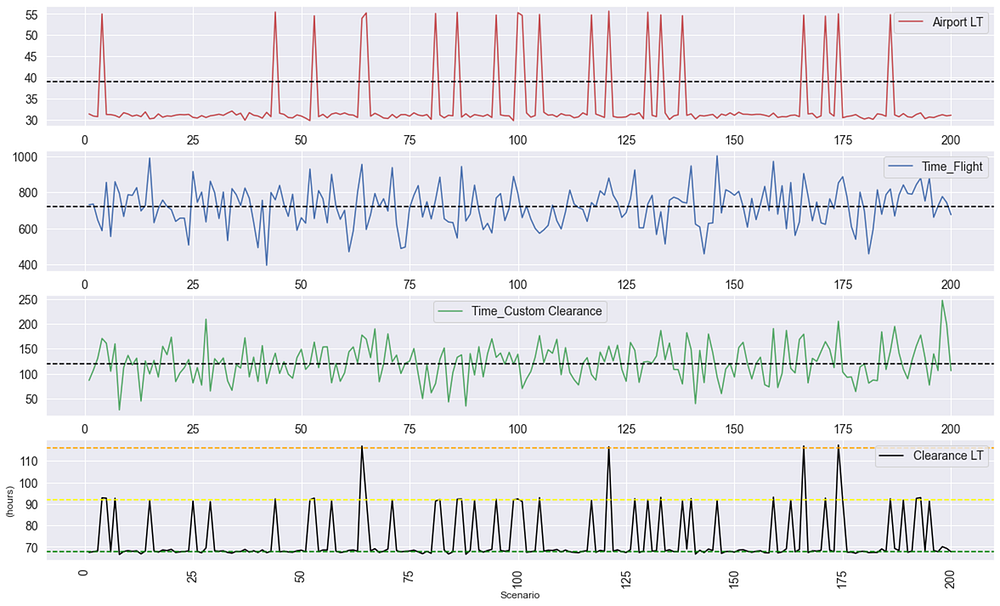
48+ hours 24+ hours
after the clearance cut-off
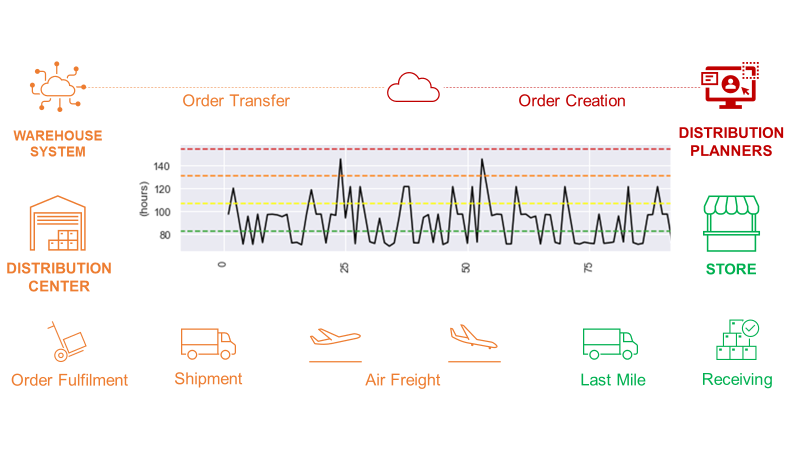
End-To-End Analysis
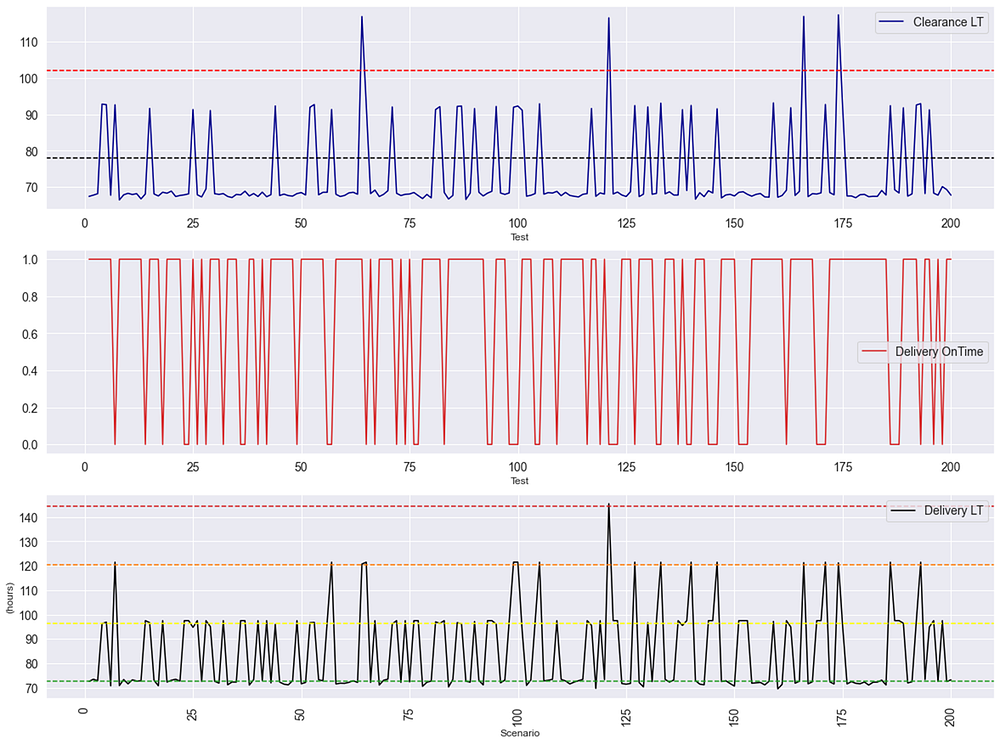
In the last graph, we analyse the total delivery lead time:
- Above the red line: >96h of LT because of 3 cut-offs missed
- Above the orange line: >72h of LT because of 2 cut-offs missed
- Above the yellow line: >48h of LT because of 1 cut-off missed
- Above the green line: all the cut-offs have been respected
We can see in the red plot that the store delivery cut-off impacted several scenarios and added 24+ hours.
Conclusion
In this example, we showed that target lead times are not guaranteed.
These scenarios with late deliveries create instability in the supply chain and drain significant energy from operational teams.
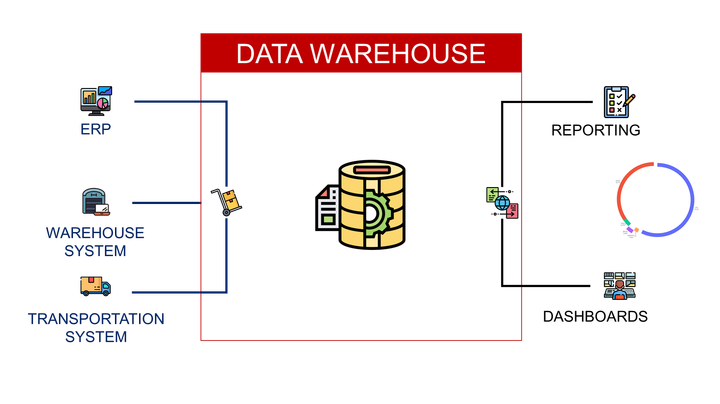
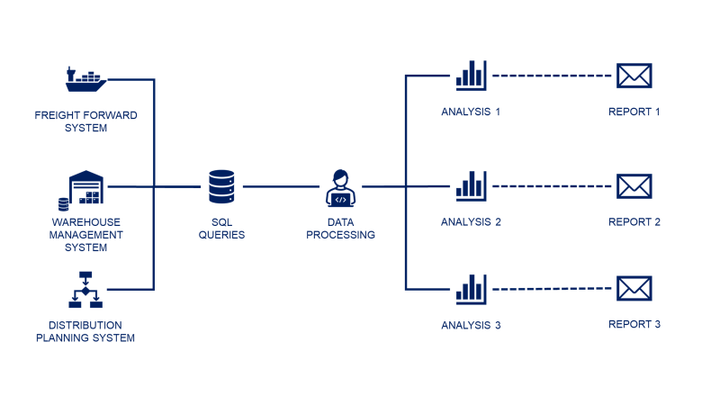
This kind of analysis can be automated if your company develops advanced end-to-end supply chain analytics capabilities.
You can find an example of a design approach in this article,
About Me
Let’s connect on LinkedIn and Twitter. I am a Supply Chain Engineer who is using data analytics to improve logistics operations and reduce costs.
If you’re looking for tailored consulting solutions to optimise your supply chain and meet sustainability goals, please contact me.