Automated Supply Chain Control Tower with Python
Optimize your Supply Chain Network with an automated solution to follow your shipments and evaluate the risk of late deliveries
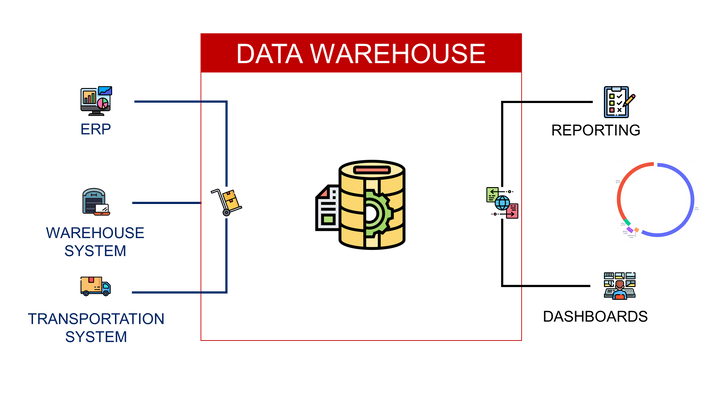
A supply chain control tower is traditionally defined as a set of dashboards connected to various systems using data to monitor events across the supply chain.
It enables a Supply Chain department to better track, understand, and resolve critical issues in real-time.
In this article, we will implement automated tools for shipment tracking that automatically send incident reports, follow open shipments and analyse lead times.
💌 New articles straight to your inbox for free: Newsletter
If you prefer, you can watch the video version of this tutorial
Distribution Network of a Fashion Retailer
Scenario
You are a distribution planning manager in an international clothing group that has stores all around the world.
Distribution planners manage inventory in stores to meet demand.
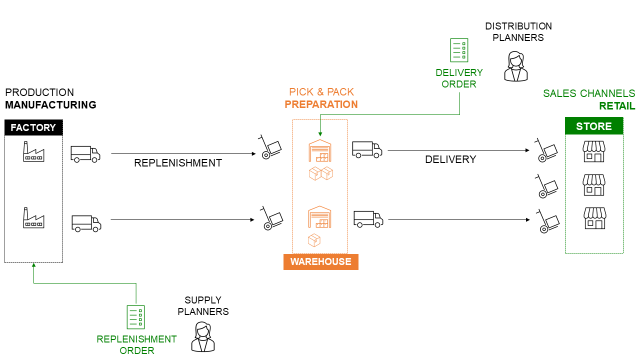
When the inventory level reaches the minimum level
- Distribution planners create replenishment orders in the ERP with item quantities and requested delivery dates
- Warehouse operational teams prepare the orders for shipment
- Transportation teams organise the delivery to the stores
On a daily basis, you need to follow the shipments and report incidents to the store and logistics managers:
- How many shipments have been delivered with a delay?
- Where are the shipments currently in transit?
- How many transit shipments are at risk?
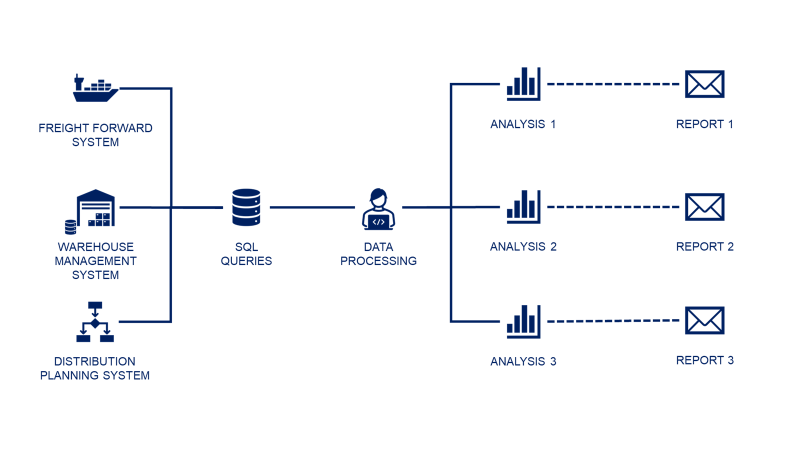
Our Supply Chain Control Tower will be basically a set of automated Python scripts that distribute reports by email, answering these questions.
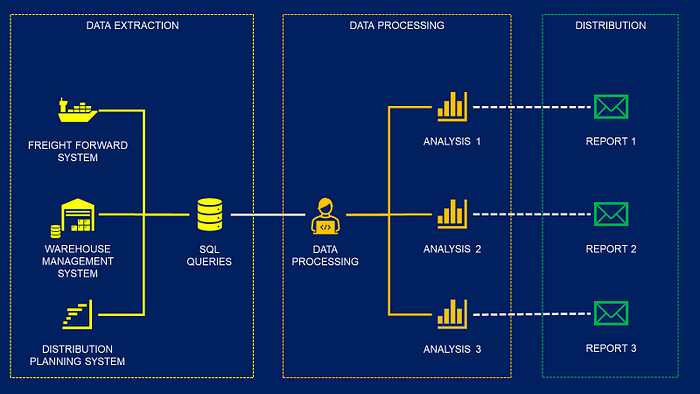
Four steps:
- Step 1: Perform SQL queries to extract the shipment information from the systems using pandas.read_sql
- Step 2: Process the data and build visuals using pandas and matplotlib
- Step 3: Create HTML reports and send them by email using smtplib
Solution
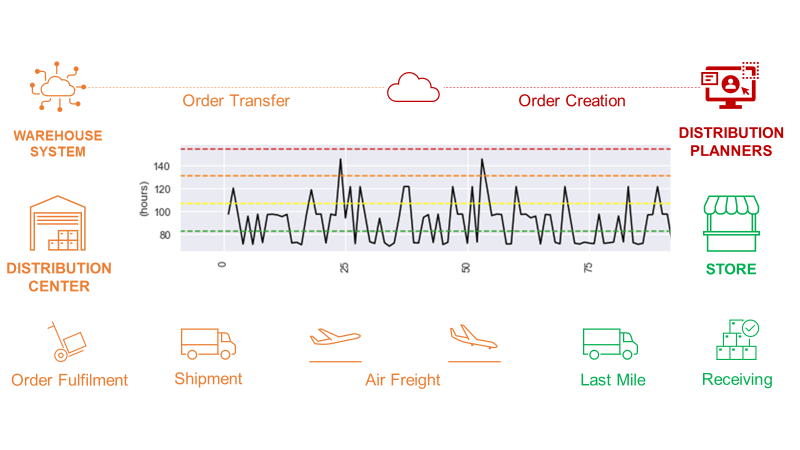
Cut-off times
There are several steps between the order creation in the system and the store delivery, managed by different teams
- Order transmission to the warehouse: IT Teams
- Order preparation in the warehouse: Warehouse Ops
- Transportation from the Warehouse to the store: Transportation Ops
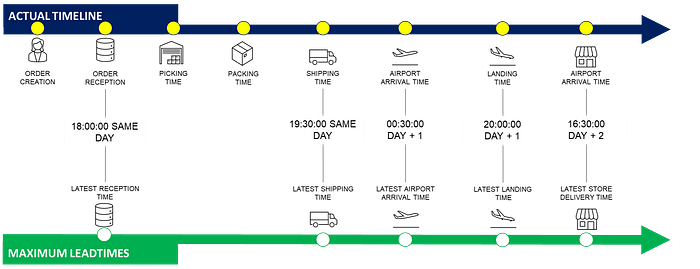
For some key steps, we have cut-off times, if they are not respected +24 hours are added to the total lead time.
Shipment Records
After performing the SQL queries, you have a data set of shipment information with all the time stamps needed
- Last Status: the last step of the process at the time you perform the extraction
- On-Time Flags: a boolean variable checking if the cut-off time has been respected
Analysis of delivered shipments
How many shipments have been delivered after the requested delivery date?

- On-Time Deliveries: The actual delivery time is before the requested delivery time
- Late Deliveries: The actual delivery time is after the requested delivery time
Question 1: How many shipments have been delivered with delay?
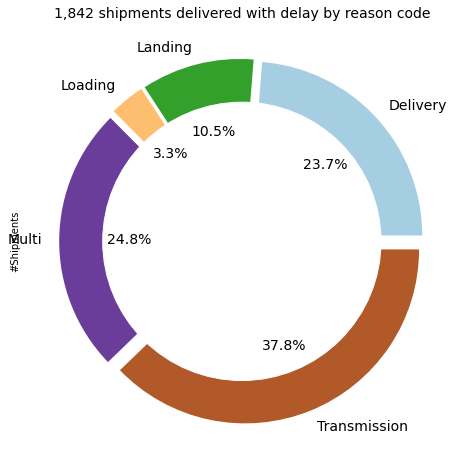
1,842 shipments delivered with delay
- 696 due to order transmission issues
- 60 due to warehouse operational issues
- 630 impacted by transportation
- 456 due to multiple factors
🧮 PYTHON CALCULATION
- Filter the shipments to take only the delivered ones
- Groupby Last Status: count the number of shipments
- Pandas pie plot
Shipments Status by Day
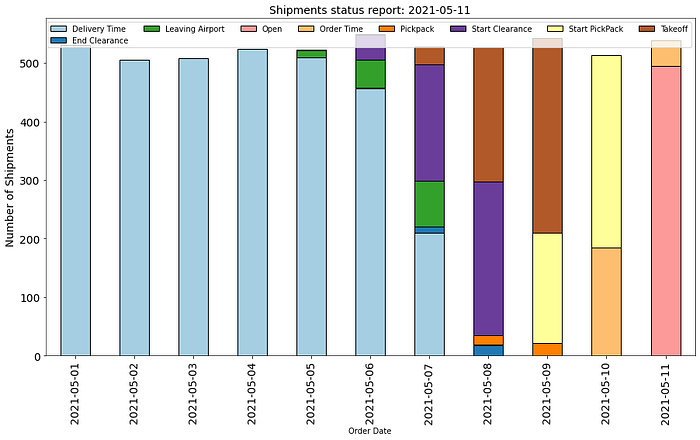
Analysis of shipments in transit
Shipments in transit are those that have been ordered but have not yet been delivered to the store.
Question 2: Where are the shipments currently in transit?
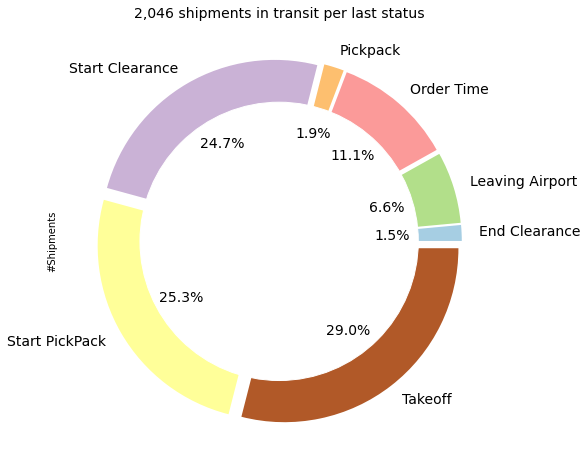
2,046 shipments in transit
- 782 in the warehouse
- 593 on flight transit- 535 in customs
- 136 on last-mile delivery
🧮 PYTHON CALCULATION
- Filter the shipments to take only the not delivered one
- Groupby Last Status: count the number of shipments
- Pandas pie plot
Question 3: How many transit shipments are at risk?
Definition
A shipment in transit is considered at risk if it missed the cut-off time or was delayed for at least one step of the whole chain.

In the example below, your shipment left the warehouse behind schedule. Therefore, it is considered at risk of being delivered late.
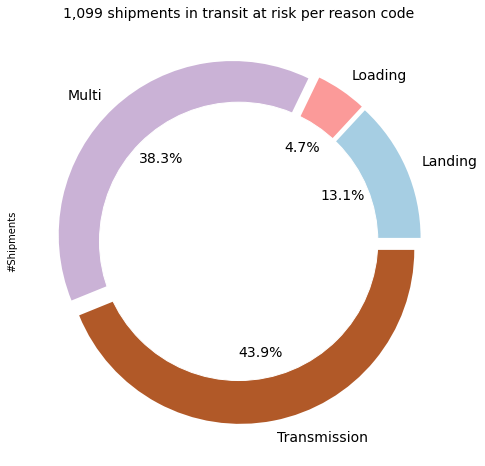
1,099 shipments in transit at risk because of delay
- During Warehouse Operations: 534 shipments
- During the flight: 144 shipments
- Due to multiple factors: 421 shipments
🧮 PYTHON CALCULATION
- Filter the shipments to take only the not delivered one with at least on OnTime flag False
- Map the shipments with reason code: if the flag XX OnTime = False the reason code is XX
- If you have multiple reasons the reason code is Multi
- Groupby Reason code: count the number of shipments
- Pandas pie plot
When you look at this poor performance, your first reflex is to ask for the root causes.
What can impact your end-to-end lead times?
For most of the time, this is the variability in your processes.
More details in this short explainer.
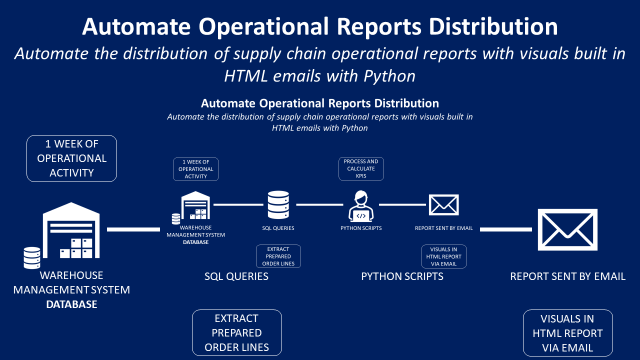
Reports Distribution
Would you like to automatically send the visuals presented above with the comment area in a clean HTML email?
A solution to this is presented in an article published a few days ago.
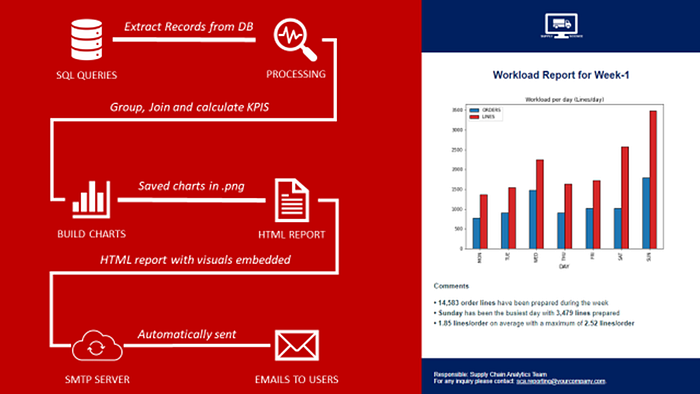
You just have to plug your tool into the script in the GitHub repository shared in the article.
This method uses a SMTP library of Python with a simple HTML template.
About Me
Let’s connect on LinkedIn and Twitter. I am a Supply Chain Engineer who is using data analytics to improve logistics operations and reduce costs.
If you’re looking for tailored consulting solutions to optimise your supply chain and meet sustainability goals, feel free to contact me.