Samir Saci
  • About Me
  • Projects
  • n8n
  • Business
  • Productivity
  • Supply Chain
  • Consulting
  • Videos Tutorials
  • Sustainability

Transportation Operations

Road Transportation Network Design and Optimization using Visualization, Linear Programming and Graph Theory.
The image illustrates a road transportation network for a retail company, where stores are represented by circles and delivery trucks by icons. Different stores are color-coded and connected

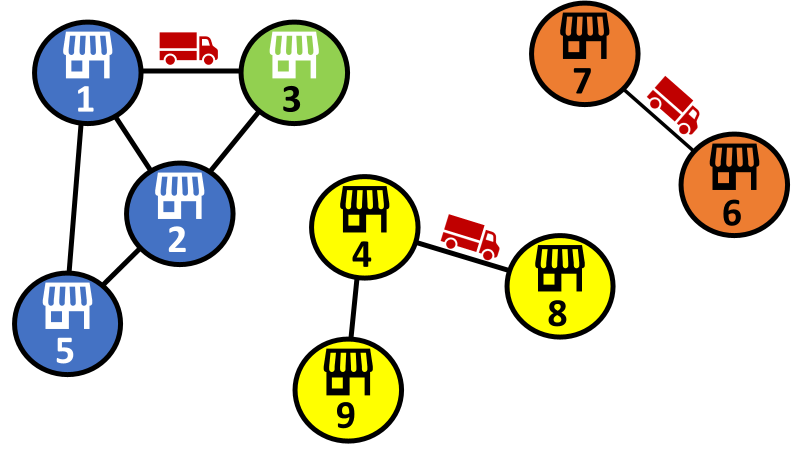
Transportation Network Analysis with Graph Theory

Use graph theory to optimize the road transportation network of a retail company
By Samir Saci Jan 12, 2022
A diagram illustrating the last-mile delivery process for e-commerce optimization using Python. A truck is shown delivering parcels to a warehouse, from which a delivery person on a scooter d

Optimize E-Commerce Last-Mile Delivery with Python

Organize your routes to deliver parcels with a minimum number of drivers using optimization models with python
By Samir Saci May 7, 2021
A 3D rendering of two large shipping containers, one red and one green, with pallets stacked nearby. A red forklift is seen carrying a pallet toward one of the containers. This image visualiz

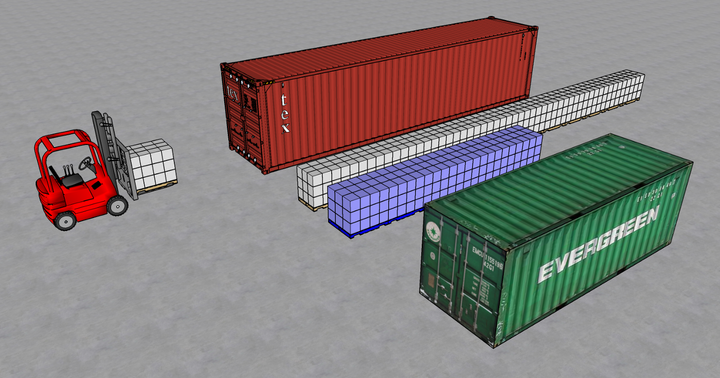
Containers Loading Optimization with Python

How can we use heuristic algorithms to find the right strategy to load a maximum number of pallets in a sea container?
By Samir Saci Apr 23, 2021
A diagram illustrating the process of building a shipment tracking tool using a Telegram bot with Python. The image shows a truck driver icon on the left, a Telegram logo in the center, and a

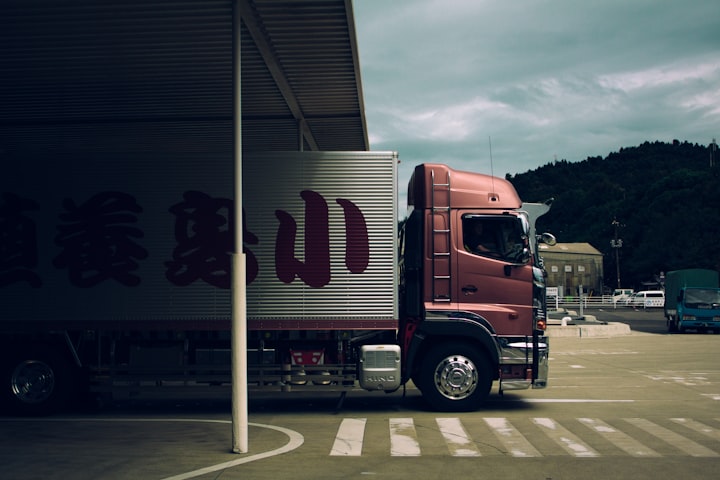
Build a Shipment Tracking Tool using a Telegram Bot

Design a Telegram Bot that will interact with truck drivers to track your shipments and provide real-time visibility of your transportation performance
By Samir Saci Mar 9, 2021
A geographic map displaying a road transportation network in China with nodes connected by lines representing Full Truck Load (FTL) routes. The visualization includes route paths with metrics

Road Transportation Network Visualization

Build Visualizations of your FTL Network Performance: deliveries/route, cost per ton and trucks size
By Samir Saci Sep 9, 2020

Samir Saci's blog includes 100+ practical articles on Supply Chain Optimisation, AI workflow automation, Sustainability, and operational continuous improvement with real-world examples, clear explanations, and reusable source code.

Samir Saci

  • About
  • My Projects
  • Consulting
  • Supply Science
  • LinkedIn
  • YouTube
  • Twitter/X

Categories

  • Supply Chain
  • AI & Workflow Automation
  • Business Analytics
  • Productivity
  • Sustainability
  • Career Tips
Samir Saci © 2026.