Supply Chain Optimisation with Python
Find the optimal locations of your manufacturing facilities to meet your customers’ demand and reduce production costs
Supply chain optimisation makes the best use of data analytics to find an optimal combination of factories and distribution centres to match supply and demand.
Because of the current surge in shipping costs, companies start to challenge their current footprint to adapt to the post-covid “New Normal”.
In this article, we will present a simple methodology using Linear Programming for Supply Chain Optimization considering
- Fixed production costs of your facilities ($/Month)
- Variable production costs per unit produced ($/Unit)
- Shipping costs ($)
- Customer’s demand (Units)
Should we keep outsourcing with shipping costs that have tripled in the last 12 months?
💌 New articles straight to your inbox for free: Newsletter
If you prefer watching, here is the video version of the article
Scenario
Problem Statement
As the Head of Supply Chain Management of an international manufacturing company, you want to redefine the Supply Chain Network for the next 5 years.
The new design should consider the recent increase in shipping costs and the forecasts of future demand.
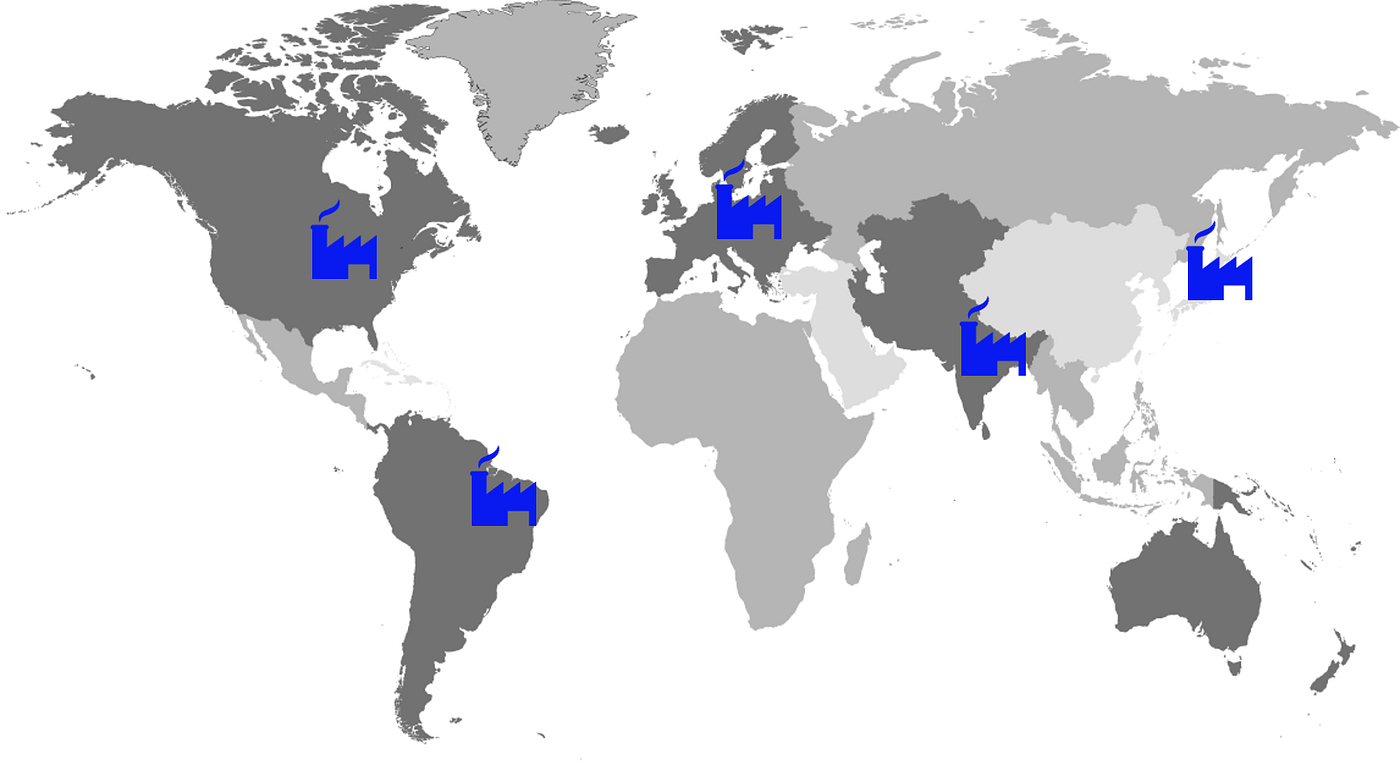
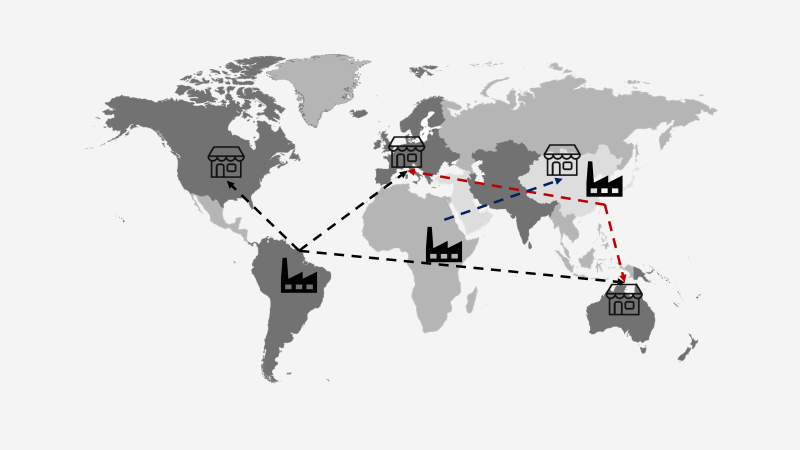
Your Supply Chain Network
- 5 markets in Brazil, USA, India, Japan, Germany
- 2 types of manufacturing facilities: low-capacity and high-capacity sites
- Shipping costs ($/container)
- Customer’s demand (Units/year)
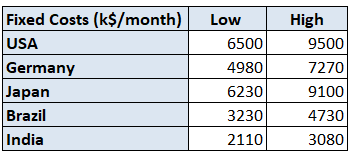
Manufacturing Facility Fixed Costs
- Capital Expenditure for the equipment (Machines, Storage, ..)
- Utilities (Electricity, Water, ..)
- Factory management, administrative staff
- Space Rental
These costs depend on the country and the plant type.
Production Variable Costs
- Production lines operators
- Raw materials
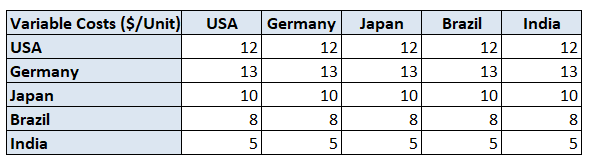
For instance, the variable cost per unit produced in Germany is $13.
Shipping Variable Costs
- Cost per container ($/Container)
- Assumption: 1 container can contain 1000 units
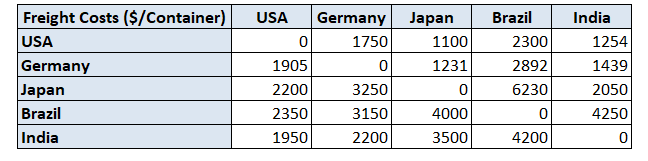
For instance, if you want to ship a container from Germany to Japan, it will cost you 1,231 ($/Container).
Manufacturing Capacity by Site
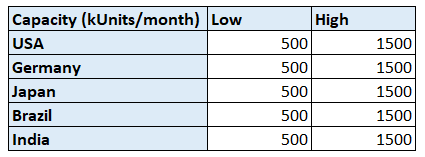
For instance, a high-capacity factory in Brazil can produce 1,500,000 units/month.
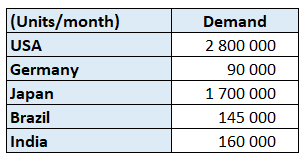
Customers' demand per market
Results
Let us try three scenarios.
- Scenario 1: initial parameters
- Scenario 2: We increase the production capacity of India (x2)
- Scenario 3: surging shipping costs due to container shortage
Scenario 1: Initial Scenario
- The Brazilian plant is producing for the local market and the USA
1 high-capacity plant
('Brazil', 'Brazil') = 145,000 (Units/Month)
('Brazil', 'USA') = 1,250,000 (Units/Month)
- India plants produce for all countries except Brazil
1 high-capacity plant and 1 low-capacity plant
('India', ' Germany') = 90,000 (Units/Month)
('India', 'India') = 160,000 (Units/Month)
('India', 'Japan') = 200,000 (Units/Month)
('India', 'USA') = 1,550,000 (Units/Month)
- Japan needs to produce locally because of the limited capacity of India
1 high-capacity plant
('Japan', 'Japan') = 1,500,000 (Units/Month)
Final Costs
Scenario 2: Outsourcing to low-cost regions
What if we double the size of high-capacity plants in India?
Let us try to double the size of the India High-Capacity plant, assuming it will double the fixed costs.
- Brazil plant is still producing for the local market and the USA
('Brazil', 'Brazil') = 145,000 (Units/Month)
('Brazil', 'USA') = 1,250,000 (Units/Month)
- India plants produce for all countries except Brazil
('India','Germany') = 90,000 (Units/Month)
('India','India') = 160,000 (Units/Month)
('India','Japan') = 1,700,000 (Units/Month)
('India','USA') = 1,550,000 (Units/Month)
- Japan does not produce locally anymore.
-19.4(%) vs. Scenario 1
Total Costs = 51,352,000 ($/Month)
What if we have container cost multiplied by 5?
Scenario 3: surging shipping costs due to container shortage
- Brazil is producing for the local market only
('Brazil', 'Brazil') = 145,000 (Units/Month)
- The USA started to produce for the local market and Japan
('USA', 'Japan') = 200,000 (Units/Month)
('USA', 'USA') = 1,300,000 (Units/Month)
- India closed its low-capacity factory
('India', 'Germany') = 90,000 (Units/Month)
('India', 'India') = 160,000 (Units/Month)
('India', 'USA') = 1,500,000 (Units/Month)
- Japan starts to produce for its local market
('Japan','Japan') = 1,500,000 (Units/Month)
Because of their limited production capacity, Japan and the USA still rely on the Indian plant.
Final Costs
Build your Model
We will use the PuLP Python library.
PuLP is a modelling framework for Linear (LP) and Integer Programming (IP) problems written in Python.
Declare your variables, parameters and model
- LpMinimize: your objective is to minimize your costs
- lowBound =0: you cannot have negative values of units produced
Define the objective and add constraints
Solve your model and analyse the results
Conclusion
This model allows you to simulate multiple scenarios that affect operational and commercial parameters.
- What if the demand explodes in India?
- What if we have to close our plant in Brazil?
- What if we triple the production capacity in Japan?
Scenario 3 is an example of a surge in shipping costs that could push companies to adopt a more local footprint, with plants producing only for their local market.
What if we ask a generative AI model to that?
This is exactly what I did when I connected this model to Claude AI via an MCP Server.
The idea was to equip the AI agent with this optimisation tool and ask it to run multiple scenarios.
For more details, check this short video
About Me
Let’s connect on LinkedIn and Twitter. I am a Supply Chain Engineer that is using data analytics to improve logistics operations and reduce costs.
If you’re looking for tailored consulting solutions to optimise your supply chain and meet sustainability goals, contact me.