Statistical Sampling for Process Improvement using Python
Use sample data to estimate the average lead time to process customer orders in the customer service of an elevator parts supplier.

As a critical component of Supply Chain Management, Customer Service is where your company gives your customers a sense of the products and the business you are selling.
An important performance indicator is the average lead time from customer order receipt to warehouse preparation.
In this article, we present a statistical sampling methodology to estimate the overall average lead time from a sample of 200 observations.
💌 New articles straight to your inbox for free: Newsletter
I. Scenario
Problem Statement
You are the Customer Service Manager of an elevator parts supplier that produce and deliver engine parts for elevators.
Question
Can you estimate the average processing time with a confidence interval of 90% using your sample data?
II. Statistical Sampling
1. Notations
2. Application of the Central Limit Theorem
3. Confidence Interval
4. Final estimation
III. Conclusion
Scenario
Problem Statement
You are the Customer Service Manager of an elevator parts supplier that produces and delivers engine parts for elevators.
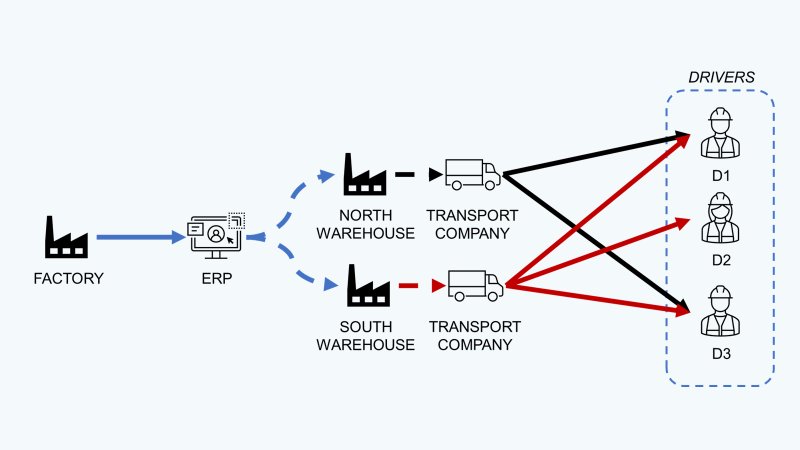
Your team is in charge of order processing:
- A Customer sends an order by phone or email with a requested delivery time
(e.g, Customer order 5 units of SKU X and would like to be delivered the same day at 10:00) - Your team confirms the order and allocates it to the closest warehouse for preparation and shipment.
- The order is prepared and shipped from the warehouse using an express courier company.
You recently received numerous customer complaints due to late deliveries.
According to the warehouse manager, this is mainly due to delays in customer service processing orders.
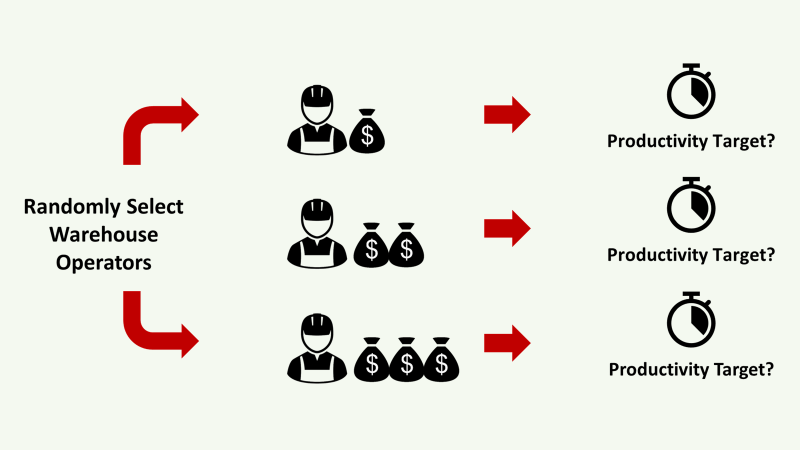
Over 3 months, you measured the order-processing time of randomly selected operators and collected 200 observations.
Can you estimate the average processing time with a confidence interval of 90% using your sample data?
Statistical Sampling
As we are not able to measure the average processing time of all your operators for every order, we would like to estimate the total population average using these sample records.
Notations
To simplify the comprehension, let’s introduce some notations:

Application of the Central Limit Theorem
In a previous article (Link), we used the Central Limit Theorem (CLT) to estimate the probability P(X ≥ k) when X follows a normal distribution.
The CLT also tells us:

Confidence Interval
Our objective is to know the population mean a range [µ-b, µ+b] with a confidence of 90%.
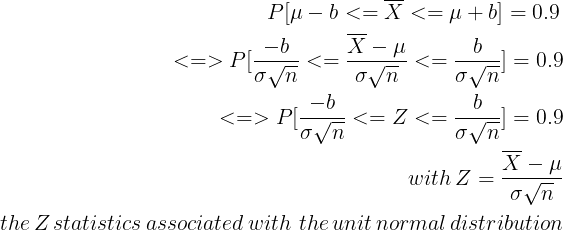
And we know by the construction of the unit normal distribution that for P(-z≤Z≤z) = 0.9, we have z = 1.64
Finally, we can get our estimated range or the population mean

Final estimation
mean 22.705
std 6.81
min 4.0
25% 18.0
50% 23.0
75% 27.0
max 41.0
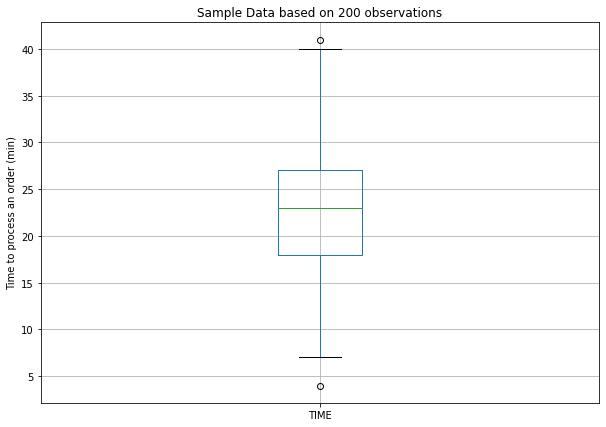
We have,
s = 6.81 (min)
The confidence interval is [21.96, 23.54]
Conclusion
At a 90% confidence level and with moderate experimentation, we have a very good estimate of the average order-processing lead time.
This approach can be used when measuring process performance is expensive and time-consuming.
However, you need to put effort into the experimental protocol to ensure that your sample data is based on a random selection of operators.
Can we get the support of AI to analyze these process inefficiencies?
In an experiment for a Fashion Retailer, I have connected these transactional data types to Claude Opus 4.6 for analysis.
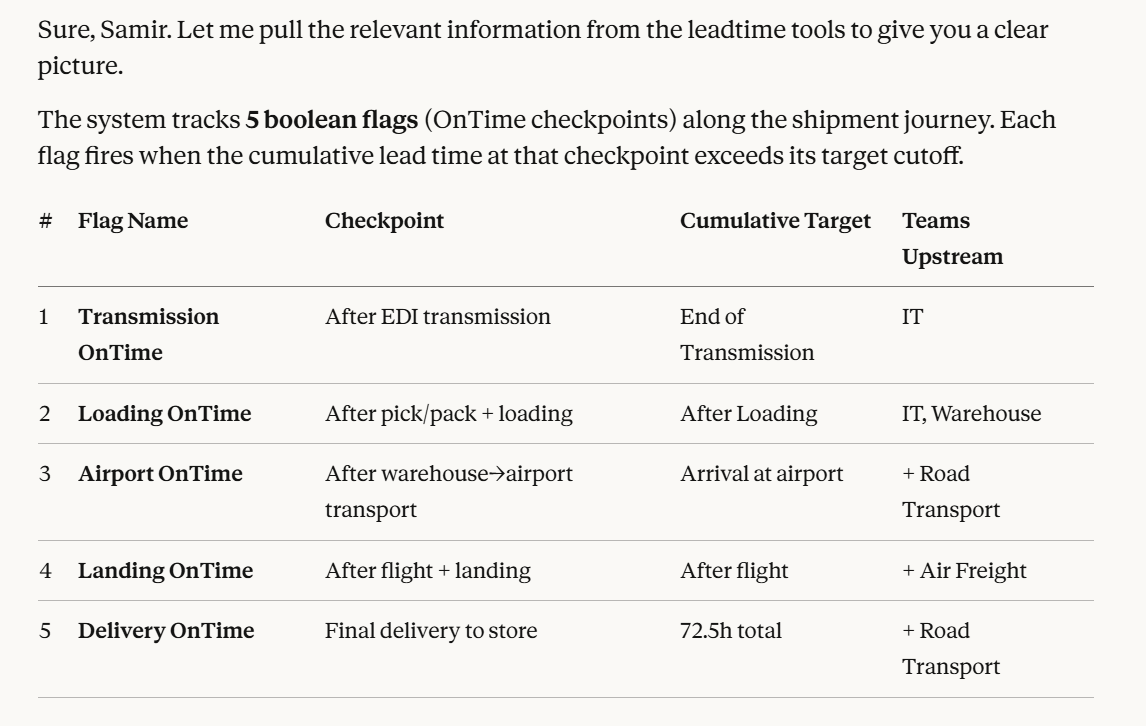
Claude demonstrated its capacity to understand the sub-processes and the cascading impact of inefficiencies in each leg on the overall delivery leadtime.
For more details, check this tutorial.
About Me
Let’s connect on LinkedIn and Twitter. I am a Supply Chain Engineer who is using data analytics to improve logistics operations and reduce costs.
If you’re looking for tailored consulting solutions to optimize your supply chain and meet sustainability goals, feel free to contact me.