Lean Six Sigma with Python — Logistic Regression
Replace Minitab with Python to perform a Logistic Regression to estimate the minimum bonus needed to reach 75% of a productivity target
Lean Six Sigma is a step-by-step approach to process improvement.
In a previous article, we used the Kruskal-Wallis Test to verify the hypothesis that a specific training positively impacts operators' Inbound VAS productivity.
In this article, we will implement Logistic Regression Python to estimate the impact of a daily productivity bonus on your warehouse operators' picking Productivity.
💌 New articles straight to your inbox for free: Newsletter
I. Problem Statement
What should be the minimum amount of daily incentive to get 75% of workers to reach their productivity target?
II. Data Analysis
1. Exploratory Data Analysis
Analysis with Python of sample data from the experiment
2. Fitted Line Plot of your Logistic Regression
What is the probability of reaching the target for each value of the daily incentive?
3. Validation with the p-value
Validate that your results are significant and not due to random fluctuation
III. Conclusion
Problem Statement
Scenario
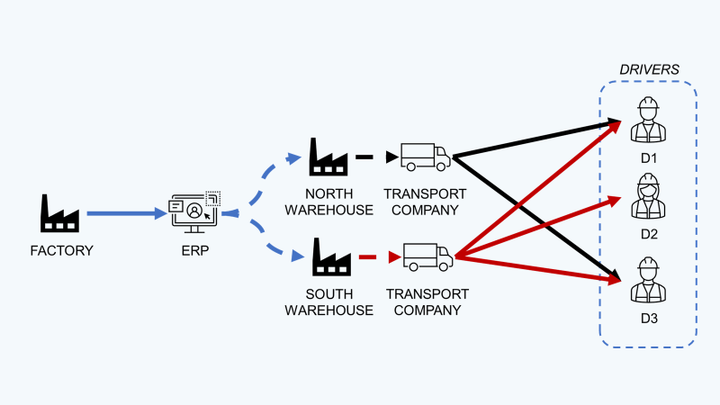
You are the Regional Director of a logistics company (3PL), and you have 22 warehouses in your scope.
At each warehouse, the site manager has set a picking productivity target for the operators.
Your objective is to identify the optimal incentive policy to achieve 75% of this target.
Find the right incentive policy.
Currently, productive operators (those who meet their daily productivity target) receive 5 euros per day in addition to their daily salary of 64 euros (after-tax).
However, this incentive policy, applied in 2 warehouses, is not very effective.
Only 20% of the operators are reaching this target.
Question
What should be the minimum daily bonus needed to reach 75% of the picking productivity target?
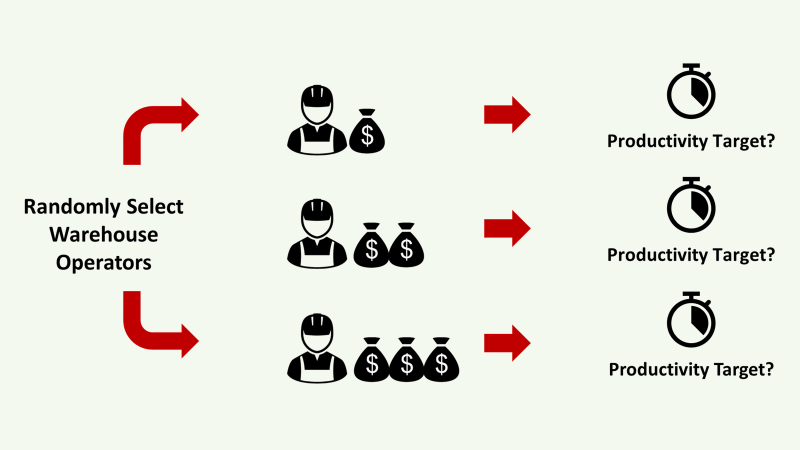
Experiment
- Randomly select operators in your 22 warehouses
- Implement a daily incentive amount varying between 1 and 20 euros
- Check if the operators reached their target
You can find a YouTube version of this article,
Data Analysis
Exploratory Data Analysis
Box plot of the sample distribution
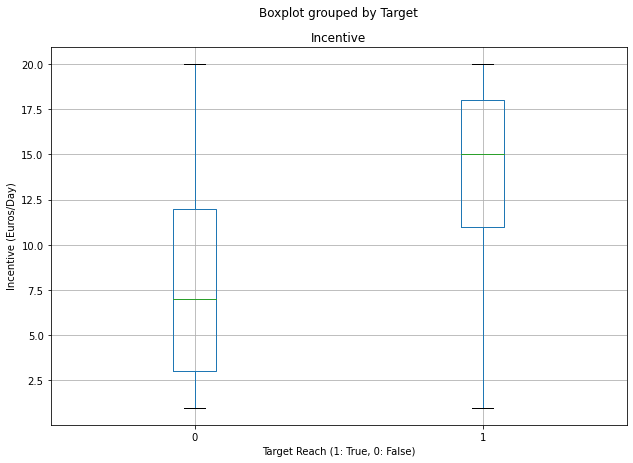
The median value of incentive for reached target’s day is more than 2 times higher than the one for the days below this target.
Fitted Line Plot of your Logistic Regression
Logistic Regression will provide us with a probability plot. We can estimate the probability of reaching the target for each value of the daily incentive.
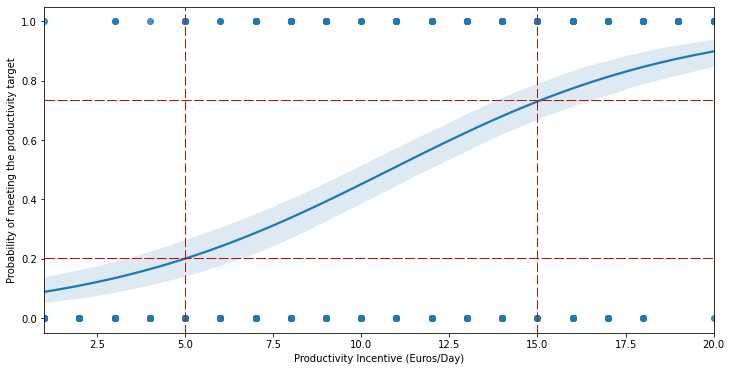
Confirmation of the current trend: 5 euros -> 20% of the productivity target reached
We need at leat 15 euros incentive per day to ensure 75% of probability to reach the target
CodeMinitab
Validation with the p-value
To check whether these results, based on sample data, are significant, we need to compute the p-value.
p-value: 2.1327739857133364e-141
p-value < 5%
The p-value is below 5%, so we can conclude that the difference in means is statistically significant.
Conclusion
If you set a daily incentive value of 15 euros, you will reach 75% of your target.
CodeMinitab
It is your time to implement it.
Conclusion
What is the ROI?
Based on this experiment, we have set a minimum bonus of 15 euros/day to reach 75% of your productivity target.
Before implementing this new incentive policy, you need to check that you have a positive return on investment:
- What is the total cost to the company (CTC) per hour paid for picking operators? (Euros/Hour)
- What is the total number of hours earned after the productivity increase? (Hours)
- What would be the CTC of hiring temporary workers for this number of hours? (Euros)
- What is the total CTC of incentives?
After answering these questions, you’ll be able to estimate the return on investment for this new incentive policy.
Depending on the operators' hourly rates, you may lose or save money.
Next Steps
However, the operator's Productivity may not be only driven by their motivation.
It may be the picking process or the order profile.
Therefore, this analysis should be complemented by a process optimisation study to ensure that operators can realise their full potential, with incentives appropriately aligned.
About Me
Let’s connect on LinkedIn and Twitter. I am a Supply Chain Engineer using data analytics to optimise logistics operations and reduce costs.
If you’re looking for tailored consulting solutions to optimise your supply chain and meet sustainability goals, feel free to contact me.