Central Limit Theorem for Process Improvement with Python
Estimate the workload for returns management assuming a normal distribution of the number of items per carton received from your stores.
Returns management, often referred to as reverse logistics, is the process of handling returned items from retail locations withinawaiting reorder your distribution centre.
After the reception, products are sorted, organised, and inspected for quality.
If they are in good condition, these products can be restocked in the warehouse and added to the inventory count awaiting reorder.
In this article, we will see how the Central Limit Theorem can help us workload for the returns management.
We will use a normal distribution based on the mean and standard deviation of historical records.
💌 New articles straight to your inbox for free: Newsletter
I. Scenario
Problem Statement
As the Inbound Manager of a multinational clothing retail company you are in charge of workforce planning for returns management.
Question
Can you estimate the probability to have less than 30 items per carton that you will receive every week?
II. Central Limit Theorem
1. Definition
2. Application
3. Probability to get <30 items per carton?
4. 95% probability to have less than k items per case?
III. Conclusion
Scenario
Problem Statement
You are the Inbound Manager of a multinational clothing retail company.
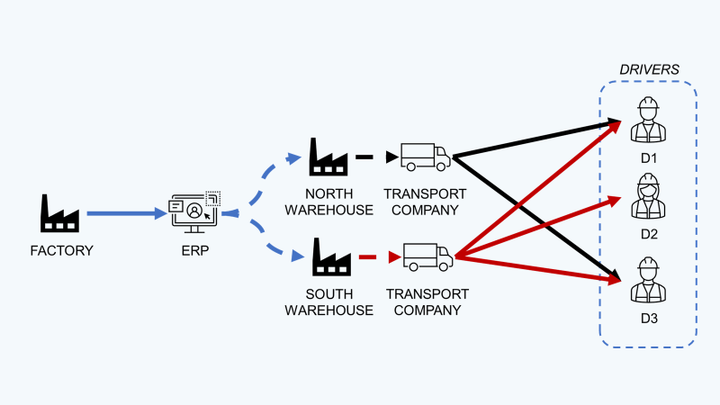
A major problem for you is the lack of visibility of your workload for the returns process.
Indeed, because of system limitations, you do not get an advance shipping notice (ASN) before receiving returns from your stores.
- You receive the cartons by pallets that you unload from the truck
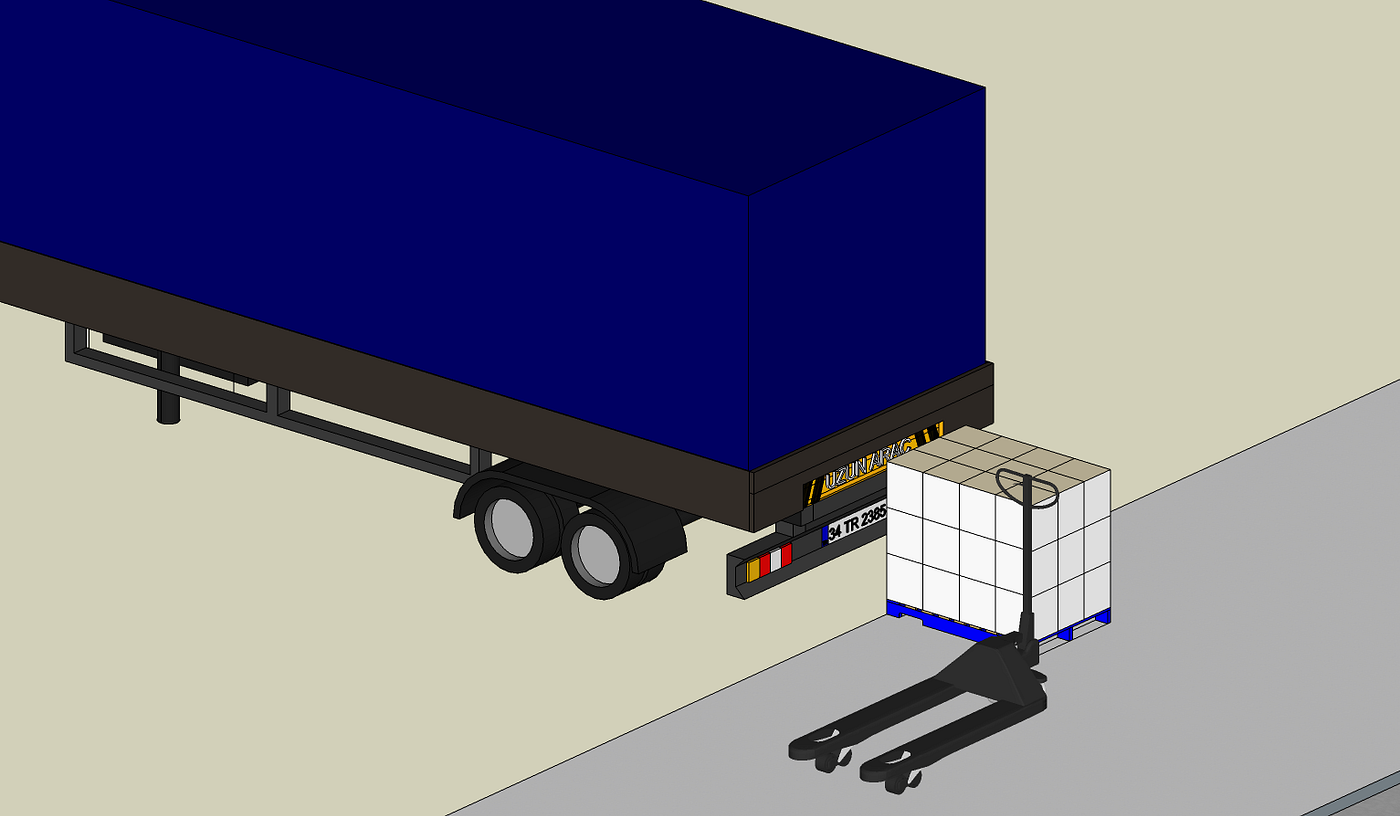
2. You open the box and inspect the returned items
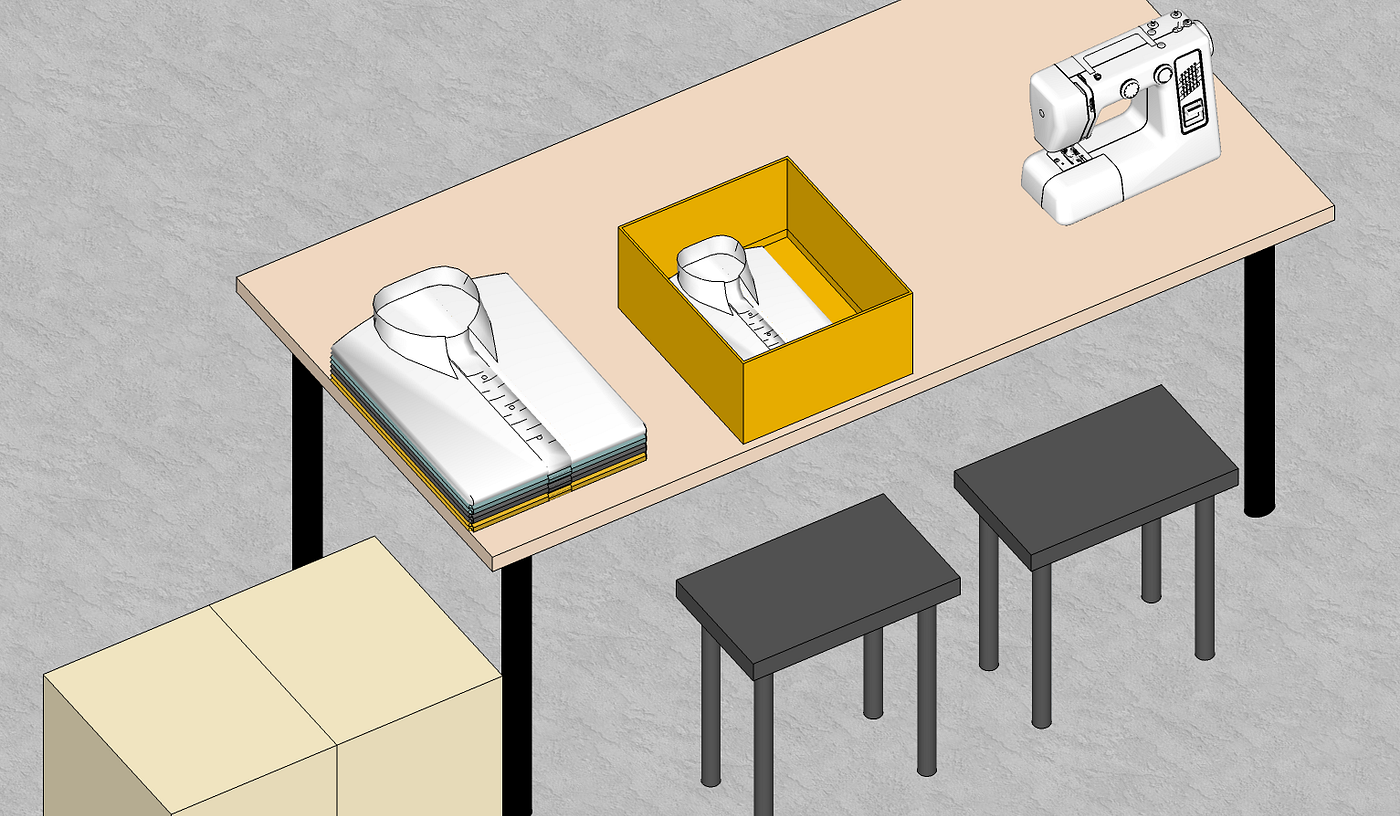
For each item (shirt, dress …) your operators need to perform:
- Quality check to ensure that the product can be restocked
- Relabelling
- Re-packing
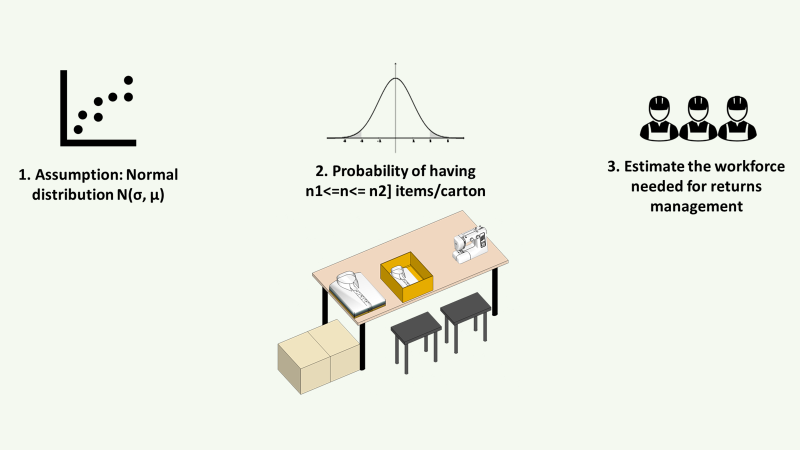
You know the productivity per item, and you would like to estimate the workload in hours based on the number of cases you will receive in the week.
Based on the historical data of the last 24 months, you have:
- An average of 23 items per carton
- A standard deviation of 7 items
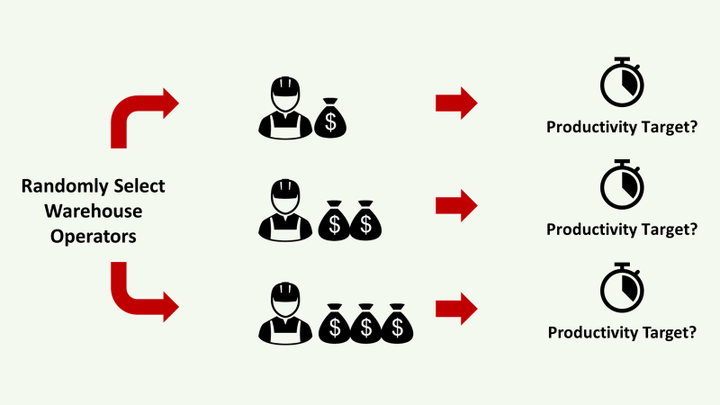
Your team is typically sized to handle up to 30 items per case.
You need to hire temporary workers to meet your daily capacity target if it goes beyond this threshold.
Can you estimate the probability to have less than 30 items per carton that you will receive every week?
Central Limit Theorem
The Central Limit Theorem states that, for independent random variables, the normalised sum tends to a normal distribution even if the original variables are not normally distributed.
Definition
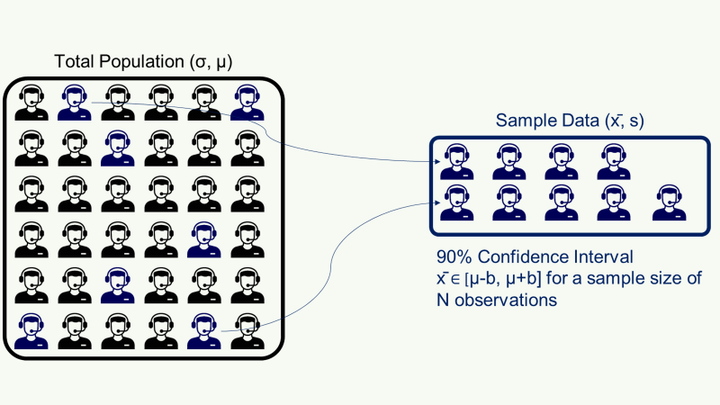
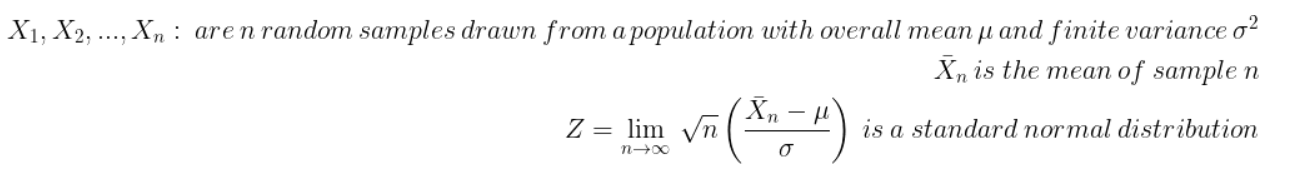
To simplify the comprehension, let’s introduce some notations:

In our case, the total population is the entire scope of cartons received from the stores, with a mean µ = 23 items per carton and a standard deviation of σ = 7 items per carton.
If you take n samples of cartons Xn (for instance, a sample can be a batch of cartons received at a certain date) we have:
That means if we randomly measure the number of items per carton using n samples, and we assume that
- Observations are independent and identically distributed (i.i.d.)
- The probability distribution of the sample means will closely approximate a normal distribution.
Application
We can assume that the average number items/case is following a normal distribution with a mean of 23 items per carton and a standard deviation of 7 cartons.
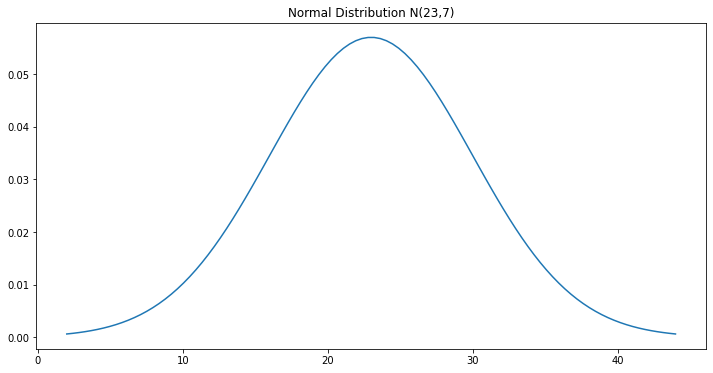
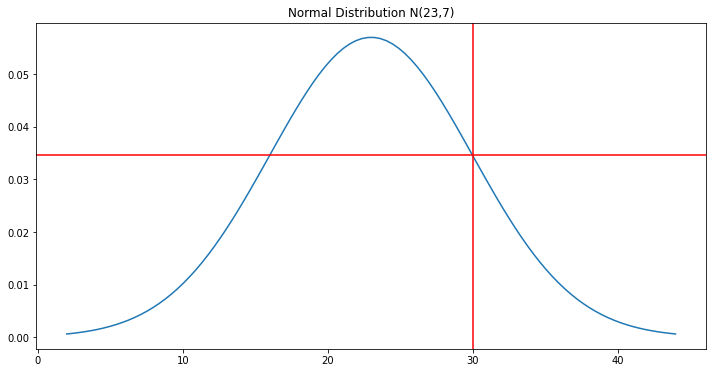
What is the probability to have less 30 items per carton?
Probability to get <30 items per carton?
The probability of having fewer than 30 items/carton is 84.13%
Code
95% probability of having less than k items per case?
Your KPI target is to process at least 95% of returns the same day.
How many items do you need to assume to size your team for handling 95% of the expected workload?
We have 95% of probability that X <= 34.51 items/carton
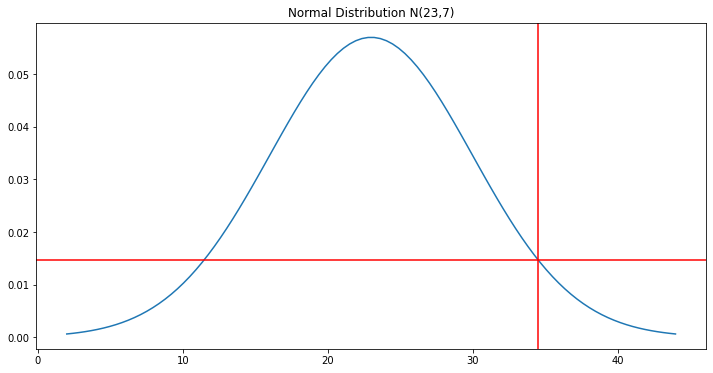
If you size your team based on 35 items/carton, you will, on average, reach 95% of your target.
It is your time to implement!
Conclusion
This methodology allows you to size your team based on assumptions backed by powerful statistical tools.
This analysis can be performed several times per year, especially if the business is evolving (e.g., more collections, e-commerce, or new store openings).
About Me
Let’s connect on LinkedIn and Twitter. I am a Supply Chain Engineer who is using data analytics to improve logistics operations and reduce costs.
If you’re looking for tailored consulting solutions to optimize your supply chain and meet sustainability goals, feel free to contact me.