Robust Supply Chain Networks with Monte Carlo Simulation
In this article, we will build a simple methodology to design a Robust Supply Chain Network using Monte Carlo simulation with Python.
Supply chain optimisation makes the best use of data analytics to find an optimal combination of factories and distribution centres to meet the demand of your customers.
In many software and solutions in the market, the core structure behind is a Linear Programming Model.
Some of these models find the right allocation of factories to meet the demand and minimize the costs, assuming a constant demand.
What happens if the demand is fluctuating?
Your network may become less robust, especially if your demand has very high seasonality (e-commerce, cosmetics, fast fashion).
In this article, we will build a simple methodology to design a Robust Supply Chain Network using Monte Carlo simulation with Python.
💌 New articles straight to your inbox for free: Newsletter
I. Supply Chain Network Design
Find the right allocation of factories to meet a global demand
II. Problem Statement
What happens if your demand is fluctuating?
1. Limits of the initial solution
Understand the robustness of the initial solution
2. Methodology of simulation
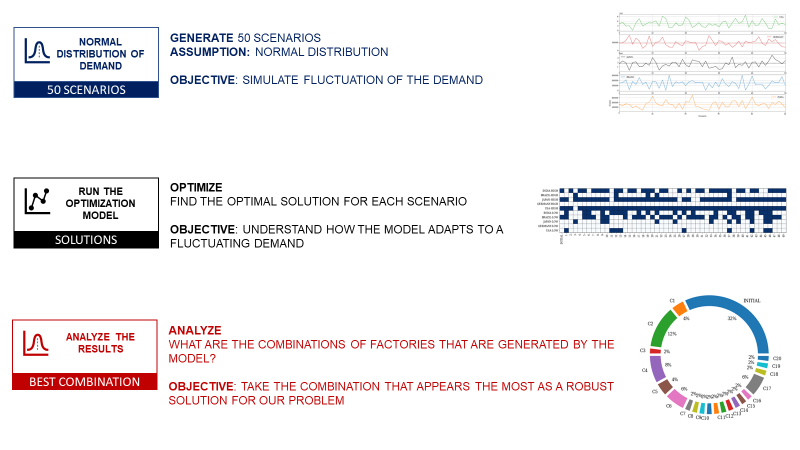
Simulate 50 scenarios based on a normal distribution of the demand
3. Analyze the results
What are the different combinations of solutions?
4. Final Solution
The most robust combination?
III. Conclusion & Next Steps
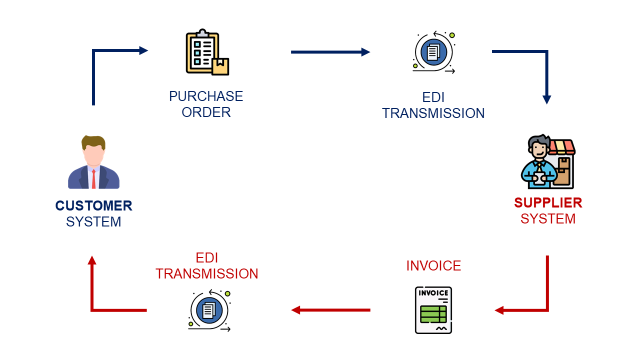
Supply Chain Network Design
Global Supply Chain Network
As the Head of Supply Chain Management of an international manufacturing company, you want to redefine the Supply Chain Network for the next 5 years.

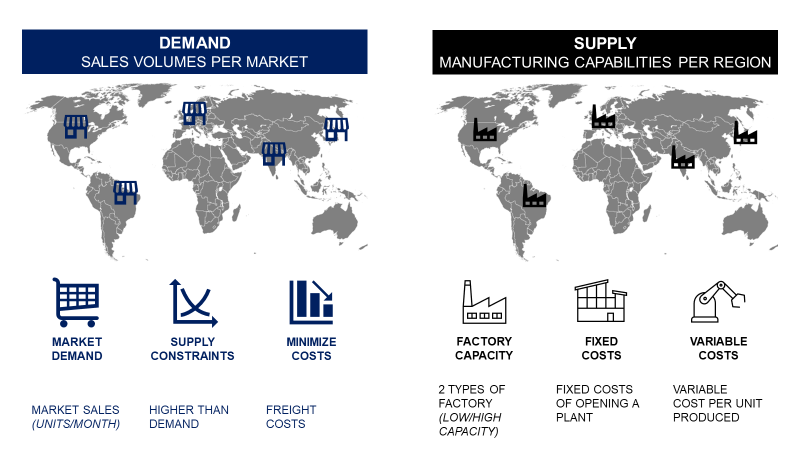
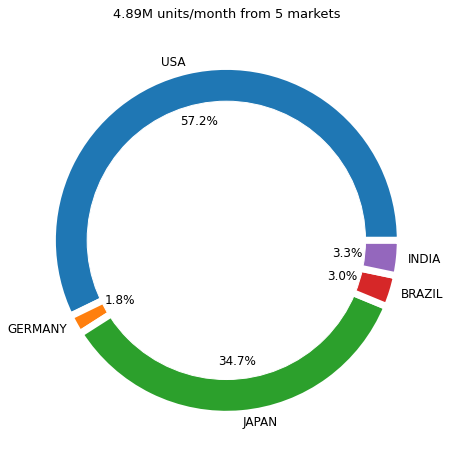
Demand
It starts with customer demand accross 5 different markets (Brazil, USA, Germany, India and Japan).
Supply Capacity
You can open factories in the five markets. There is a choice between low and high-capacity facilities.
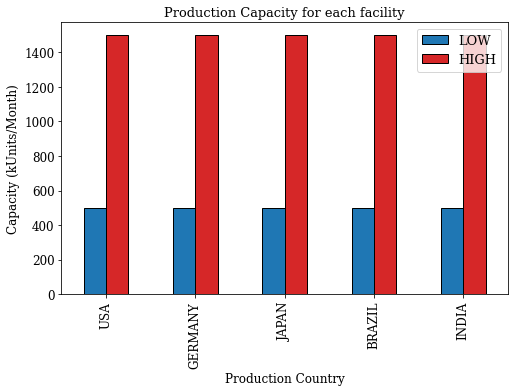
Example: Low-capacity factories in the USA can produce 500,000 units/month.
Fixed Costs
If you open a facility, you have fixed costs to add to your budget (Electricity, Real Estate, CAPEX, …).
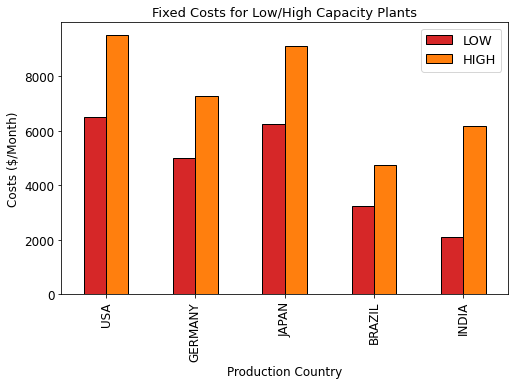
High-capacity plants in India have lower fixed costs than low capacity plants in the USA.
Variable Costs
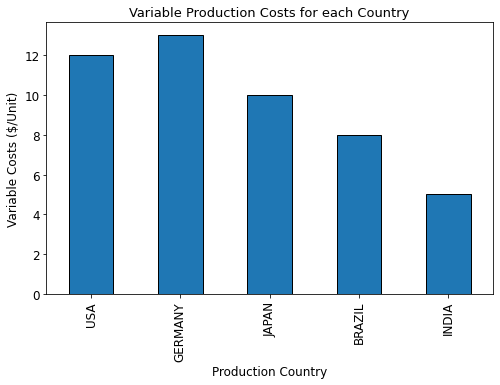
Fixed Costs + Variable Costs = Total Costs of Production
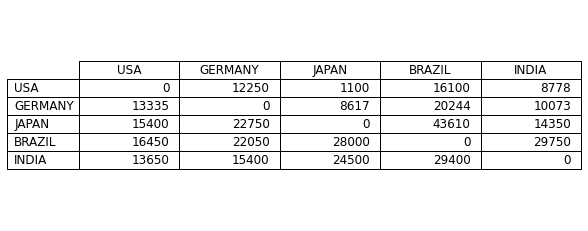
Freight Costs
Costs to ship a container from Country XXX to Country YYY.
Total Cost
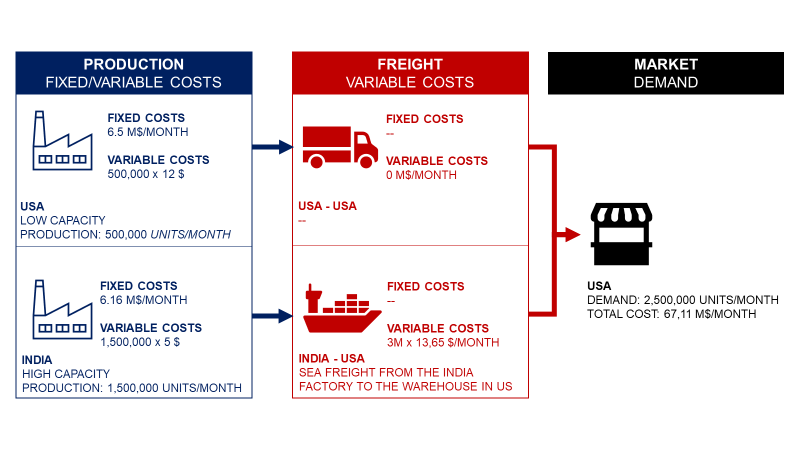
The total cost to produce and ship products to the market.
Based on market demand, where should I open factories?
Linear Programming Model
For more details, you can find a previous reference link where I explain in detail how to implement it using the PuLP Python library.
This is a classic problem of Linear Programming with an objective function, constraints and parameters.
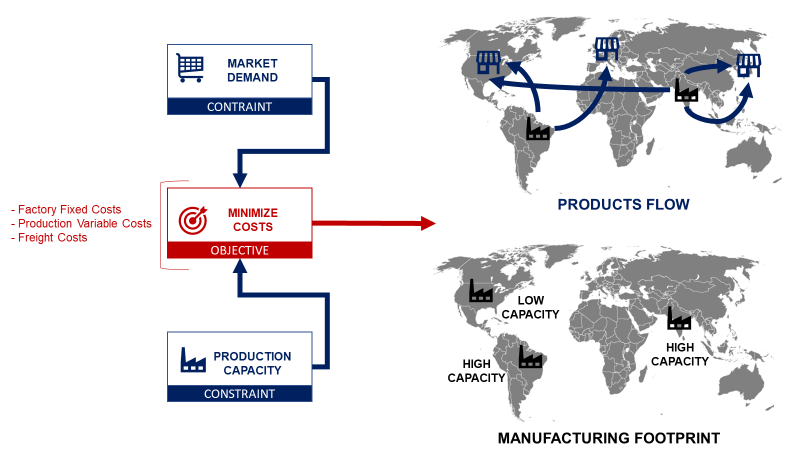
Manufacturing Footprint
Where do I need to open locations?
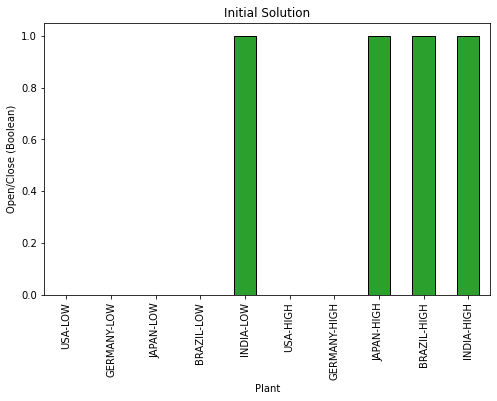
You need to open four locations in Brazil, the USA, Japan and India. Except in Brazil, all these locations are high capacity plants.
Products Flows
How many units are produced by factory YYY for Market XXX?

Japan's factory is only producing for the local market while Brazil and India are mainly driven by export demand.
Problem Statement
This solution has been implemented under the assumption of constant market demandutilisation.
Limits of the initial solution
What could be the impact if we have +10% in Japan and +20% in the US?
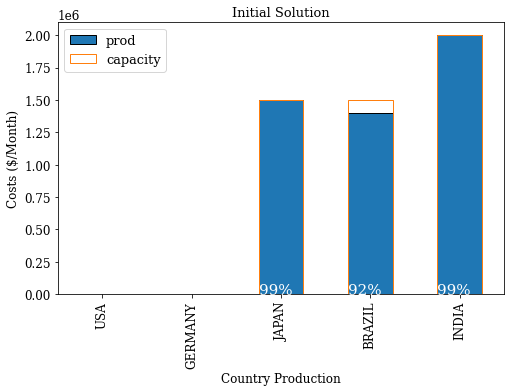
By looking at the utilisation rates, you can easily guess that your current footprint will not be able to adapt to this surge of demand.
Methodology of Simulation
We cannot rely on a single solution and expect our network to absorb demand year-round.
Usually, these parameters are calculated based on the yearly average of the sales.
Let’s simulate this demand variability and see the impact on the network design.
Generate 50 scenarios
We will assume that the demand follows a normal distribution with a coefficient of variation CV = 0.5. (You can adapt the distribution to your needs)
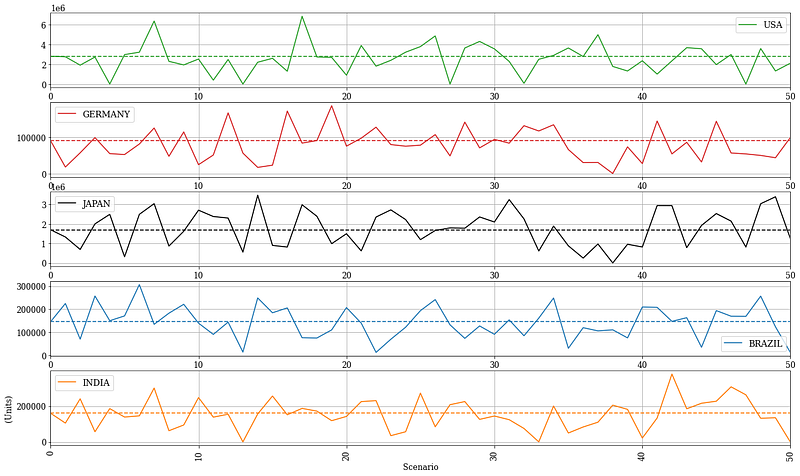
You now have a matrix of 50 columns that represent your 50 different scenarios.
Optimal Solution for each Scenario
What is the optimal combination for each scenario?
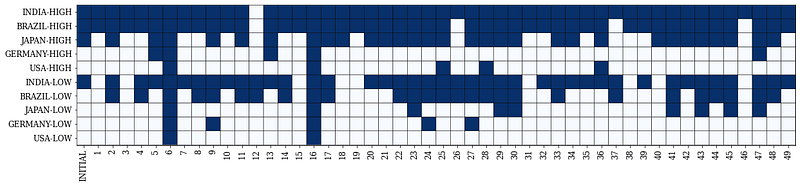
- India always has at least 1 facility open.
- Scenario 16 requires all facilities to remain open due to a peak in US demand.
- Scenario 12 only needs 2 LOW-capacity facilities in Brazil and India.
Distribution of the optimal combinations
Do we have combinations that appear more frequently than others?
After removing duplicates, we have 16 unique combinations
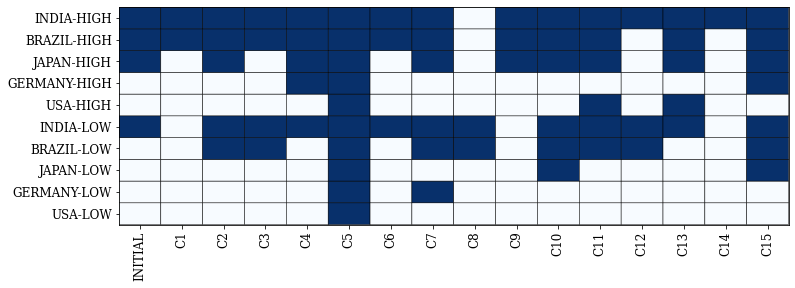
Which combination seems the most robust?
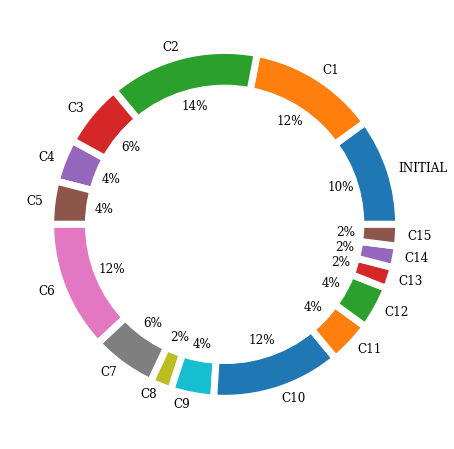
It seems that the combination of C2 (High/low plants in India and Brazil + 1 high plant in Japan) appears the most.
This combination is closely followed by C2, C6 and C10.
Final Solutions
It is not easy to draft a clear conclusion, but if we choose the safe solution, we need to take the C2 combination.
As it maximizes the footprint in the countries with low production costs, we are sure to meet the demand for most scenarios.
Next Steps
Conclusion
There is no perfect solution to this problem, as we must balance the priorities of securing the supply and reducing costs.
This methodology can be a good starting point to drive discussions around the target stock service level and production costs.
Now that we have a set of candidates for the potential BEST solution, we need to test them on our 50 scenarios:
- What is the total cost for each scenario?
- What is the percentage of demand produced by our facilities?
This will bring quantitative information to discuss with management and obtain a final arbitration.
Do you know that you can ask the support of Generative AI?
I experimented with the usage of Claude with an MCP Server for this exercise of Network Design.
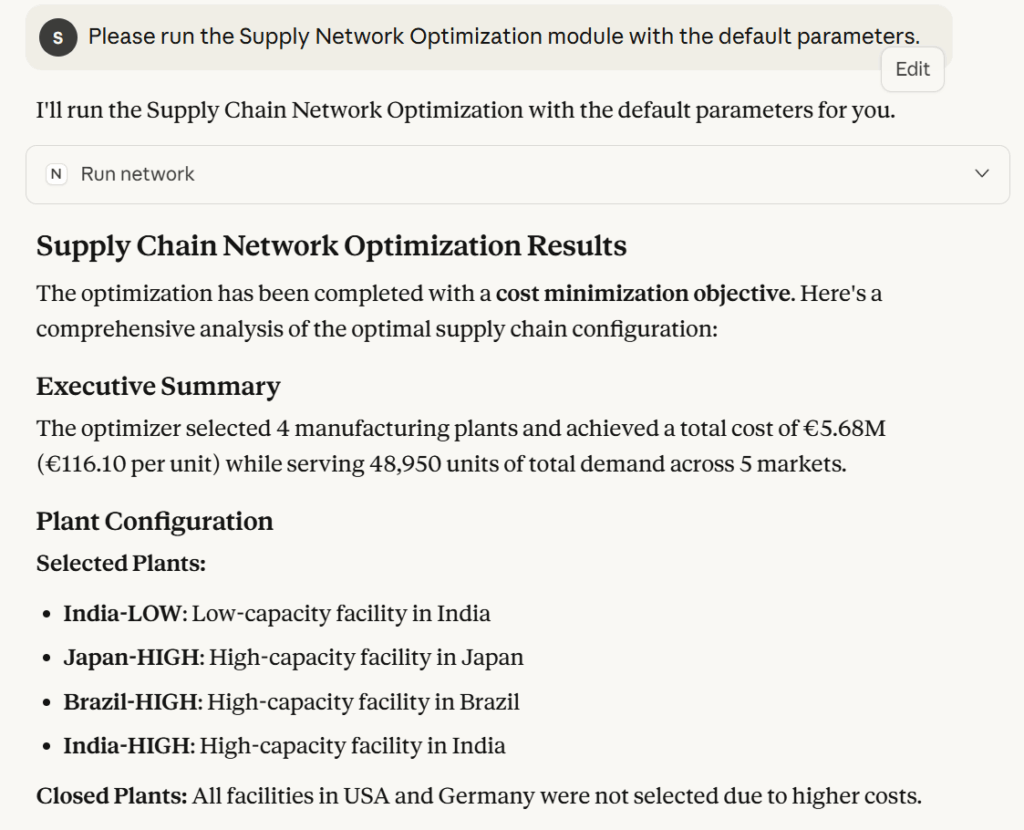
The idea was to equip this AI agent with a tool performing network optimisation and ask it to run multiple scenarios.
Claude provided very interesting insights that support the decision-making process.
For more details,
About Me
Let’s connect on LinkedIn and Twitter. I am a Supply Chain Engineer who is using data analytics to improve logistics operations and reduce costs.
If you’re looking for tailored consulting solutions to optimize your supply chain and meet sustainability goals, feel free to contact me.