Product Segmentation for Retail with Python
A statistical methodology to segment your products based on turnover and demand variability
Product segmentation refers to the activity of grouping products that have similar characteristics and serve a similar market.
It is usually related to marketing (Sales Categories) or manufacturing (Production Processes).
However, as a Logistics Manager, you rarely care about the product itself when managing goods flows, except for the dangerous and oversized products.
Your attention is mainly focused on the sales volumes distribution (fast/slow movers), demand variability and delivery lead time.
You want to put effort into managing products that have:
- The highest contribution to your total turnover: ABC Analysis
- The most unstable demand: Demand Variability
In this article, we will introduce simple statistical tools to combine ABC Analysis and Demand Variability to perform product segmentation.
💌 New articles straight to your inbox for free: Newsletter
I. Scenario
1. Problem Statement
2. Scope Analysis
3. Objective
II. Segmentation
ABC Analysis
Demand Stability: Coefficient of Variation
Normality Test
III. Conclusion
If you prefer coding with me, here is a complete end-to-end tutorial
Scenario
Problem Statement
You are the Operational Director of a local Distribution Centre (DC) that delivers 10 Hypermarkets.
In your scope, you have the responsibility of
- Preparation and delivery of replenishment orders from stores
- Demand Planning and Inventory Management
Scope Analysis
This analysis will be based on the M5 Forecasting dataset of Walmart stores' sales records.
We suppose that we only have the first-year data (d_1 to d_365):
- 10 stores in 3 states (USA)
- 1,878 unique SKU
- 3 categories and seven departments (sub-categories)
Except for the warehouse layout, categories and departments have no impact on your ordering, picking or shipping processes.
Code — Data Processing
What does impact your logistic performance?
Objective
Products Rotation
What are the references that are driving most of your sales?
- Very Fast Movers: top 5% (Class A)
- The following 15% of fast movers (Class B)
- The remaining 80% of very slow movers (Class C)
This classification will impact,
- Warehouse Layout
Reduce Warehouse Space with the Pareto Principle using Python
 Samir Saci
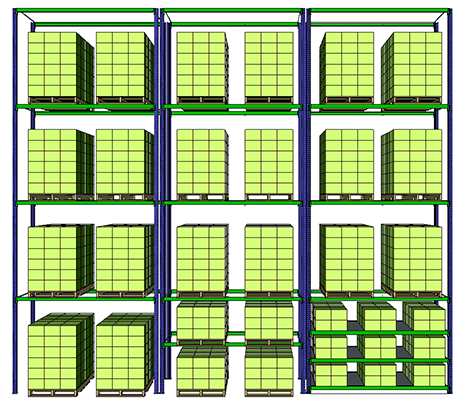
- Picking Process
Improve Warehouse Productivity using Order Batching with Python
Samir Saci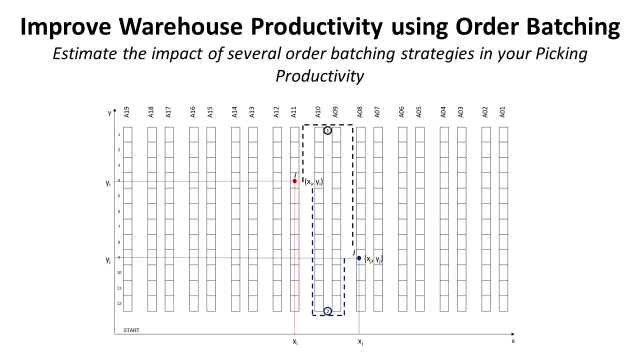
Demand Variability
How stable is your customers’ demand?
- Average Sales: µ
- Standard Deviation:
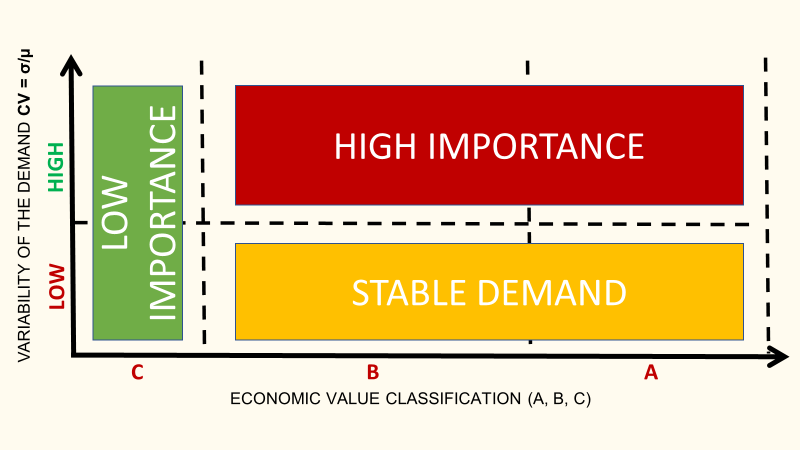
- Coefficient of Variation: CV = σ/µ
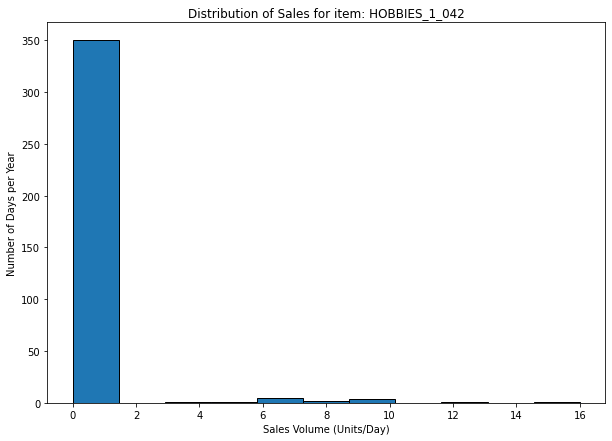
For SKUs with a high value of CV, you may face unstable customer demand that would lead to workload peaks, forecasting complexity and stock-outs.
Code
- Filter on the first year of sales for HOBBIES SKUs
- Calculate the Mean, Standard deviation and CV of sales
- Sorting (Descending) and Cumulative sales calculation for ABC analysis
Product Segmentation
This analysis will be done for the SKU in the HOBBIES category.
ABC Analysis
What are the references that are driving most of your sales?
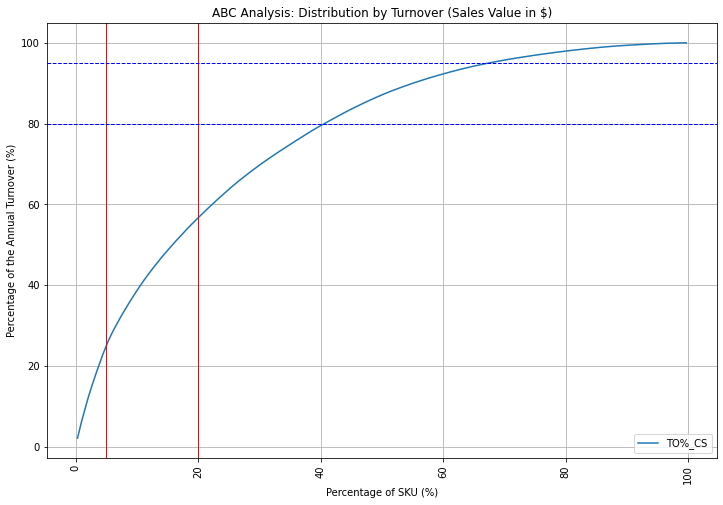
Class B: the following 15%- Number of SKU: 48- Turnover (%): 31%
Class C: the 80% slow movers
- Number of SKU: 253
- Turnover (%): 43%
In this example, we cannot clearly observe the Pareto Law (20% of SKUs making 80% of the turnover).
However, we still have 80% of our portfolio making less than 50% of the sales.
Code
How stable is your customers’ demand?
whoTo identify which products pose planning and distribution challenges, we will compute the coefficient of variation of each reference's annual sales distribution
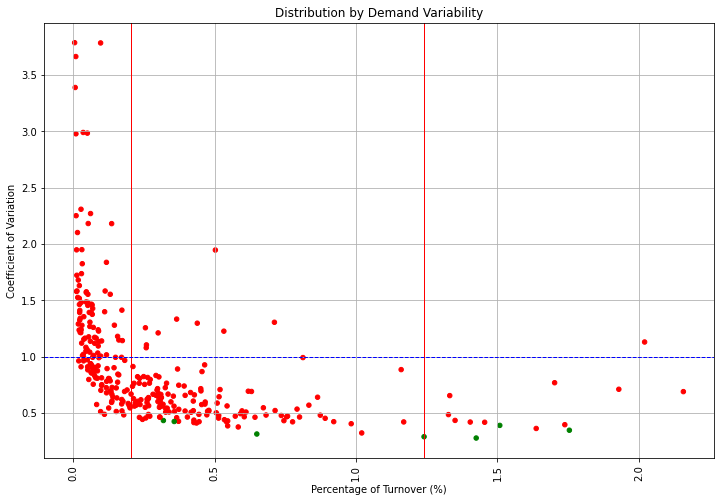
Demand Stability: Coefficient of Variation
From the Logistics Manager's perspective, it is much more challenging to handle a peak in sales than a uniform distribution throughout the year.
To identify which products pose planning and distribution challenges, we will compute the coefficient of variation of each reference's annual sales distribution.
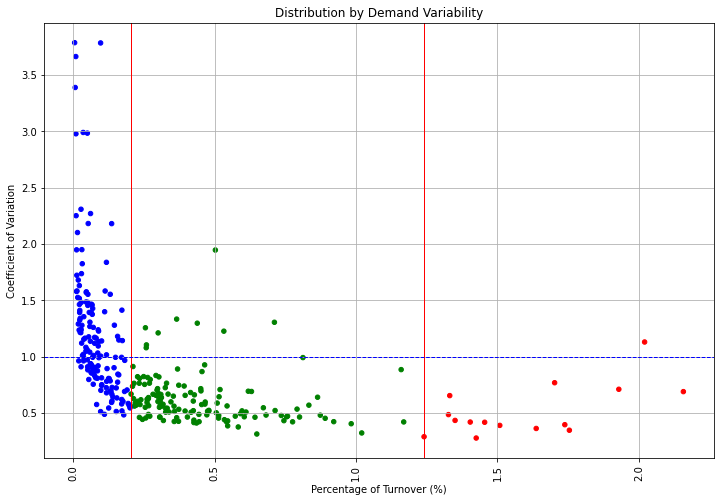
Fortunately, most of the A SKUs have a quite stable demand.
We won't be challenged by the most important SKUs.
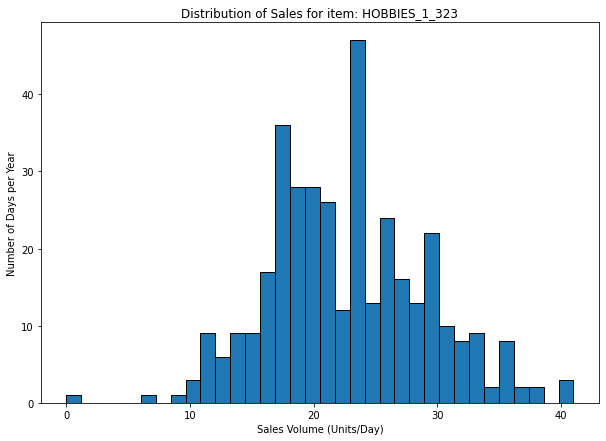
The majority of SKUs are in the stable area.
However, we still spend effort on ensuring optimal planning for the few references that have a high CV.
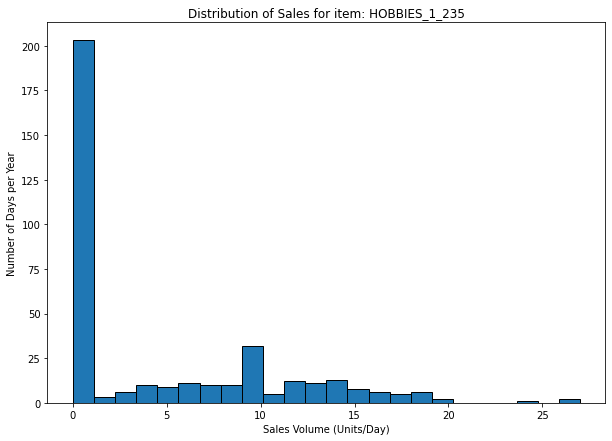
Most of the SKUs have a high value of CV
For this kind of reference, a cause analysis would provide better results than a statistical approach for forecasting.
Code
Can we assume that the sales follow a normal distribution?
Normality Test
Most simple inventory management methods assume that demand follows a normal distribution.
Why?
Because it’s easy.
Sanity Check
Before starting to implement rules and perform forecasts, it’s better to verify that this hypothesis cannot be refuted.
We’ll be using the Shapiro-Wilk test for normality.
It can be implemented using the Scipy library.
The null hypothesis will be (H0: the demand sales follow a normal distribution).
Bad News
For an alpha = 0.05, we can reject the null hypothesis for most of the SKUs.
This will impact the complexity of inventory management assumptions.
Code
Implement the complete solution using the code in this repository.
Conclusion
This operationally driven segmentation provides a few insights into the challenges your operations will face in planning and managing goods flows to meet your store's demand.
About Me
Let’s connect on LinkedIn and Twitter. I am a Supply Chain Engineer who is using data analytics to improve logistics operations and reduce costs.
If you’re looking for tailored consulting solutions to optimise your supply chain and meet sustainability goals, feel free to contact me.