Lean Six Sigma with Python — Chi-Squared Test
Perform a Chi-Squared Test to explain a shortage of drivers impacting your transportation network
Lean Six Sigma is a step-by-step approach to process improvement.
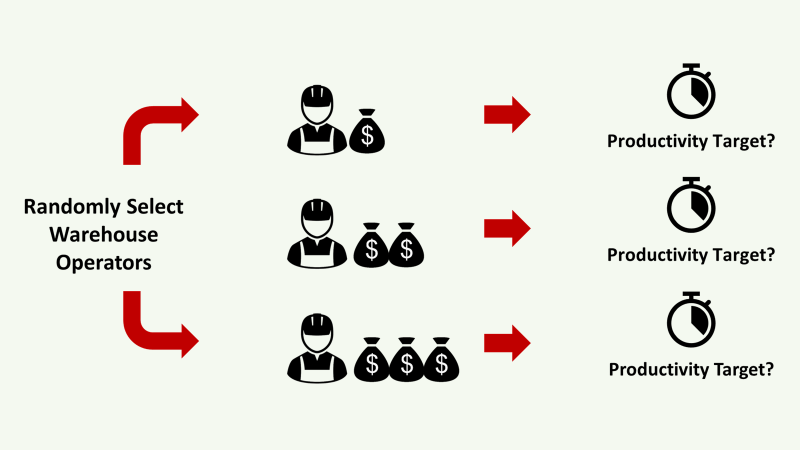
In a previous article, we used the Kruskal-Wallis Test to verify the hypothesis that specific training positively impacts operators' Inbound VAS productivity.
In this article, we will implement the Chi-Squared Test with Python to understand if transportation delays are due to a bad allocation of drivers.
💌 New articles straight to your inbox for free: Newsletter
I. Problem Statement
Transportation delays are due to drivers' allocation issues?
II. Data Analysis
1. Exploratory Data Analysis
Analysis with Python sample data from historical records
2. Perform Cross Tabulation
Summarise the relationship between several categorical variables.
3. Pearson’s Chi-Square Test
Validate that your results are significant and not due to random fluctuation
III. Conclusion
If you prefer to watch, there is a short explainer video to introduce the topic
Problem Statement
Scenario
You are the Inbound Transportation Manager of a small factory in the United States.
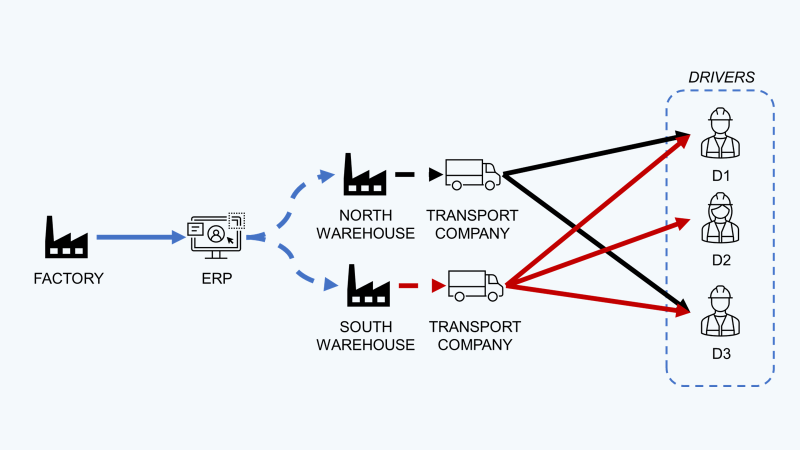
Your transportation network is simple.
You have two routes:
- Route 1: coming from your northern regional hub (with difficult road conditions and heavystep-by-step approach to process improvement traffic)
- Route 2: coming from your southern regional hub (with no traffic and a beautiful modern road)
Transportation is managed by an external service provider with a fleet of three trucks, each driven by a different driver (D1, D2, D3).
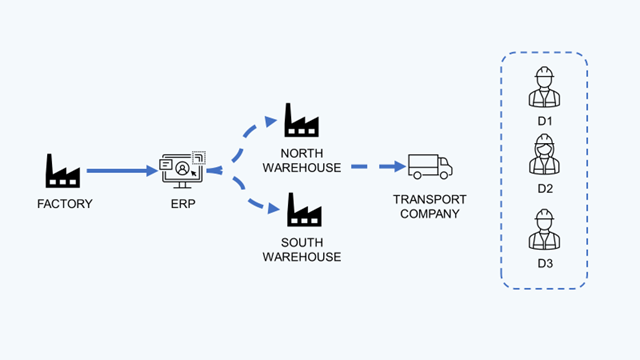
Replenishment Process
- The Factory sends a replenishment order to your ERP
- The Southern regional hub receives the order first
- If the stock in the southern hub is too low, then the order is transferred to the northern hub
- ERP sends a pick-up request to the transportation service provider (from the selected hub to the Factory)
- The first driver accepting the request is delivering the raw materials to the factory
P.S.: As customers, we do not have visibility into the driver allocation process.
Problem
When an order is allocated to the northern regional hub, the lead time for the request to be accepted is 35% higher than at the southern hub.
Question
Are there drivers avoiding as much as possible to be allocated to the north route?
Experiment
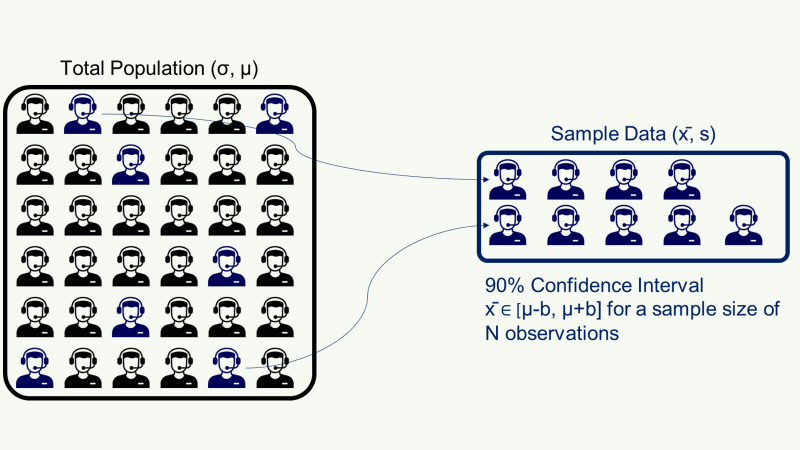
We have analysed the shipments of the last 18 months to build a sample of 269 records.
Data Analysis
Exploratory Data Analysis
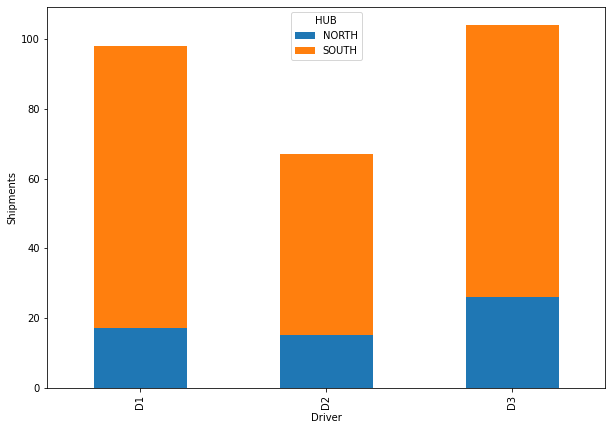
Perform Cross Tabulation
A cross-tabulation of the data can provide insights and help us identify potential patterns in the repartition of drivers’ allocations.
The objective is to assess whether the relationship between the variables is statistically significant.
Example
82.65 % of shipments handled by Driver 1 are from SOUTH HUB
Example
38.89 % of shipments from SOUTH HUB are handled by Driver 1
Menu Stats> Tables > Cross Tabulation and Chi-Square
Pearson’s Chi-Squared Test
The first table is also called a Contingency table. It is used in statistics to summarise the relationship between several categorical variables.
We’ll calculate the significance factor to assess whether the relationship between the variables is statistically significant using the Chi-Squared Test.
Conclusion
Because the p-value >0.05, there is no significant proof that the driver’s allocation is linked to the Hub.
Code
Conclusion
This analysis helped us to refute our initial feeling that some drivers deliberately avoid the northern hub.
Therefore, we need to conduct a deeper root-cause analysis to understand why our lead time to identify a replenishment driver from this hub is longer.
About Me
Let’s connect on LinkedIn and Twitter. I am a Supply Chain Engineer using data analytics to optimise logistics operations and reduce costs.
If you’re looking for tailored consulting solutions to optimise your supply chain and meet sustainability goals, feel free to contact me.