Inventory Management for Retail — Stochastic Demand
Simulate the impact of safety stock level on inventory management performance metrics assuming a normal distribution of your demand
For most retailers, inventory management systems adopt a fixed, rule-based approach to forecasting and order replenishment.
Given the demand distribution, the objective is to develop a replenishment policy that minimises your ordering, holding, and shortage costs.
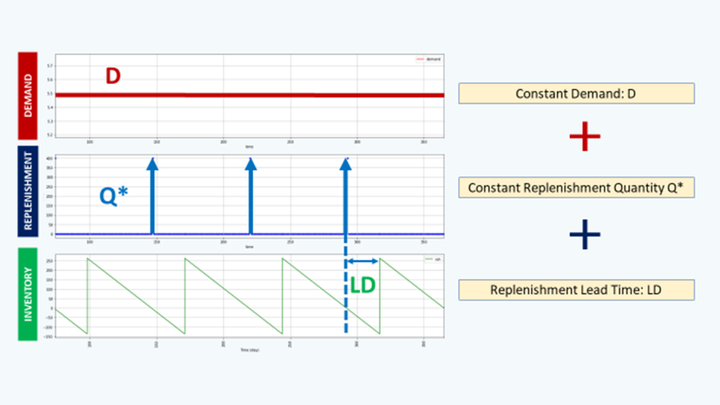
In a previous article, we built a simulation model assuming a deterministic constant demand (Units/Day).
In this article, we will improve this model with a simple methodology using a discrete simulation model built with Python
The idea is to test several inventory management rules, assuming a normal distribution of the customer demand.
💌 New articles straight to your inbox for free: Newsletter
I. Scenario
1. Problem Statement
2. Limits of the deterministic model
II. Continuous Review Policy: Order Point, Order Quantity (s, Q)
1. Introduction of the Inventory Policy
2. Definition of the Safety Stock
3. How do you define k?
III. Example of replenishment policies
1. Target of CSL = 95%
2. Target of IFR = 99%
III. Conclusion & Next Steps
Scenario
Problem Statement
As an Inventory Manager at a mid-sized retail chain, you are responsible for setting replenishment quantities in the ERP.
Store managers are questioning replenishment policies after experiencing stock-outs, overstock, and distribution costs that have increased substantially.
What can we do?
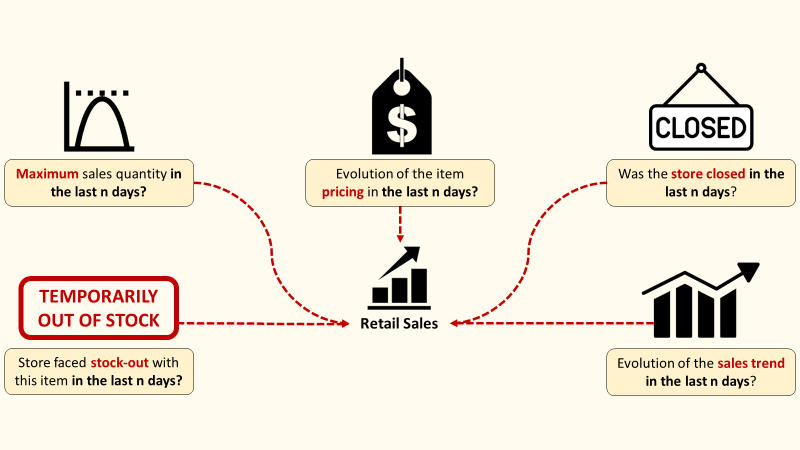
For each SKU, you would like to build a simple simulation model to test several inventory rules and estimate the impact on:
Performance Metrics
- Cycle Service Level (CSL): probability of having a stock-out for each cycle
- Item Fill Rate (IFR): % of customer demand met without stock-out
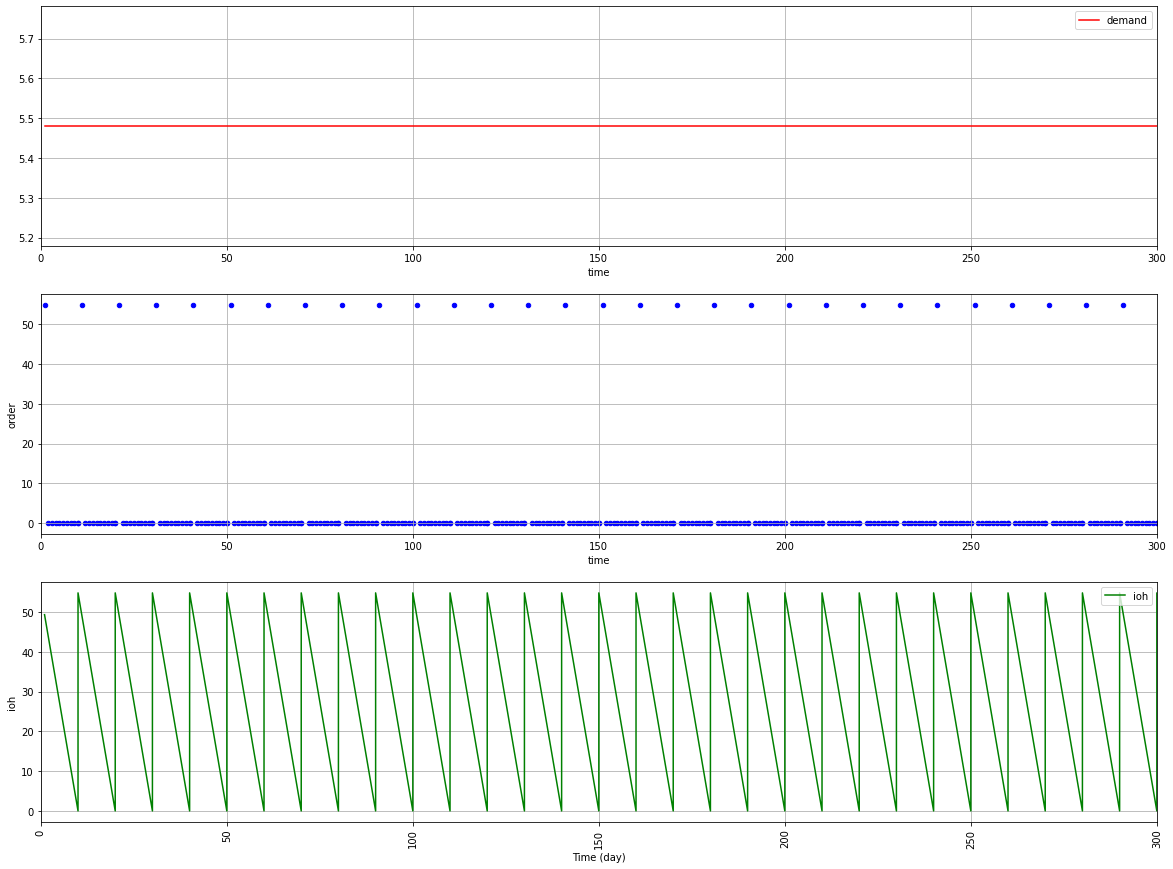
In this article, we will build this model for
D = 2000
Number of days of sales per year (days)
T_total = 365
Customer demand per day (unit/day)
D_day = D/T_total
Purchase cost of the product (Euros/unit)
c = 50
Cost of placing an order (/order)
c_t = 500
Holding Cost (% unit cost per year)
h = .25
c_e = h * c
Selling Price (Euros/unit)
p = 75
Lead Time between ordering and receiving
LD
Cost of shortage (Euros/unit)
c_s = 12
Order Quantity
Q = 82 (units/order)
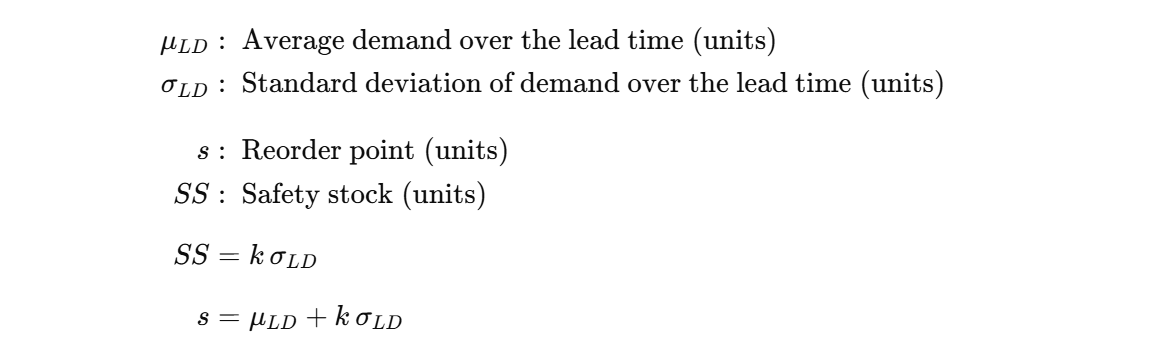
To simplify the comprehension, let’s introduce some notations
![A list of key variables used in the inventory management model with Python. The variables include reorder point (s), replenishment quantity (Q), expected units short (E[Units Short]), total c](https://www.samirsaci.com/content/images/2026/01/image-268.png)
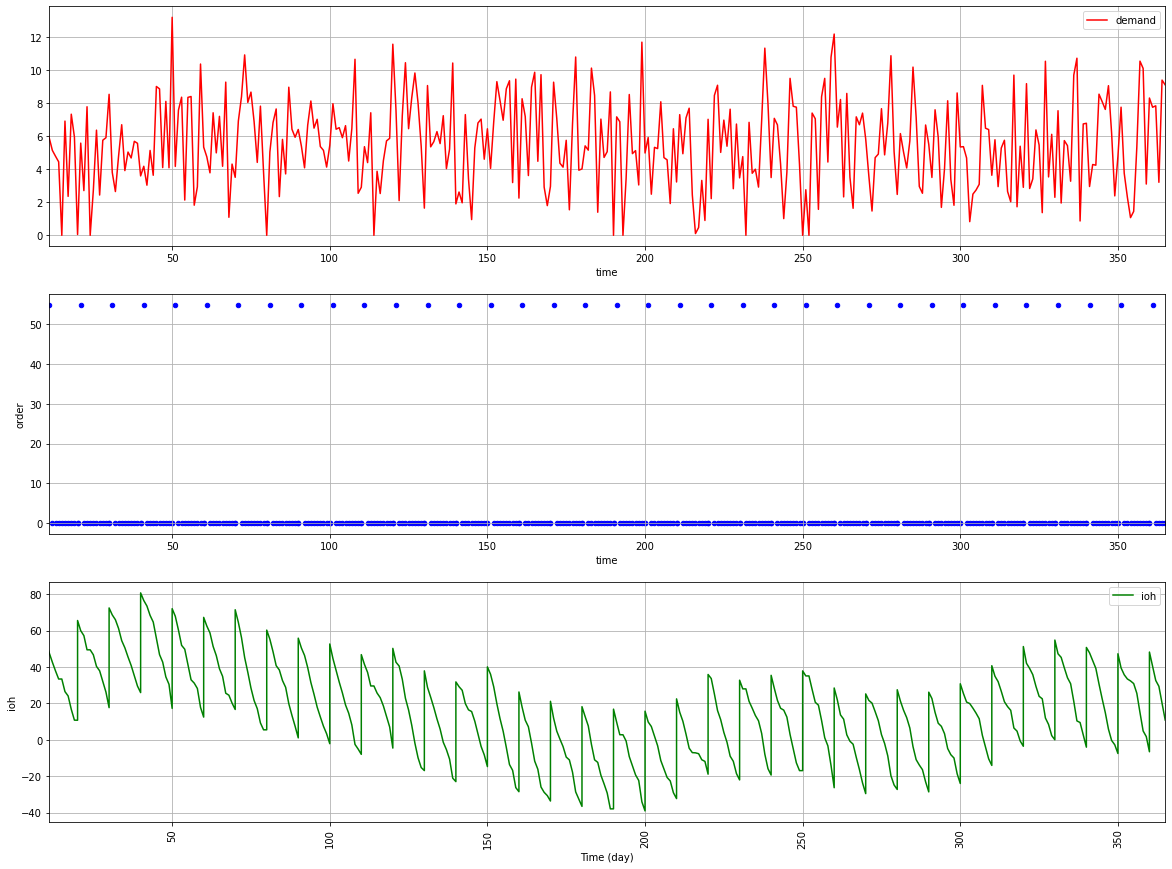
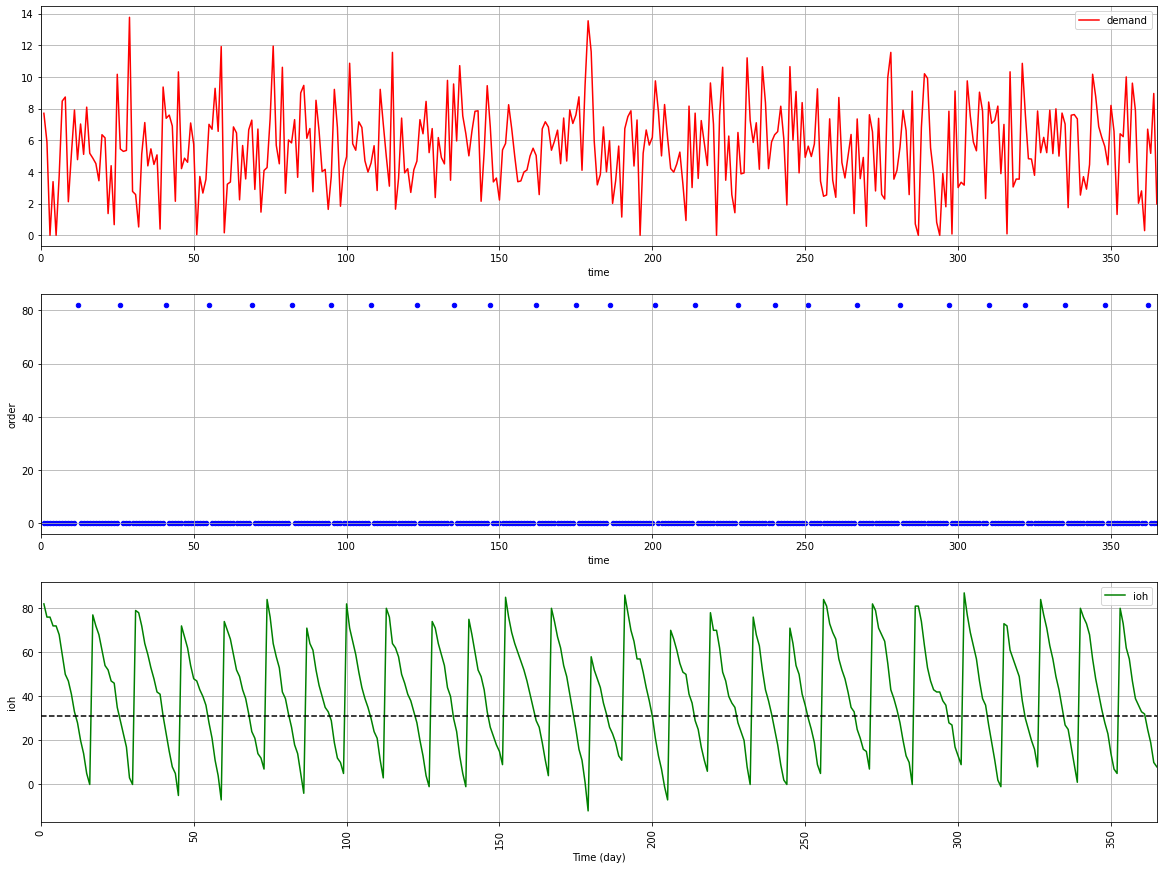
Limits of the deterministic model
In the previous article, we assumed a constant deterministic demand.
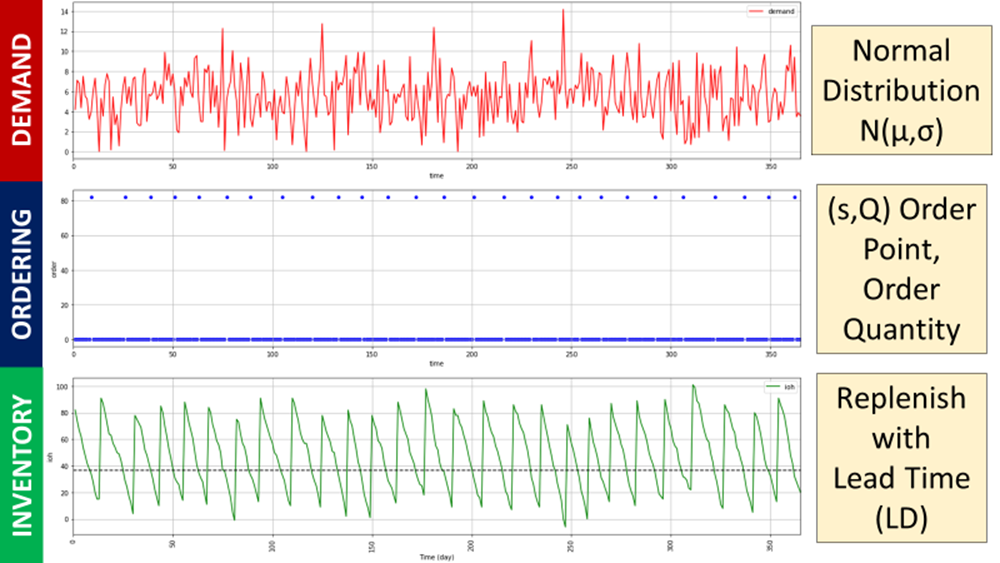
We will now introduce randomness to better approximate a real demand.
What could be the results with a normally distributed demand?
This is what we will simulate here.

Considering these inputs:
- µ_D = 2000 (items/year)
- σ_D = 50(items/year)
The result is drastically different.
Continuous Review Policy: Order Point, Order Quantity (s, Q)
Introduction of the Inventory Policy
To solve this issue of demand volatility, we’ll introduce a continuous review policy (s, Q)
- Continuous Review = your inventory level will be checked every day
- (s, Q) = if your inventory level ≤ s, your ERP will order Q
To simplify the comprehension, let’s introduce some notations:
Definition of the Safety Stock
The reorder point is the minimum inventory level required to meet customer demand during the lead time between ordering and receiving.
The safety stock serves as a buffer to compensate for demand volatility.
How do you define k?
Your performance metrics will be directly impacted by the safety stock level.
The highest k is the best, your performance will be:
- You fix your target for either of the two metrics (e.g, I want my CSL to be 95%)
- You calculate k to reach this target
- You fix your reorder point
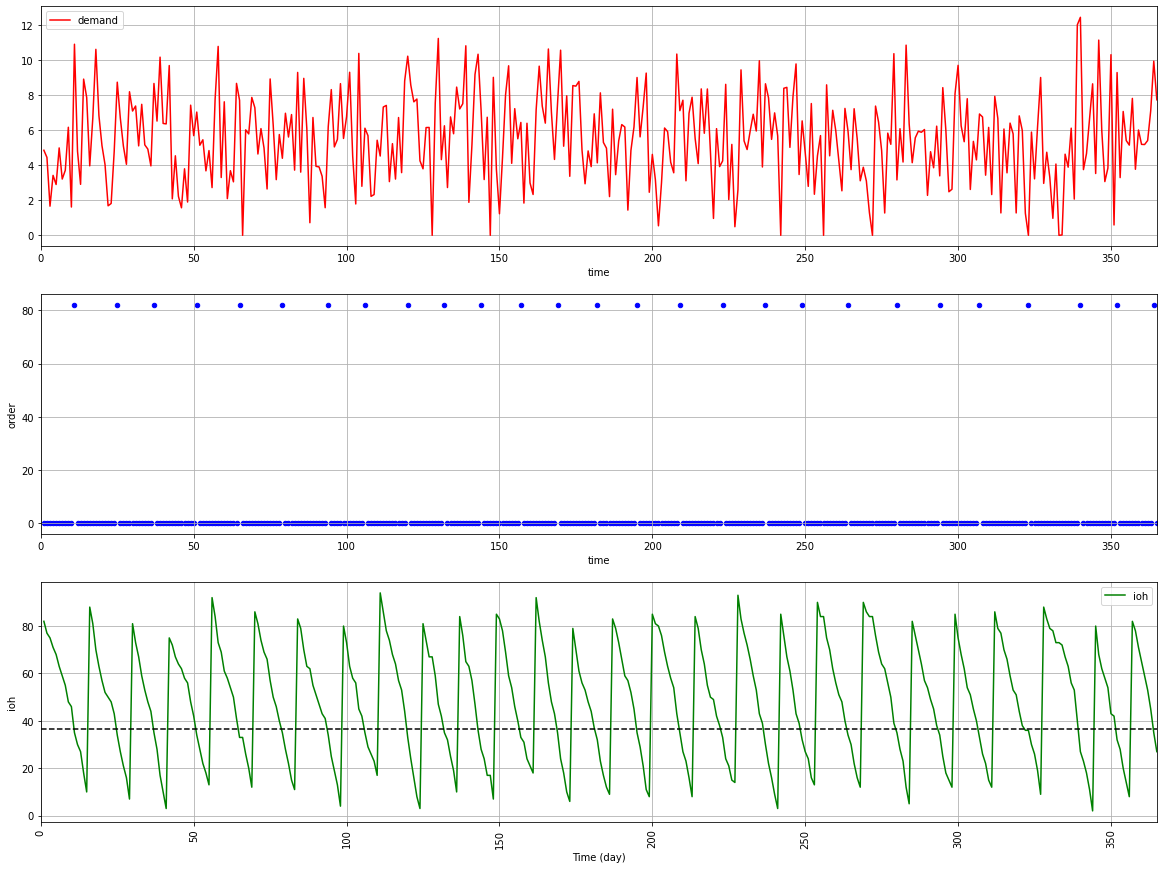
Example of replenishment policies
Target of CSL = 95%
Based on the definition of the CSL, we have:

For k = 1.64, our reorder point with CSL: 36 units
Code
Target of IFR = 99%
In the previous example, our target was to achieve 95% of replenishment cycles without stockouts.
In this example, we’ll focus on our capacity to deliver products in full with a target of IFR.
This formula uses the Unit Normal Loss Function:

This function can be graphically represented with this plot.
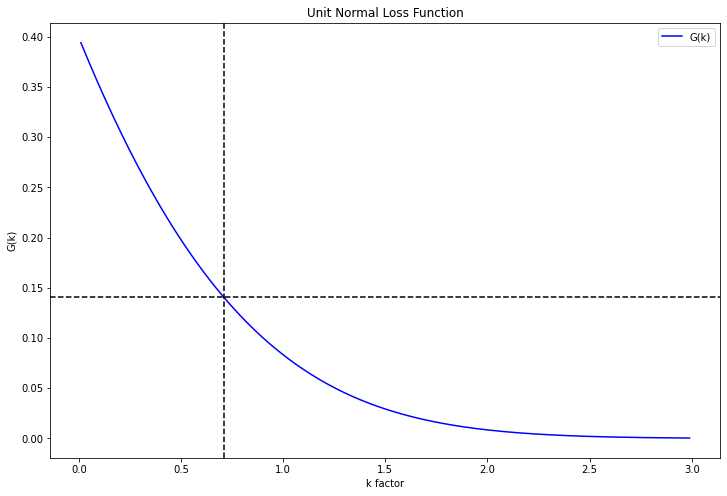
With,
IFR = 0.99
G_k = (Q/sigma_ld) * (1 - IFR) = 0.14
Final value of k
k = 0.71
Reorder point with CSL: 31 units
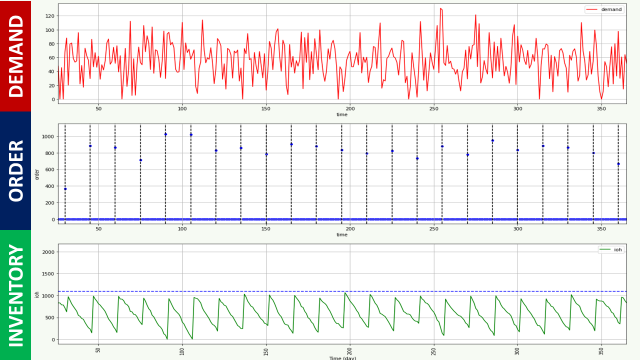
These parameters can be then used to simulate our inventory management rule.
You can easily implement this using Python.
Code
Conclusion
This improved model delivers better results by accounting for demand variability in safety stock sizing.
The process is simple:
- Start by fixing your performance metrics targets (IRF, CSL)
- Calculate your safety stock level using the k value.
Do you know that we can easily implement it using Streamlit?
On my YouTube channel, you can find a complete end-to-end tutorial in which we implement a similar rule on a web application.
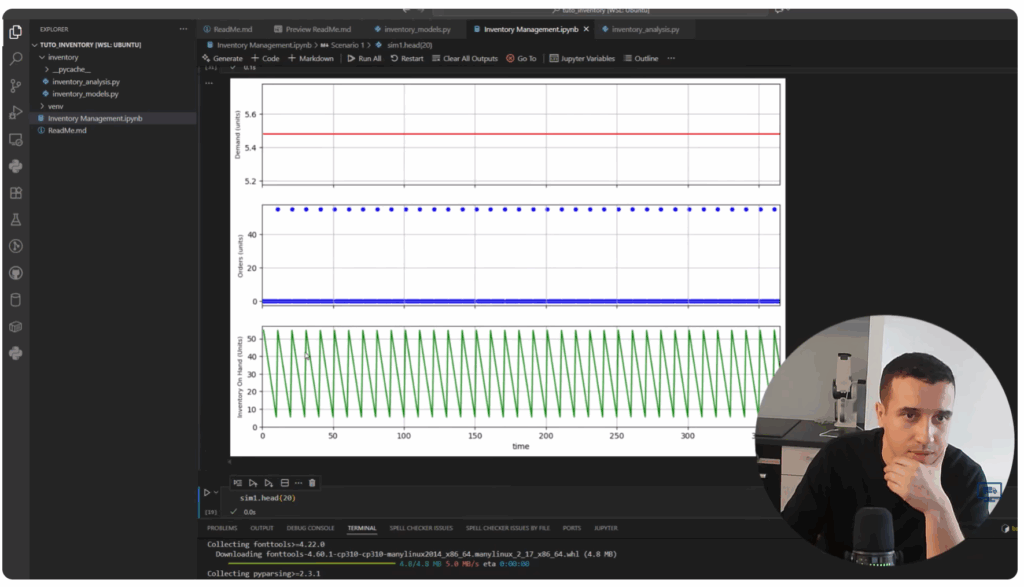
This is an effective way to productize your model so that anyone can use it.
For more details,
What about a Periodic Review Policy?
The main issue with the continuous review policy is the high number of replenishment cycles when your portfolio contains many SKUs.
As a store or warehouse manager, you would prefer to set the replenishment frequency (e.g., 2 times per week).
Therefore, we will introduce the periodic review policy in the next article.
About Me
Let’s connect on LinkedIn and Twitter. I am a Supply Chain Engineer who is using data analytics to improve logistics operations and reduce costs.
If you’re looking for tailored consulting solutions to optimise your supply chain and meet sustainability goals, feel free to contact me.