Inventory Management for Retail — Periodic Review Policy
Implement inventory management rules based on a periodic review policy to reduce the number of stores replenishments.
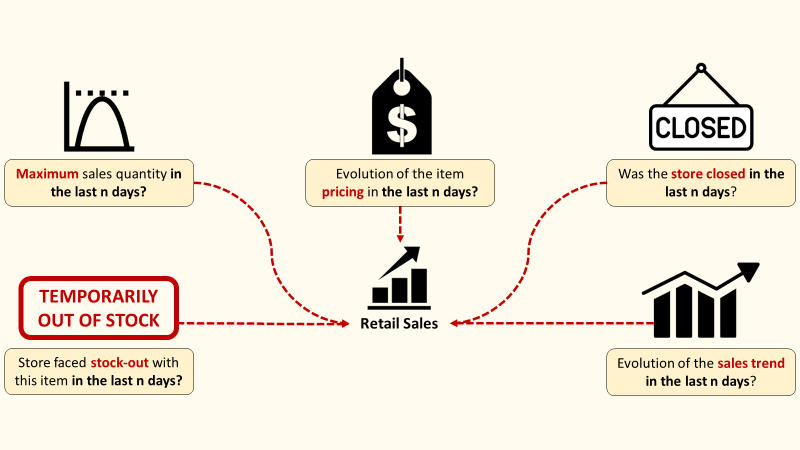
Design inventory management rules to simplify logistics, minimise stock levels, and meet store demand.
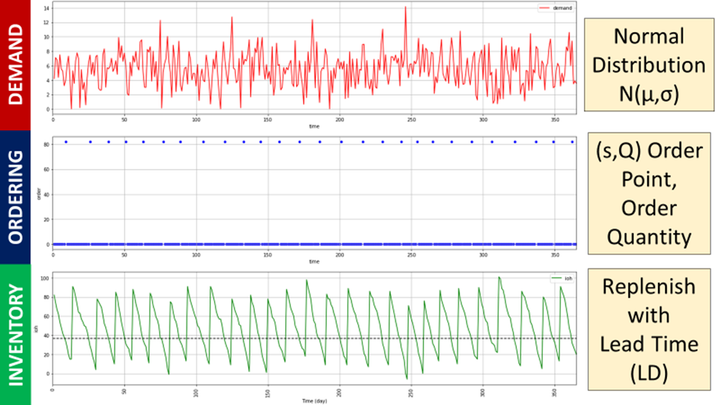
In a previous article, we built a simulation model based on a continuous-review inventory policy, assuming a normal distribution.
However, such a policy can be inefficient for large portfolios of items with varying replenishment cycle lengths.
In this article, we will improve the solution periodic review policy in Python to limit the number of replenishments.
💌 New articles straight to your inbox for free: Newsletter
I. Scenario
1. Problem Statement
2. Limits of the continuous review policy
What is the impact a continuous review policy on the number of replenishments when you handle several hundred SKUs?
II. Periodic Review Policy: Order-Up-To-Level (R, S)
1. Introduction of the Inventory Policy
2. Definition of the Safety Stock3. How do you define k?
III. Example of Replenishment Policies
IV. Conclusion
Scenario
Inventory Management for Retail
As an Inventory Manager at a mid-sized retail chain, you are responsible for setting replenishment quantities in the ERP.
Because your warehouse operations manager is complaining about order frequency, you begin to challenge the replenishment rules implemented in the ERP, especially for the fast-runners.
Previously, we implemented several inventory rules based on continuous review policies.
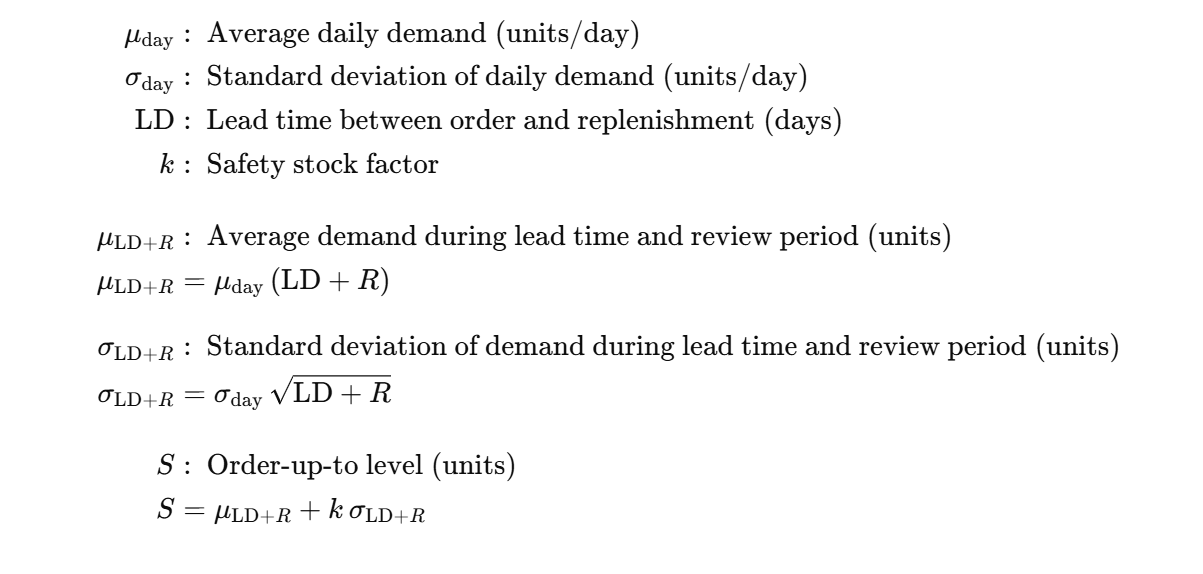
At each time t, we check the inventory on hand (IOH):
Example for 1 SKU
We need 27 replenishment orders per year.
How often do you need to order when managing 2,294 SKUs?
Limits of the continuous review policies
We suppose that we only have 365 days of sales
- 10 stores (STORE_1, … STORE_10)
- 1 product family (FOOD_GROCERY)
- 2,294 unique SKU (STORE ID + PRODUCT FAMILY + ITEM CODE)
Simulation 1
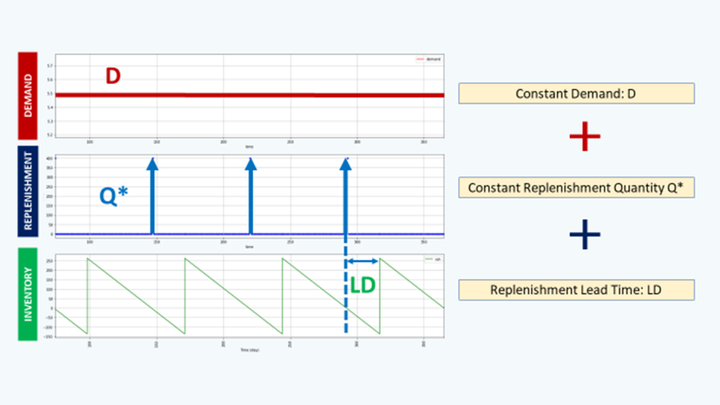
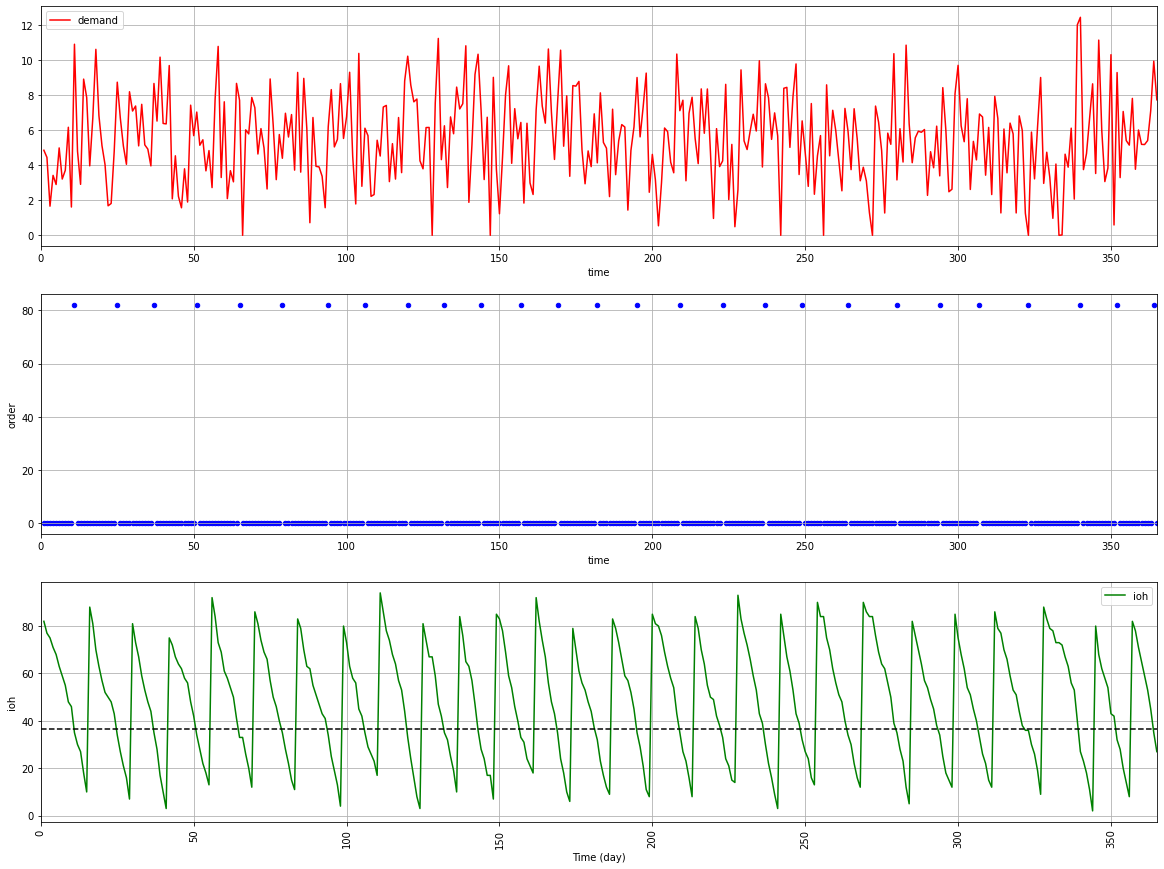
Let’s implement the continuous review policy for 1 SKU
- SKU: STORE_1-FOOD_GROCERY_009
- Safety stock designed with k = 3
(3 times the standard deviation of the demand distribution) - Order Quantity: Q = 3 x Average_Annual_Sales
Simulation 2
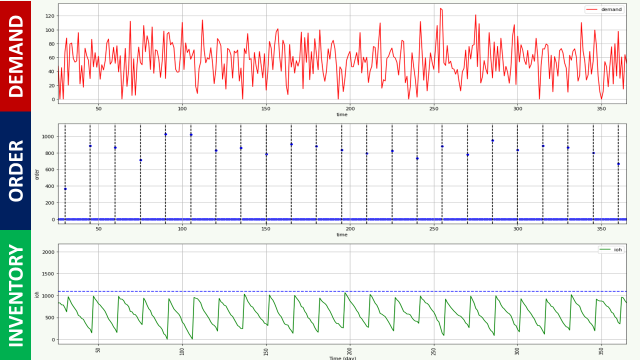
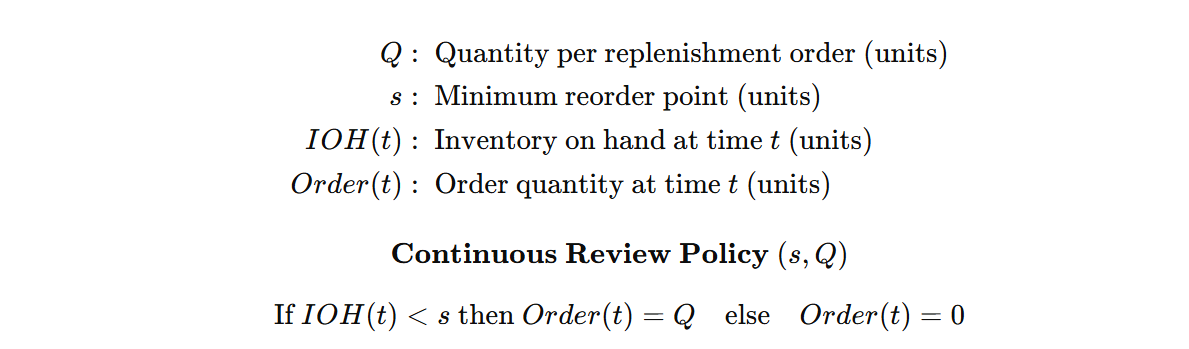
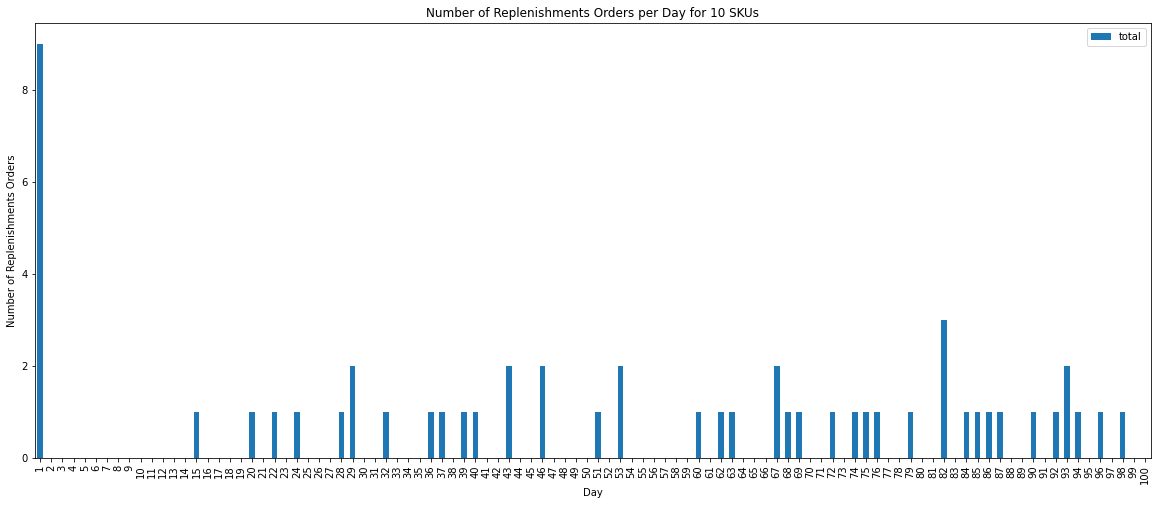
What if we now have 10 SKUs to manage?
Simulation 3
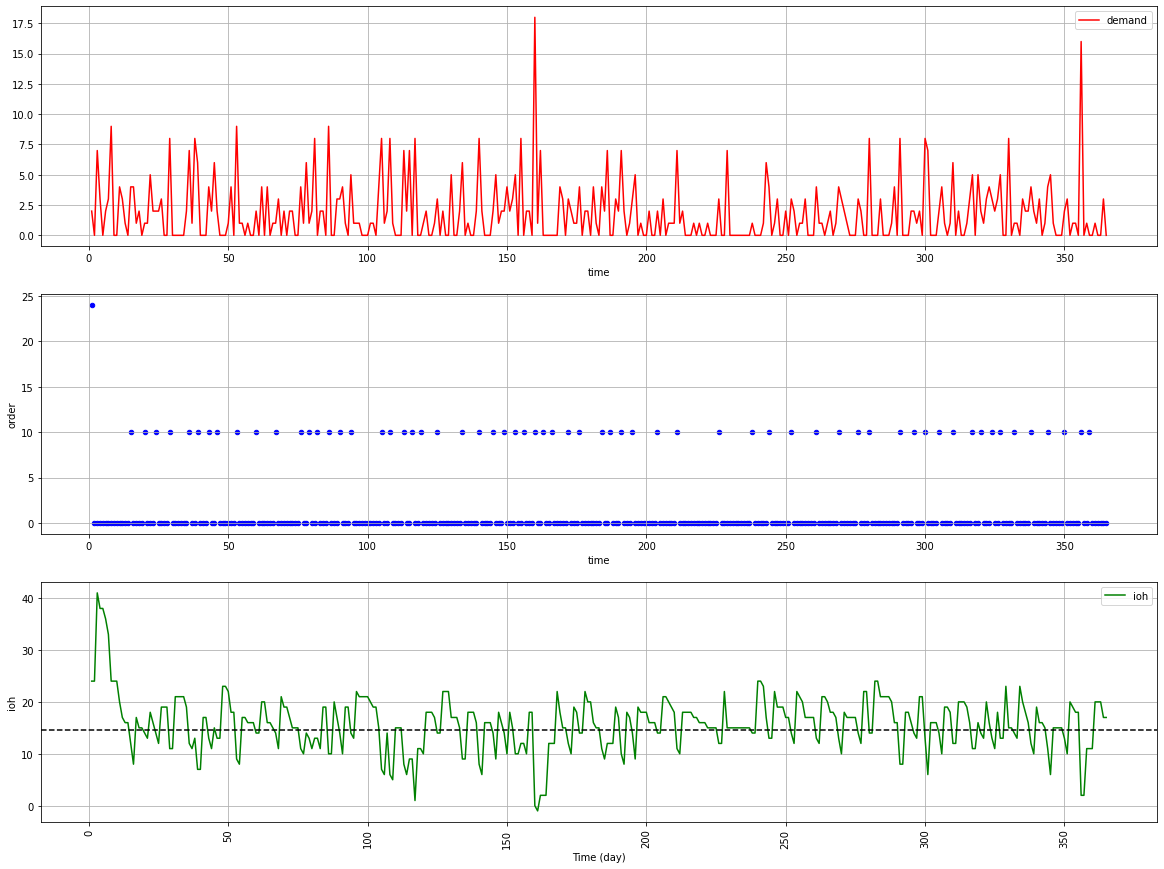
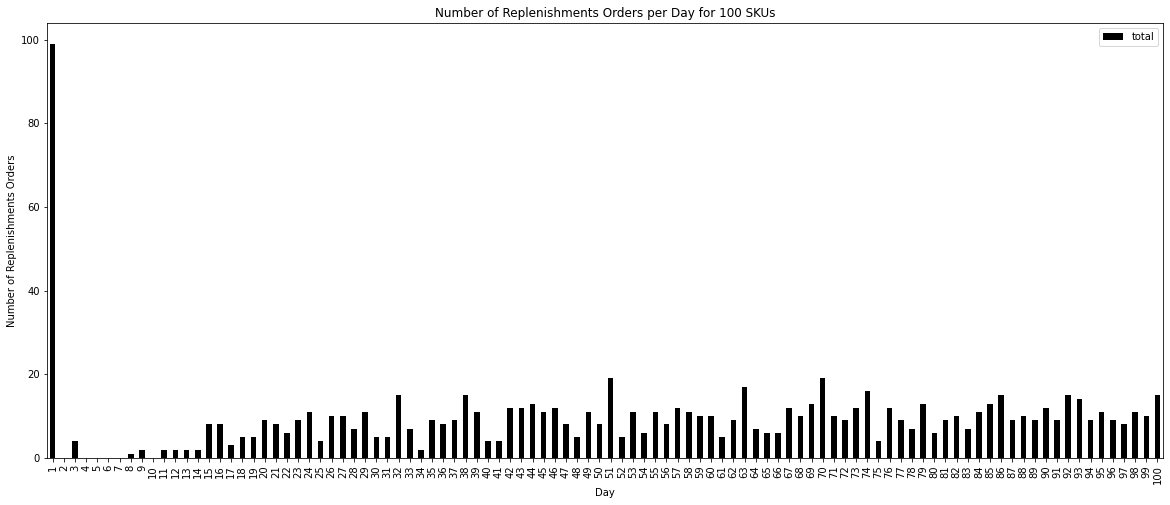
What if we have 100 SKUs to manage?
Simulation 4
What if we have 2,294 SKUs to manage?
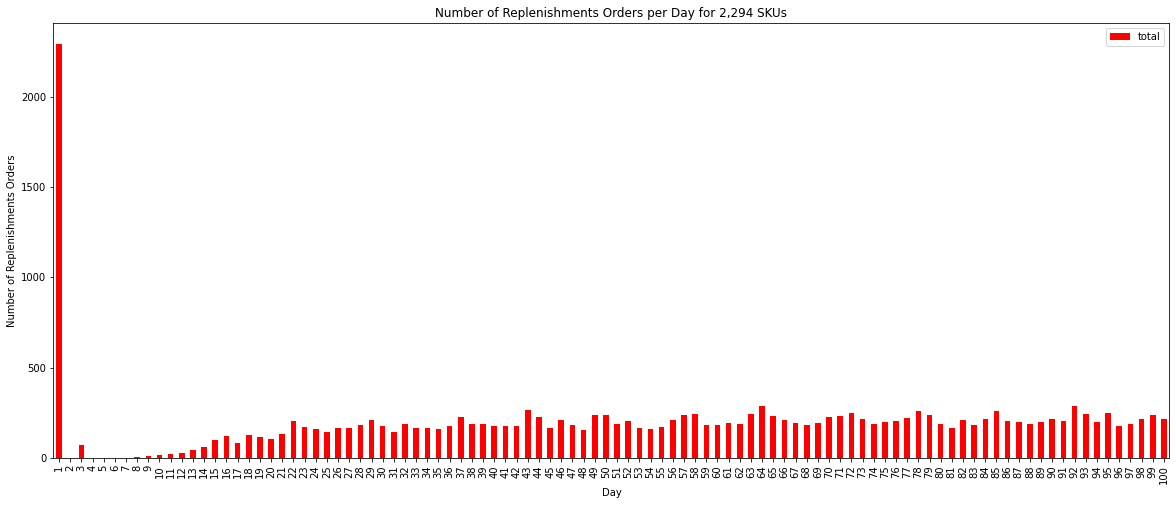
With this method, the number of replenishments is exploding when you have a large portfolio.
Solution
We will develop a replenishment policy based on periodic reviews.
Periodic Review Policy: Order-Up-To-Level
Introduction of the Inventory Policy
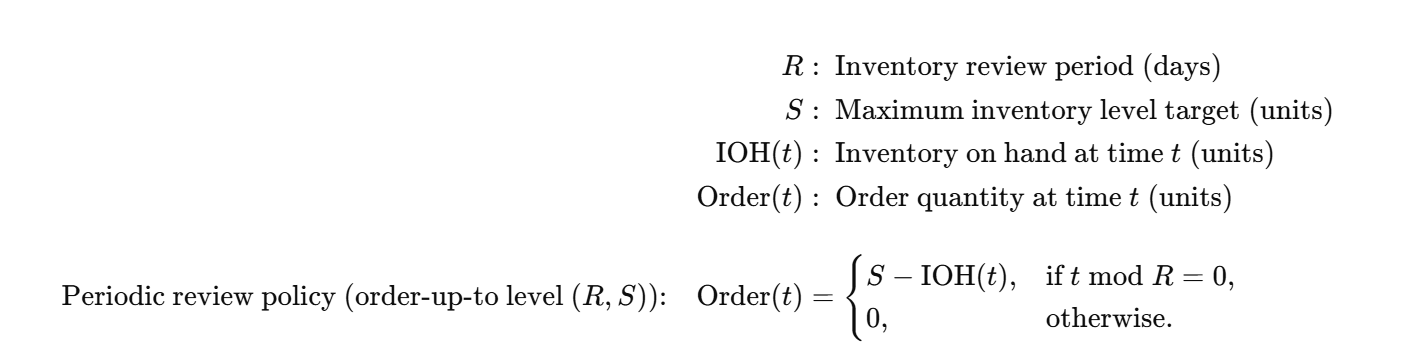
To solve this issue of replenishment frequency, let us introduce a periodic review policy (s, Q)
- At each period R, the inventory on hand (IOH) level will be reviewed
- Stores will order to reach an inventory level of S
To simplify the comprehension, let’s introduce some notations:
Definition of the Order-Up-To-Level S
How to calculate the level S:
The level S is calculated to ensure the inventory covers demand during the review period and the replenishment lead time.
How do you define k?
Your performance metrics will be directly impacted by the safety stock level
- You fix a target for either of the two metrics (e.g, I want the Cycle Service Level to be 95%)
- You calculate k to reach this target based on the distribution of your demand (Normal, Poisson)
- You fix your reorder point
Code
Example of replenishment policies
Example with SKU: STORE_1-FOOD_GROCERY_009
Review Period: R = 10 days
k = 1
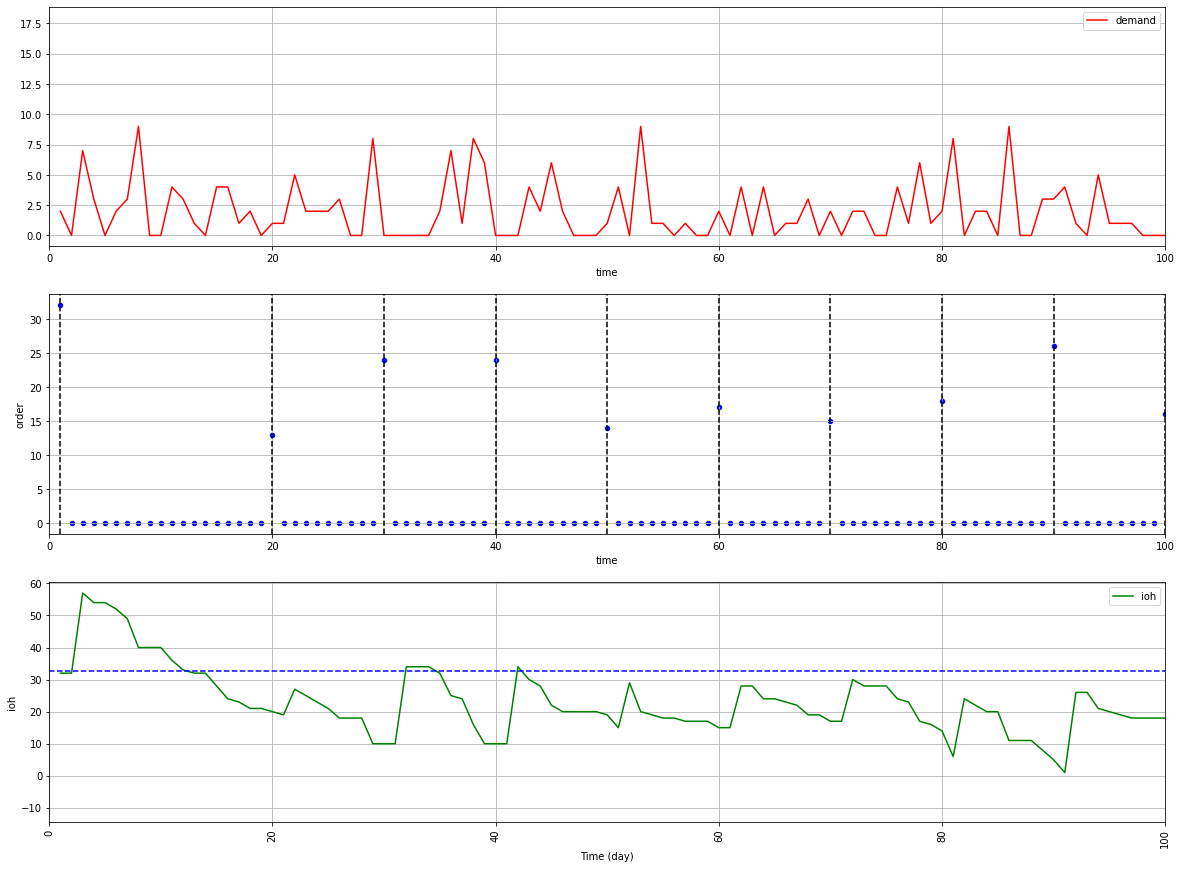
How many replenishments if you handle the full portfolio?
Comments
13,986 replenishments vs. 19,267 replenishments in the first 100 days with only 10 days of replenishments
You can implement this model for your company.
Conclusion
After implementing this policy, you will reduce your operating costs by
- Limiting the time windows of replenishments
This will optimise your resources for inventory management, order preparation and transportation management. - Reducing the number of replenishments
This will increase the quantity per replenishment and enable shipment consolidation for stores delivered at the same time.
With the overall objective of optimising the performance of your distribution chain.
How to measure logistic performance?
In this short explainer video, I define the indicators used to measure the performance of a distribution chain, illustrated with a fashion retailer example.
About Me
Let’s connect on LinkedIn and Twitter. I am a Supply Chain Engineer who is using data analytics to improve logistics operations and reduce costs.
If you’re looking for tailored consulting solutions to optimize your supply chain and meet sustainability goals, feel free to contact me.