Data Analytics for Supply Chain Sustainability
Use data analytics to reduce the environmental impact of your end-to-end Supply Chain Operations with diagnostics and strategic decisions
The demand for transparency in sustainable development from investors has grown over the years and 2030 became the first significant milestone.
An increased emphasis on the sustainability of organizations has been placed via the ESG score.
Therefore, companies are now rushing to implement roadmaps for CO2 emissions reductions.
In a previous publication, I presented Supply Chain Analytics as a set of tools to improve operations performance and reduce costs for an international fashion retailer.
In this article, we will focus on using the same tools and methodologies to reduce the environmental impact of your end-to-end Supply Chain.
💌 New articles straight to your inbox for free: Newsletter
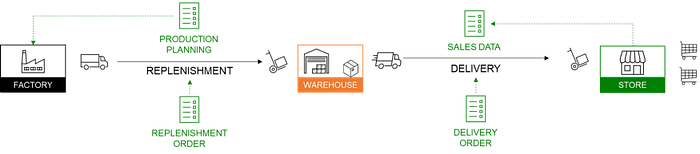
Different Types of Supply Chain Analytics
Supply Chain Analytics is a set of tools and methodologies using flows of information to answer questions and support decision-making.
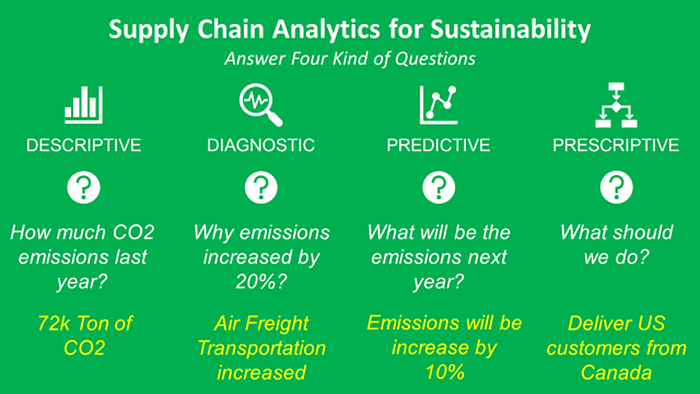
Each type can answer specific questions and support the green transition of your operations by using methodologies, mathematical concepts and analytics tools.
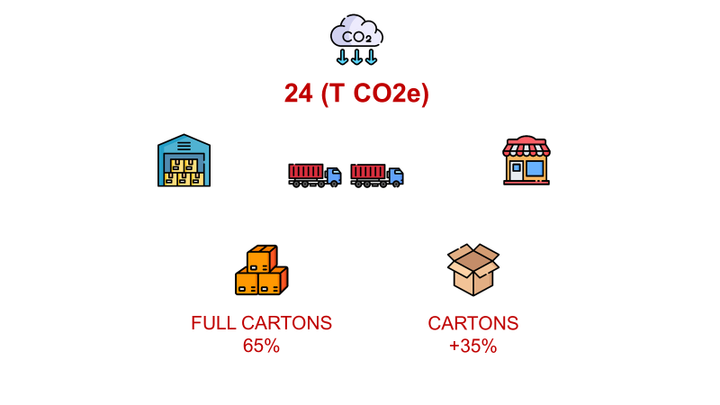
Descriptive Analytics: CO2 Emissions Reporting
How many tons of CO2 are emitted by my distribution network?
This is the first step in your green transformation: measure the environmental impact of your operations.
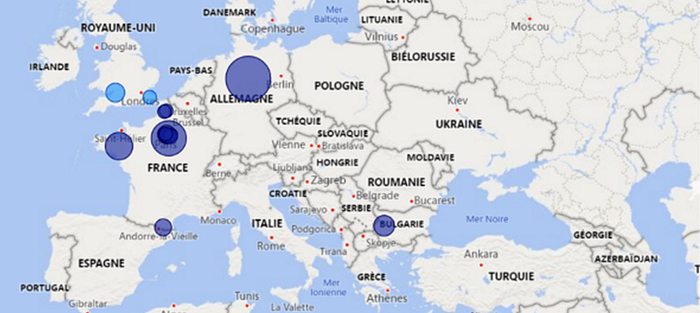
A set of tools to provide visibility and a single source of truth across the supply chain to measure CO2 emissions:
By Country
By item
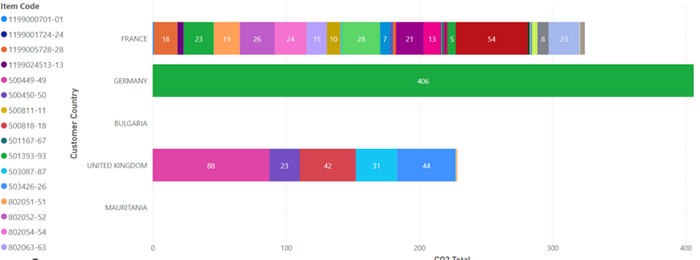
The idea is to measure CO2 emissions across the value chain and produce reports to understand the impact of each leg of your distribution network.
It looks like the easiest type from a mathematical point of view.
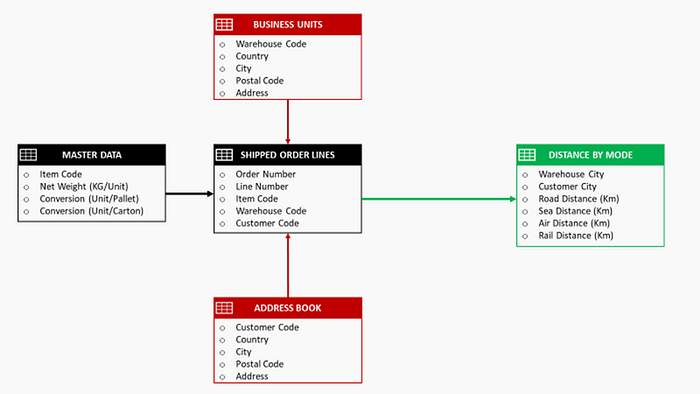
However, it may be the main bottleneck of your green transformation as it requires harmonizing data from different systems.
This is necessary if you want to build a strong basis to create reports and feed your advanced models for predictive, diagnostic or prescriptive analytics.
- Data extraction, transformation and processing with SQL, Python
- Visualizations using matplotlib and PowerBI
🚀 RESULTS
The measure of the emissions by scope and market to build the baseline of your transformation roadmap.
For more details, you can have a look at this video
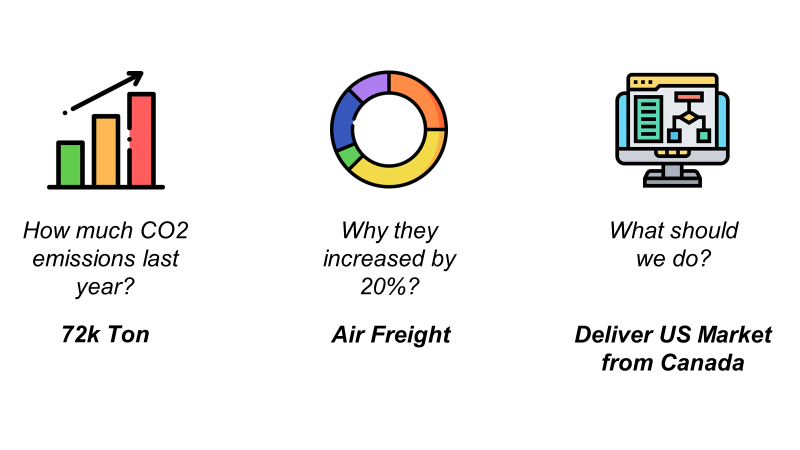
Diagnostic Analytics: Product Life Management
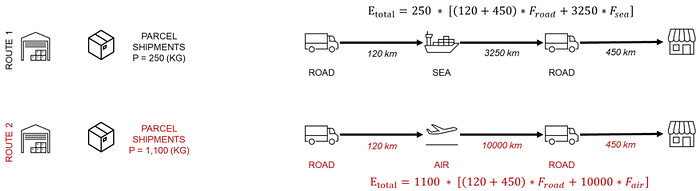
What is the most polluting mode of transportation in France?
This step is very close to descriptive analytics.
After building a single source of harmonised data, we can track the emissions along the value chain.
💡 INSIGHTS
If your colleague from the sustainability team is asking you why emissions doubled last year.
1. Have a look at the historical data
2. Split the emissions by transportation mode (road, air, sea)
This will help you understand that transportation teams replaced sea freight with air freight after production delays.
This kind of diagnostic can help your management spot the biggest emissions sources and focus on them.
📊 ADDITIONAL KPIS
You can implement additional KPIs such as % of air freight (high emissions), and % of electric last-mile delivery to bring a more proactive approach and trigger alerts if needed.
Prescriptive Analytics: update your objective functions
Where should we locate our factories to minimize the CO2 emissions of our Supply Chain Network?
In the previous article, I presented solutions that assist the operations to solve problems and optimize the resources to reach the best efficiency.
For your green transformation, the tools and methodologies will be similar. The only difference is that your objective function will support the reduction of CO2 emissions.
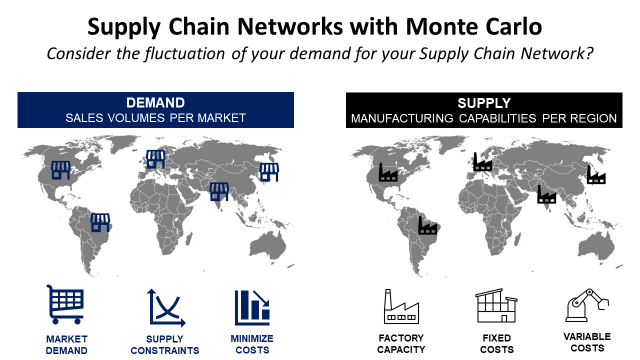
In a previous article, I used a methodology to design an optimal network of factories to manufacture and deliver products to specific markets.
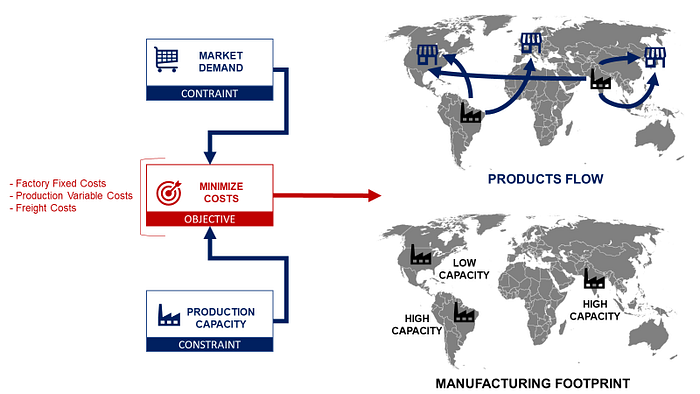
The idea was to use a linear programming model to select decision variables (factory locations) to produce and deliver products at a minimum cost.
In this kind of exercise usually, markets are very far from cheap production locations.
Therefore, you'll have high levels of CO2 emissions due to transportation.
What if now we change the objective function?
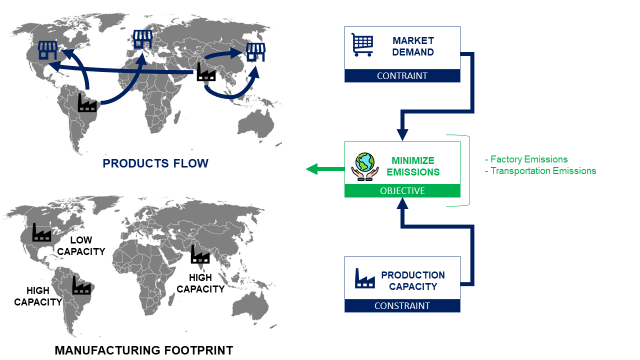
Let us now ask the model to minimize the CO2 emissions considering transportation and production while respecting the constraints of markets’ minimum supply.
You may need to completely transform your network to get plants close to your markets. The impact on the cost will be not negligible as you'll have to produce in countries with high labor costs.
💡 GO BEYOND
Improve your model by including several transportation modes (electric, low emissions cargo fuels) that may increase the costs but reduce your CO2 footprint. Thus, you may find alternative solutions and keep some of your facilities in competitive countries.
Conclusion
Same method, Same tools
For descriptive analytics, nothing changes, except that you now need to place greater emphasis on data quality.
For the rest, adjust your focus and include CO2 emissions reductions in your objective functions.
More details about the different types of Supply Chain Analytics are in this short video.
A mixed approach
Everything here should be adapted considering the value of the goods you produce and deliver.
It may not be reasonable to focus only on CO2 reductions if you want to keep an appropriate level of profitability.
Therefore, you need to be innovative and use alternative solutions supported by data-driven insights.
About Me
Let’s connect on LinkedIn and Twitter. I am a Supply Chain Engineer who is using data analytics to improve logistics operations and reduce costs.
If you’re looking for tailored consulting solutions to optimise your supply chain and meet sustainability goals, feel free to contact me.