Can AI Solve Failures in your Supply Chain?
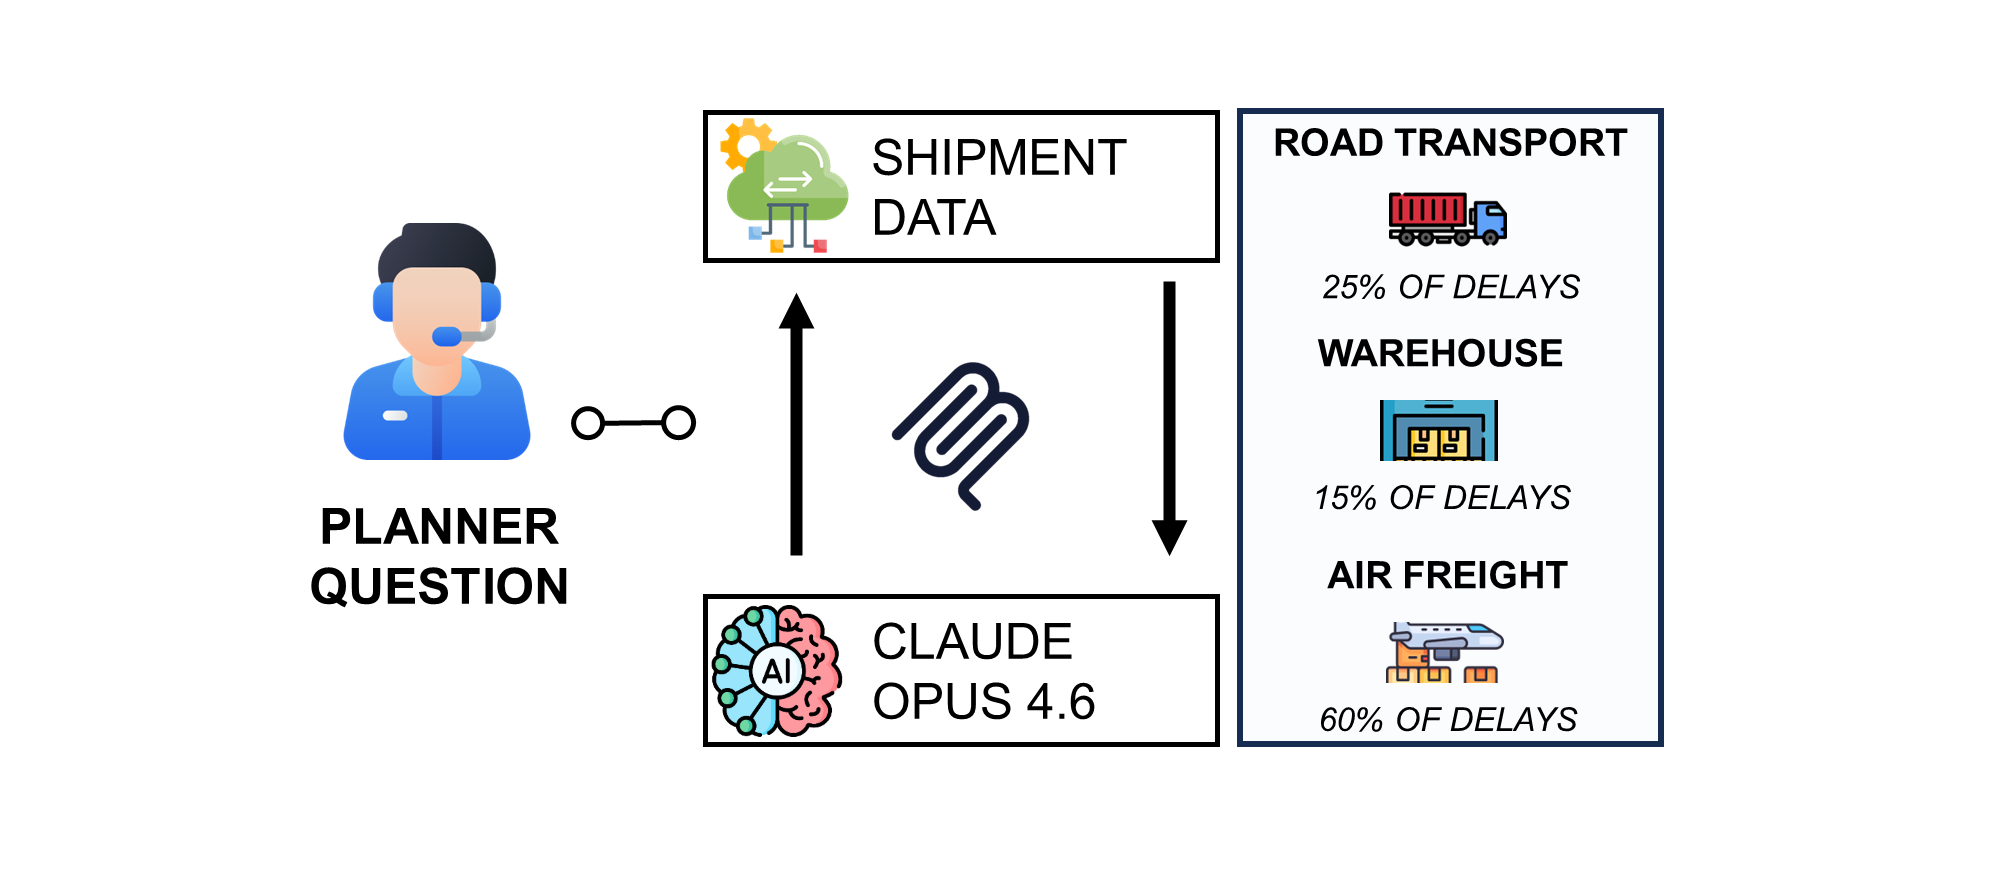
When your warehouse and transportation teams blame each other for late deliveries, who's right? We can ask an agent connected to the data settle the debate.
A retail distribution chain is a goal-oriented network of processes and stock points that delivers finished goods to stores.
Consider a luxury fashion retailer with a central distribution chain that delivers to stores worldwide (the USA, Asia-Pacific, and EMEA) from a warehouse located in France.
When the store 158 located at Nanjing West Road (Shanghai, China) needs 3 leather bags (reference AB-7478) by Friday, a distribution planner creates a replenishment order, which is sent to the warehouse for preparation.
If the shipment arrives after Friday, the store may miss sales due to insufficient inventory.
Between order creation and store delivery, our shipment will go through multiple steps involving IT, warehouse, and transportation teams.
Each step can be a source of delays.
Who is responsible if a shipment is delivered late?
If a shipment misses a cut-off time, it can be due to late order transmission, an excessively long preparation time, or a truck that left the warehouse too early.
Unfortunately, static dashboards are not always sufficient to find root causes.
Distribution planners must dig into the data to find the actual root causes of each scenario.
Therefore, I have seen distribution planning teams spend dozens of hours per week manually crunching data to answer these questions.
The most complicated task in Supply Chain Management is dealing with humans.
This is critical, as managers (transportation, warehouse, air freight) will try to shift responsibility among themselves to cover their own teams.
Because root cause analysis is the first step of continuous improvement, we must find a way to support planners.
You cannot solve an operational problem if you cannot find the root cause.
In this article, you will discover how an AI Agent can support distribution planning teams in performing these complex root cause analyses.
The idea is to use the reasoning capabilities of Claude models to identify failures in distribution chains and answer natural-language questions.
We want the tool to answer open questions with data-driven insights without hallucinations.
What is the responsability of warehouse teams in the overall performance?
These are actual interrogations that distribution planning managers must answer in day-to-day basis.
This agentic workflow uses the Claude Opus 4.6 model, connected via an MCP Server to a distribution-tracking database to answer our questions.

I will use a real-world scenario to test the ability of the agent to support teams in conducting analyses beyond what static dashboards can provide:
- Solve conflicts between teams (transportation vs. warehouse teams)
- Understand the impact of cumulative delays
- Assess the performance of each leg
Understand Logistics Performance Management
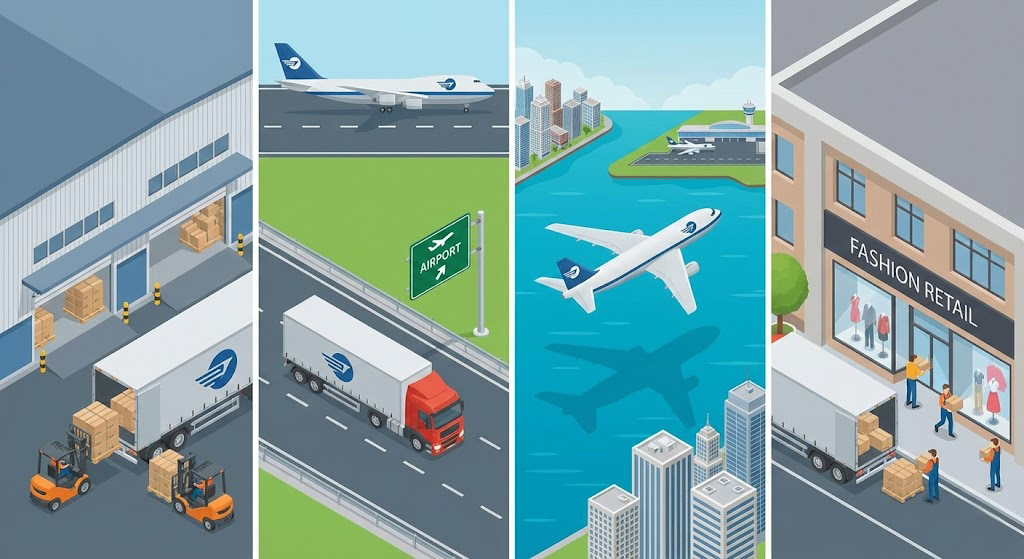
We are supporting a luxury fashion retail company with a central distribution warehouse in France, delivering to stores worldwide via road and air freight.
The International Distribution Chain of a Fashion Retailer
A team of supply planners manages store inventory and generates replenishment orders in the system.
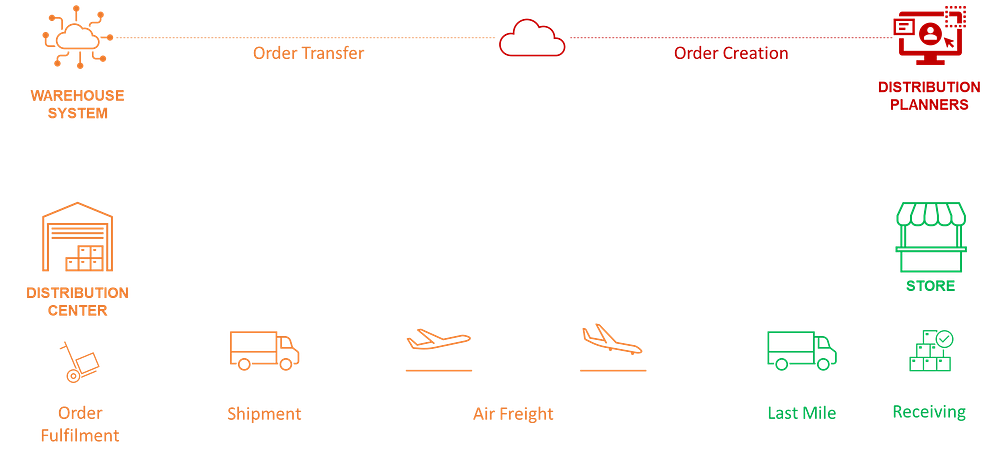
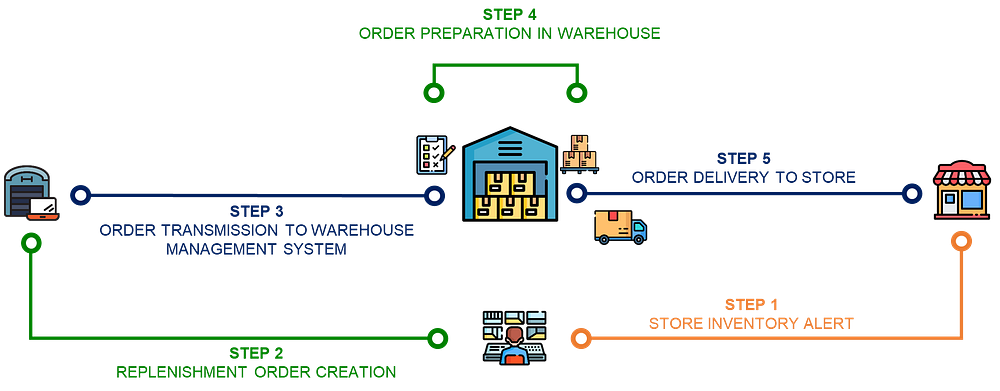
From this, a cascade of steps until store delivery
- Replenishment orders are created in the ERP
- Orders are transmitted to the Warehouse Management System (WMS)
- Orders are prepared and packed by the warehouse team
- Transportation teams organise everything from the pickup at the warehouse to the store delivery via road and air freight
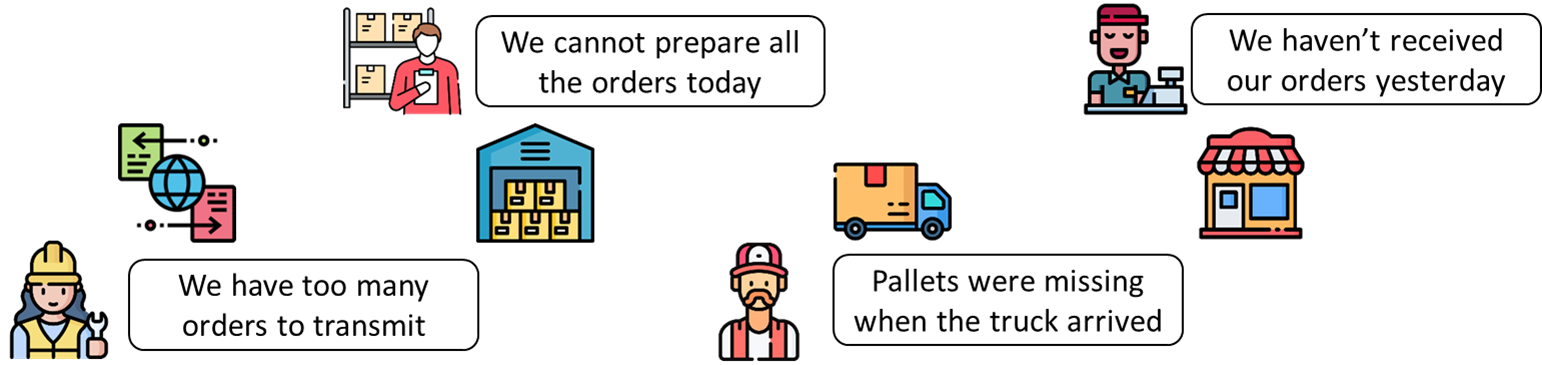
In this chain, multiple teams are involved and interdependent.
Our warehouse team can start preparation only after orders are received in the system.
Their colleagues in the transportation team expect the shipments to be ready for loading when the truck arrives at the docks.
This creates a cascade of potential delays, especially considering cut-off times.
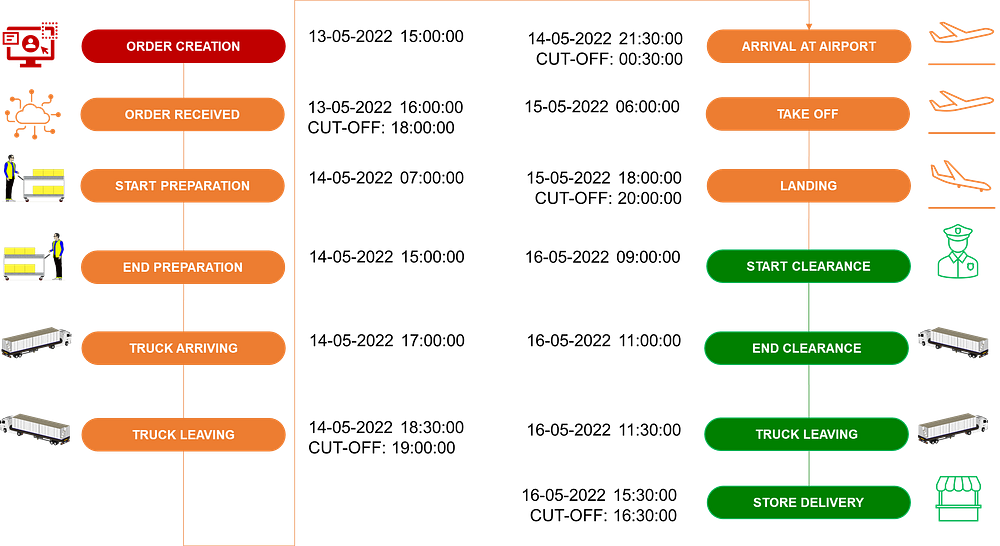
- Order Reception: if an order is received after 18:00:00, it cannot be prepared the day after (+24 hours in LT)
- Truck leaving: if an order is not packed before 19:00:00, it cannot be loaded the same day (+24 hours in LT)
- Arrival at Airport: if your shipment arrives after 00:30:00, it misses the flight (+24 hours LT)
- Landing: if your flight lands after 20:00:00, you need to wait an extra day for customs clearance (+24 hours LT)
- Store Delivery: if your trucks arrive after 16:30:00, your shipments cannot be received by store teams (+24 hours LT)
If a team experiences delays, they will affect the rest of the chain and, eventually, the lead time to deliver to the store.
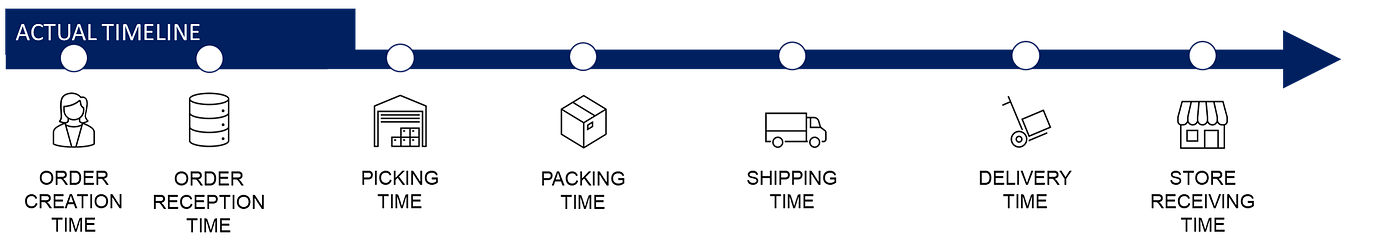
Hopefully, we are tracking each step in the delivery process with timestamps from the ERP, WMS, and TMS.
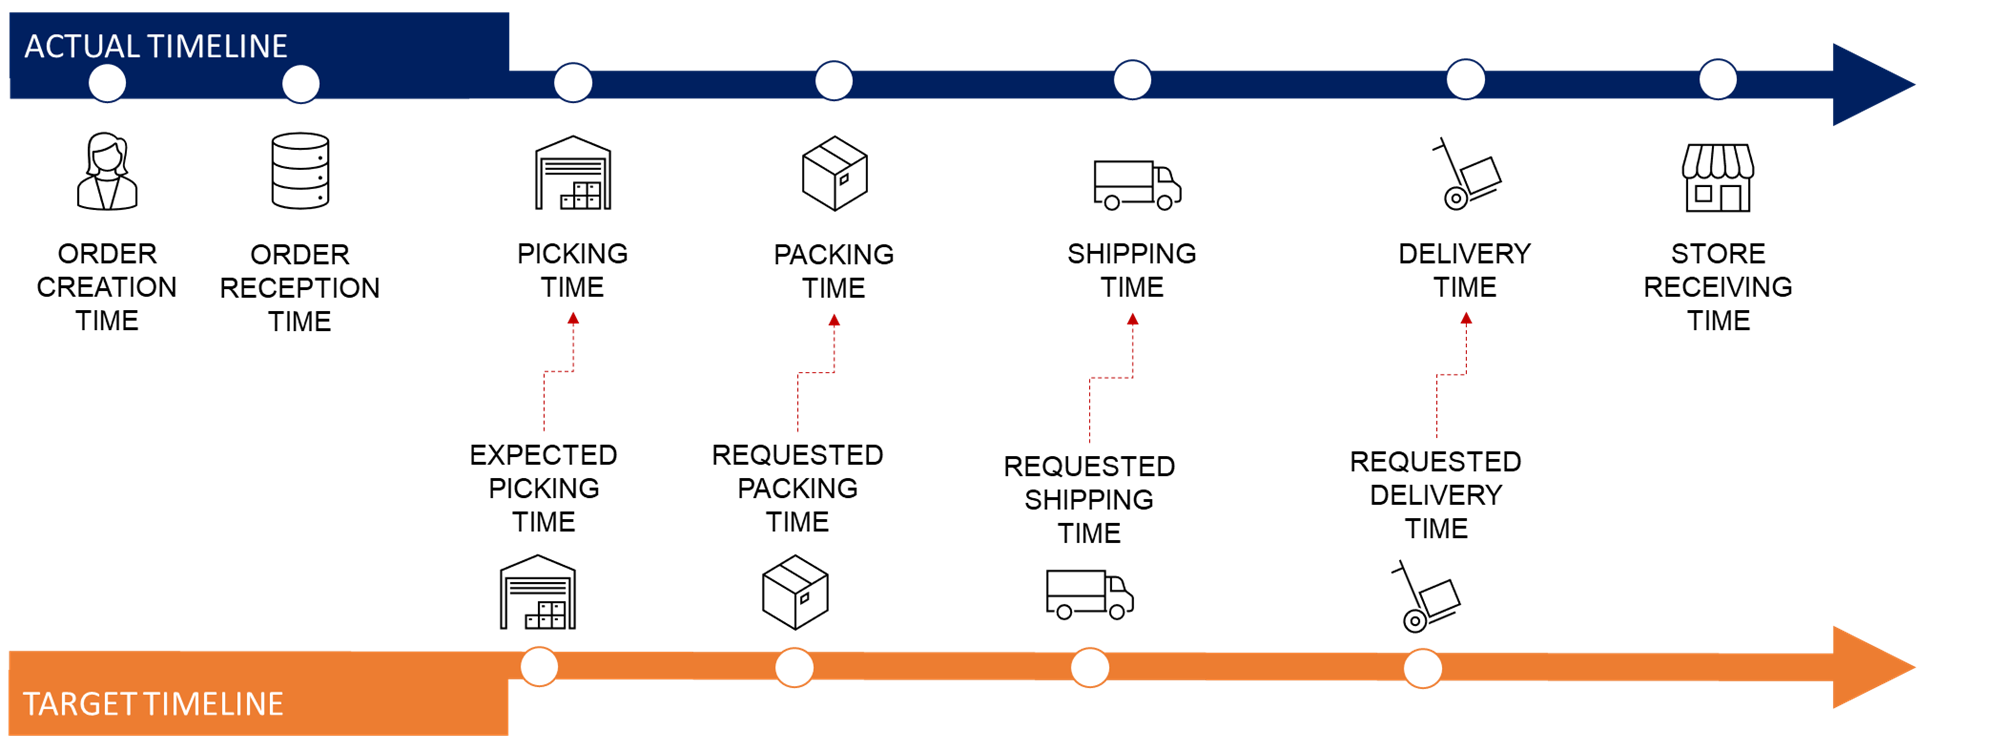
For each element of the distribution chain, we have:
- The timestamp of the completion of the task
Example: we record the timestamp when the order is received in the Warehouse Management System (WMS) and is ready for preparation. - A target timing for the task completion
For the step linked to a cut-off time, we generate a Boolean Flag to verify whether the associated cut-off has been met.
Problem Statement
Our distribution manager does not want to see his team manually crunching data to understand the root cause
This shipment has been prepared two hours late, so it was not packed on time and had to wait the next day to be shipped from the warehouse.
This is a common issue I encountered while responsible for logistics performance management at an FMCG company.
I struggled to explain to decision-makers that static dashboards alone cannot account for failures in your distribution chain.
In an experiment at my startup, LogiGreen, we used Claude Desktop, connected via an MCP server to our distribution planning tool, to support distribution planners in their root-cause analyses.
And the results are quite interesting!
How AI Agents Can Analyse Supply Chain Failures?
Let us now see what data our AI agent has on hand and how it can use it to answer our operational questions.
We put ourselves in the shoes of our distribution planning manager using the agent for the first time.
Distribution Planning
We took one month of distribution operations:
- 11,365 orders created and delivered
- From December 16th to January 16th
For the input data, we collected transactional data from the systems (ERP, WMS and TMS) to collect timestamps and create flags.
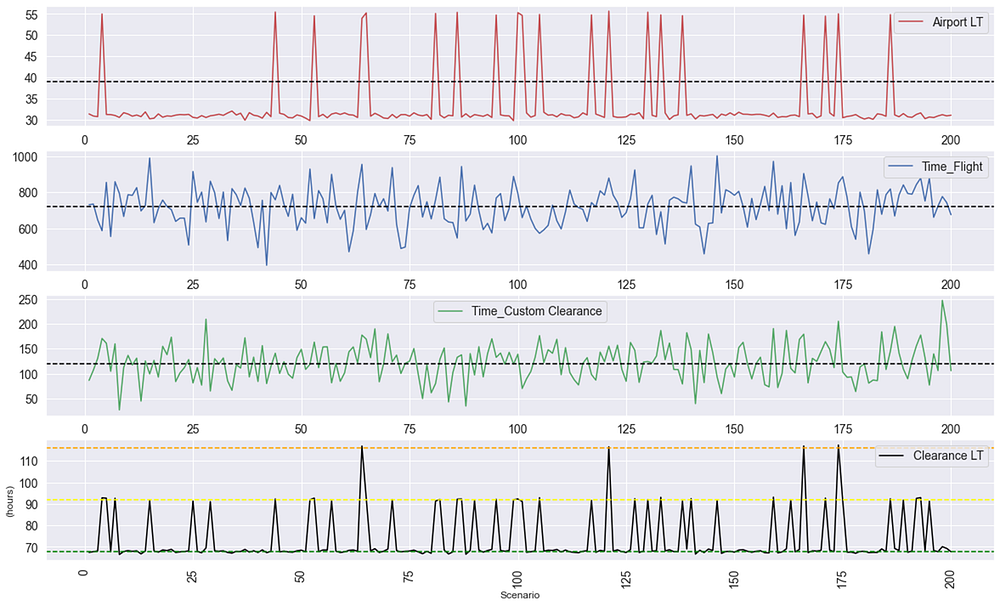
A quick Exploratory Data Analysis shows that some processes exceeded their maximum lead-time targets.
In this sample of 100 shipments, we missed the loading cutoff time for at least six orders.
This means the truck left the warehouse, en route to the airport, without these shipments.
These issues likely affected the rest of the distribution chain.
What does our agent have on hand?
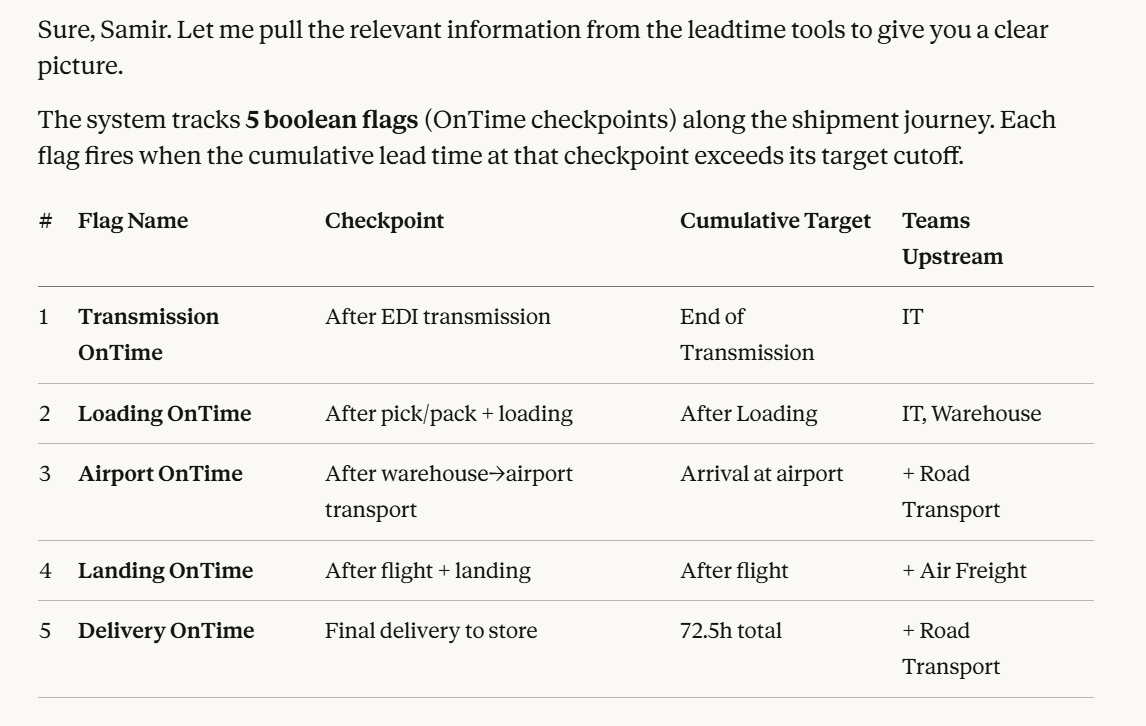
In addition to the lead times, we have our boolean flags.
These booleans measure if the shipments passed the process on time:
- Transmission: Did the order arrive at the WMS before the cut-off time?
- Loading: Are the pallets in the docks when the truck arrived for the pick-up?
- Airport: The truck arrived on time, so we wouldn't miss the flight.
- Custom Clearance: Did the flight land before customs closed?
- Delivery: We arrived at the store on time.
For slightly less than 40% of shipments, at least one boolean flag is set to False.
This indicates a distribution failure, which may be attributable to one or more teams.
Can our agent provide clear and concise explaination that can be used to implement action plans?
Let us test it with complex questions.
Test 1: A distribution planner asked Claude about the flags
To familiarise myself with the tool, I began the discussion by asking the agent what he understood from the data he had on hand.
This demonstrates that my MCP implementation, which uses docstrings to define tools, conforms to our expectations for the agent.
Test 2: Challenging its methodology
Then I asked the agent how we would use these flags to assess the distribution chain's performance.
In this first interaction, we sense the capability of Claude Opus 4.8 to understand the complexity of this exercise with the minimal information provided in the MCP implementation.
Testing the agent with real-world operational scenarios
I am now confident enough to test the agent on real-world scenarios faced by our distribution planning team.
They are responsible for the end-to-end performance of the distribution chain, which includes actors with divergent interests and priorities.
Let us see whether our agent can use timestamps and boolean flags to identify the root causes and arbitrate potential conflicts.
However, the real test is not whether the agent can read data.
The question is whether it can navigate the messy, political reality of distribution planning, where teams blame one another and dashboards may obscure the truth.
Let's start with a tricky situation!
Scenario 1: challenging the local last-mile transportation team
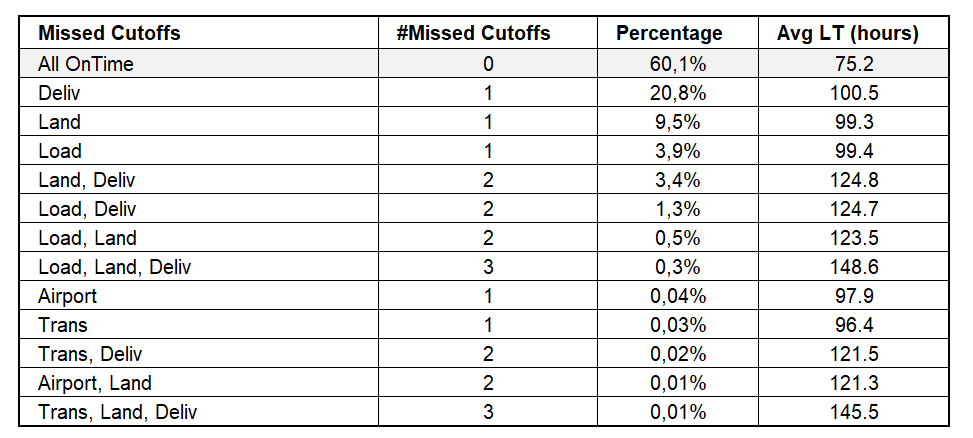
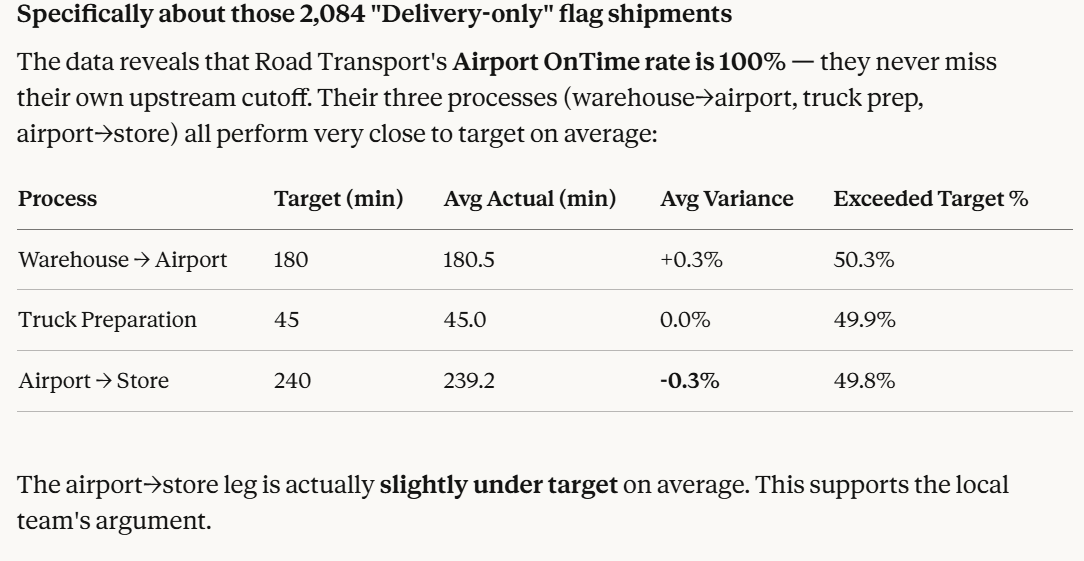
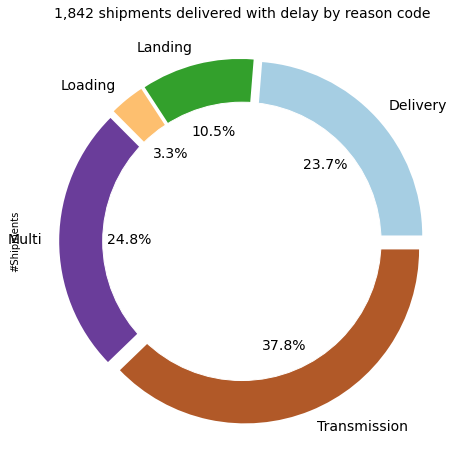
According to the data, we have 2,084 shipments that only missed the latest boolean flag Delivery OnTime.
The central team assumes this is due to the last-mile leg between the airport and the store, which is under the local team's responsibility.
For example, the central team in France is blaming local operations in China for late deliveries in Shanghai.
The local manager disagrees, pointing to delays at the airport and during customs clearance.
P.S.: This scenario is common in international supply chains with a central distribution platform (in France) and local teams overseas (in the Asia-Pacific, North America, and EMEA regions).
Let us ask Claude if it can find who is right.
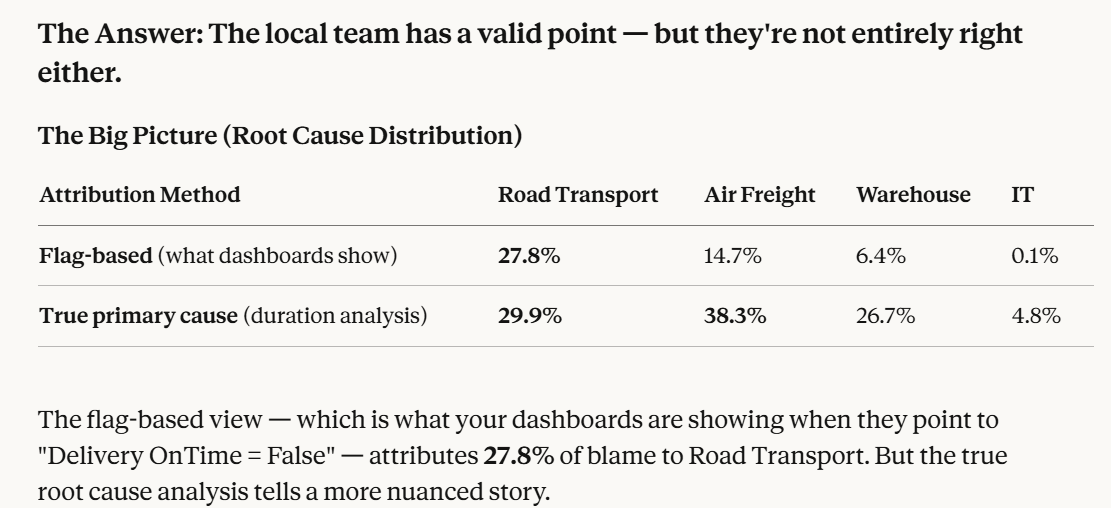
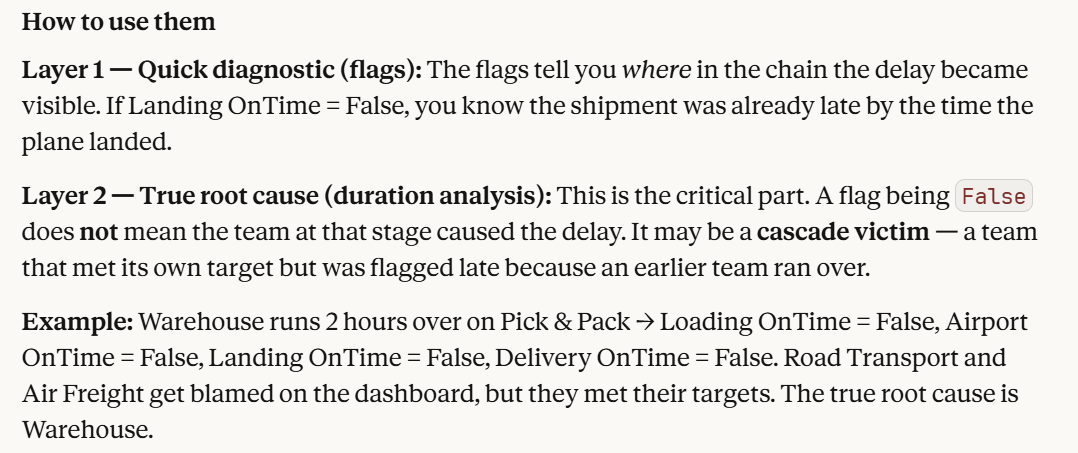
Claude Opus 4.6 here demonstrates exactly the behaviour that I expected from him.
The agent provides nuance by comparing the flag-based approach to static dashboards with an analysis of durations, thanks to the tools I equipped it.
This states two things:
- Local team's performance (i.e. Airport -> Store) is not worse than the upstream legs managed by the central team
- Shipments leave the airport on time
This indicates that the problem lies between takeoff and last-mile store delivery.
This is exactly what Claude demonstrates below:
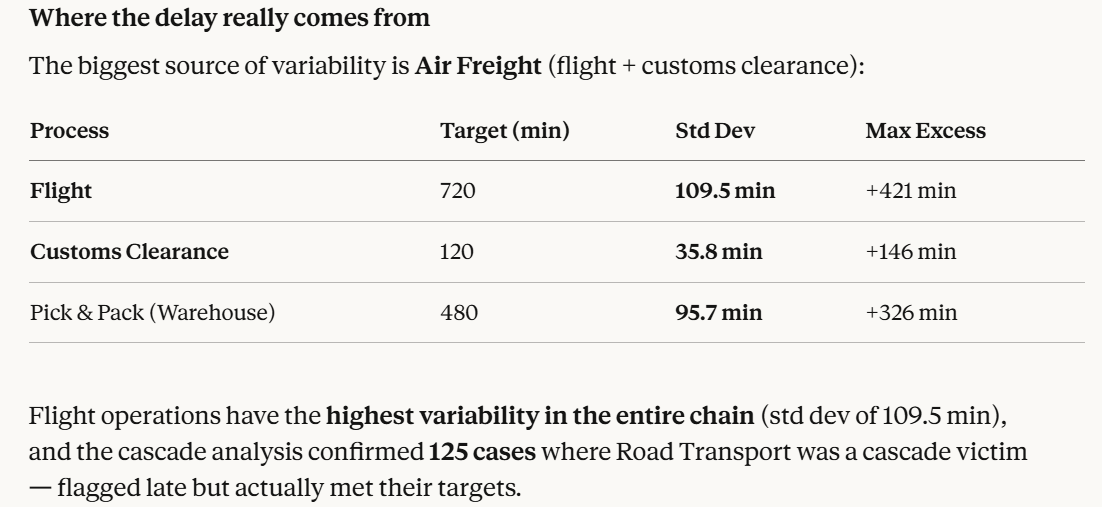
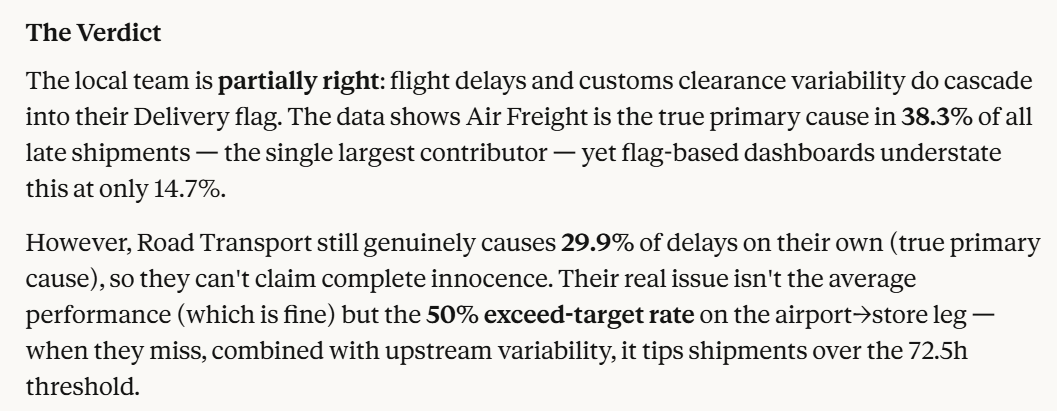
The local team is not the only cause of late deliveries here.
However, they still account for a large share of late deliveries, as explained in Claude's conclusion.
What did we learn here?
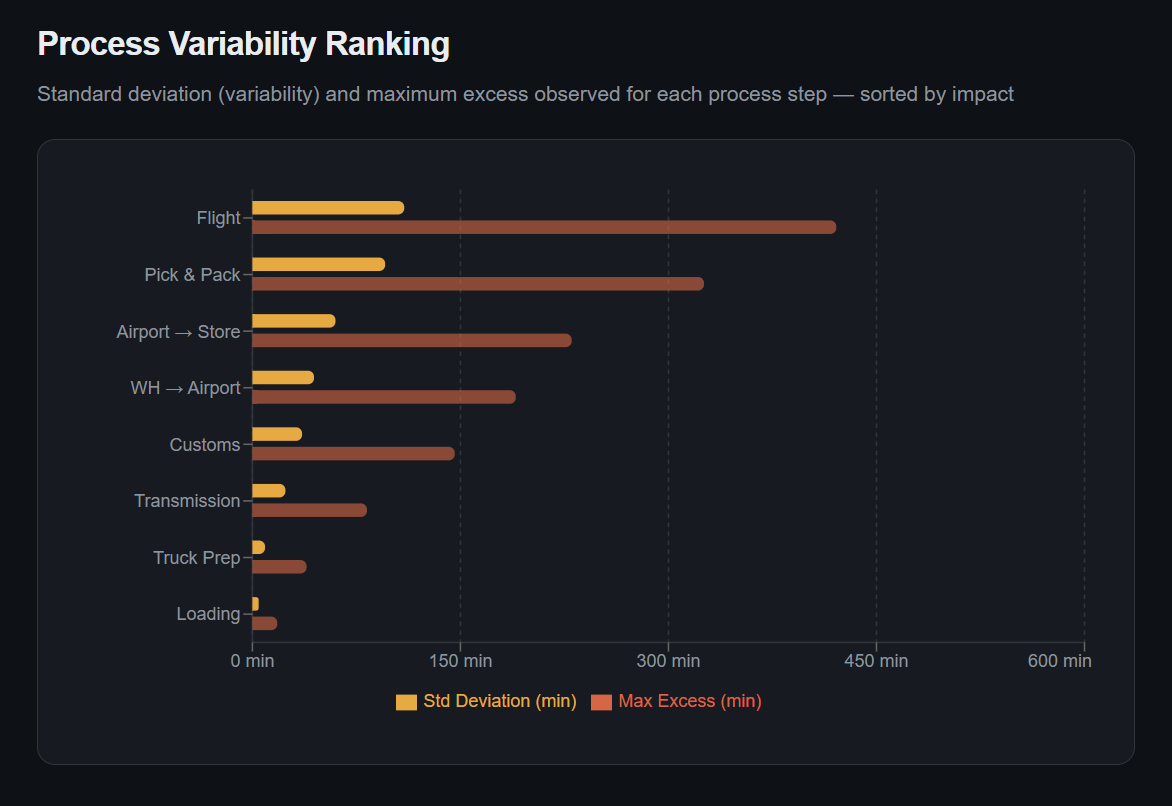
- The local team responsible for the last mile still needs to improve its operations, but it is not the only party responsible for delays.
- We need to talk to the Air Freight team about their lead time variabilty that affect the overall performance even when they don't miss cut-off times.
In Scenario 1, the agent navigated a disagreement between headquarters and a local team.
And it found that both sides had a point!
But what happens when a team's argument is based on a fundamental misunderstanding of how the KPIs work?
Scenario 2: a fight between the warehouse and the central transportation teams
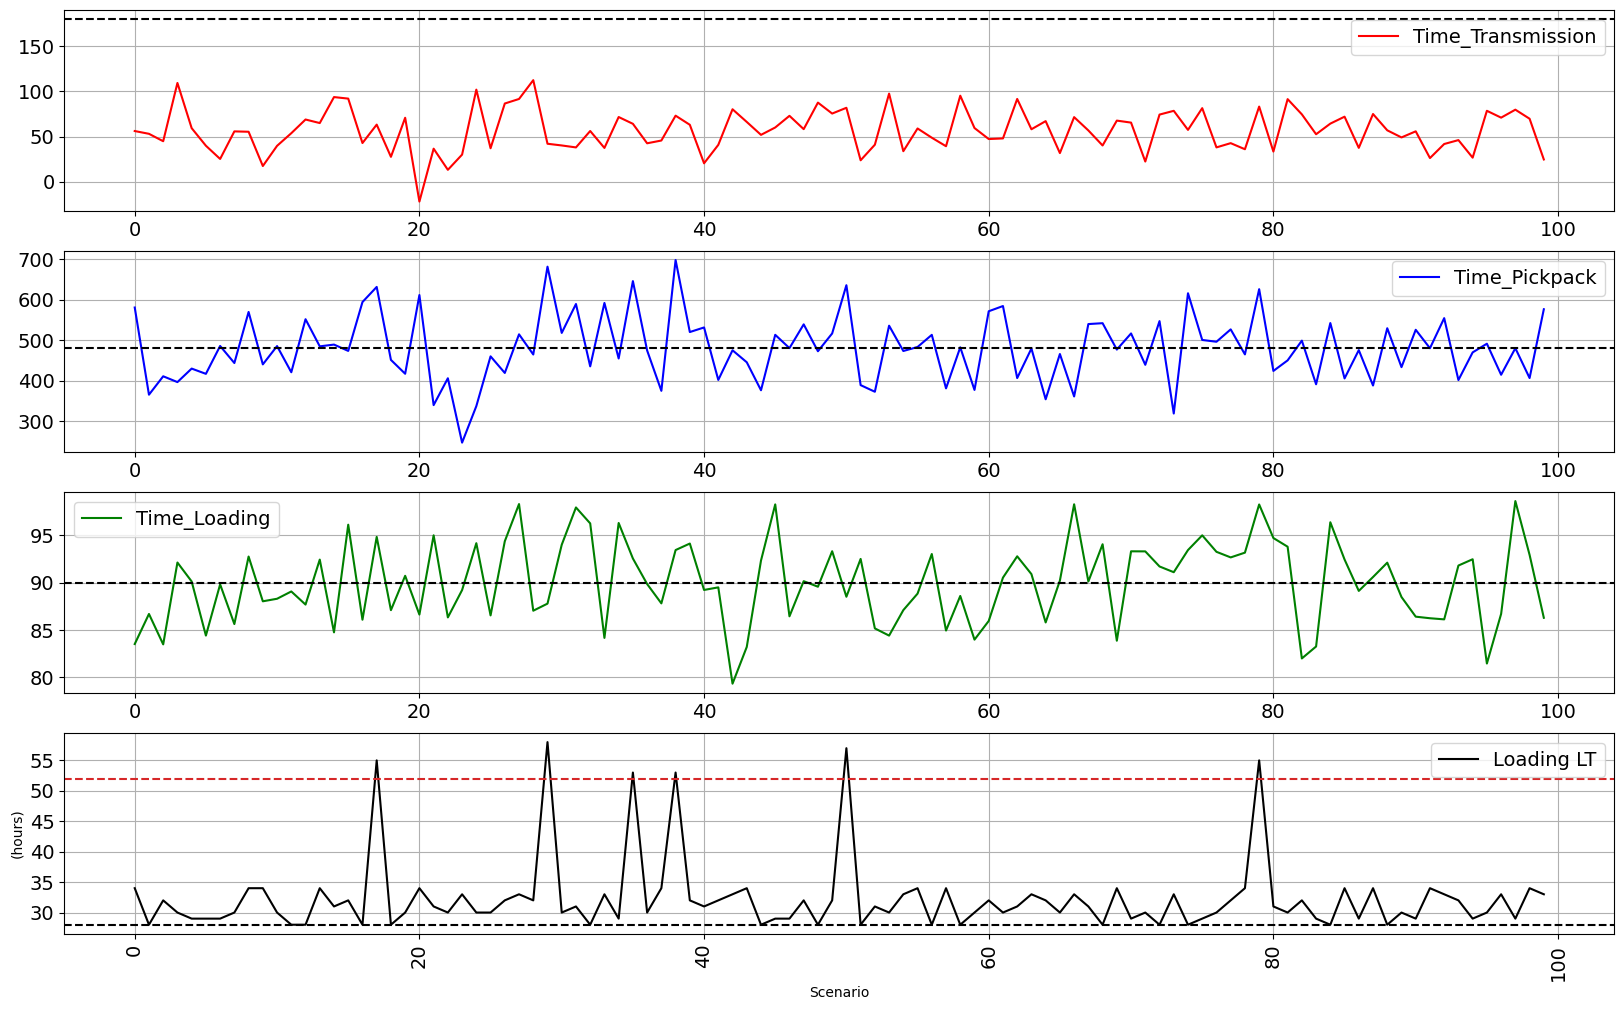
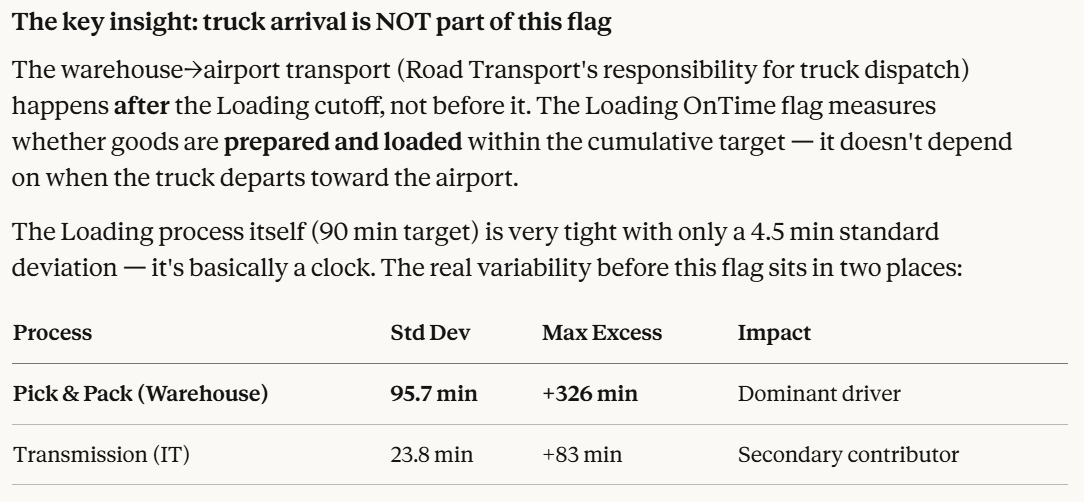
We have 386 shipments delayed, where the only flag at False is Loading OnTime.
The warehouse teams argue that these delays are due to the late arrival of trucks; i.e., orders prepared and ready on time were waiting for the trucks to load.
Is that true? No, this claim is due to a misunderstanding of the definition of this flag.
Let us see if Claude can find the right words to explain that to our distribution planner.
Because we do not have a flag indicating whether the truck arrived on time (only a cutoff to determine whether it left on time), there can be some ambiguity.
Claude can help us to clarify that.
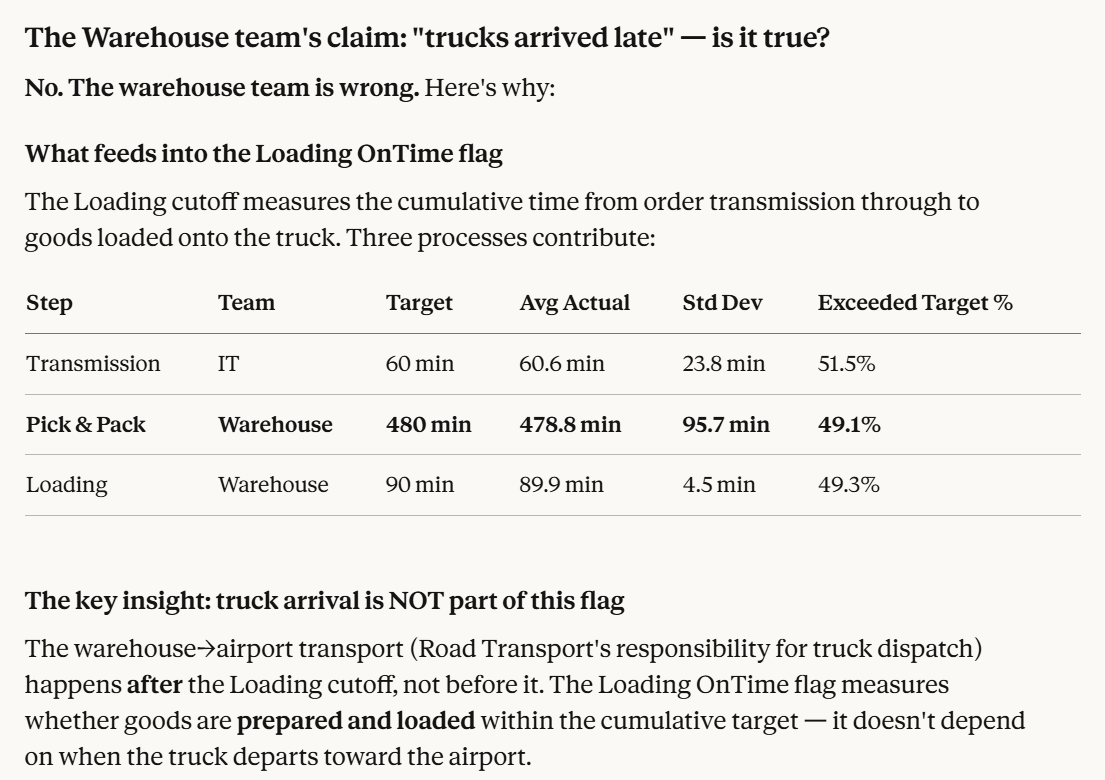
For this question, Claude exactly did what I expected:
- He used the tool to analyse the distribution of lead times per process (Transmission, Picking and Loading)
- Explained the right significance of this flag to the distribution planner in the key insight paragraph
Now that the distribution planner knows that it's wrong, Claude will provide the right elements to respond to the warehouse team.
Unlike in the first scenario, the remark (or question) arises from a misunderstanding of the KPIs and flags.
Claude did a great job providing an answer that is ready to share with the warehouse operations team.
In Scenario 1, both teams were partially right. In Scenario 2, one team was simply wrong.
In both cases, the answer was buried in the data, not visible on any static dashboard.
What can we learn from these two scenarios?
Static dashboards will never settle these debates.
They show what happened, not why, and not who's truly responsible.
Distribution planners know this. That's why they spend dozens of hours per week manually crunching data to answer questions their dashboards can't.
Instead of attempting to build a comprehensive dashboard that covers all scenarios, we can focus on a minimal set of boolean flags and calculated lead times to support custom analysis.
These analyses can then be outsourced to an agent, such as Claude Opus 4.6, which will use its knowledge of the data and reasoning skills to provide data-driven insights.
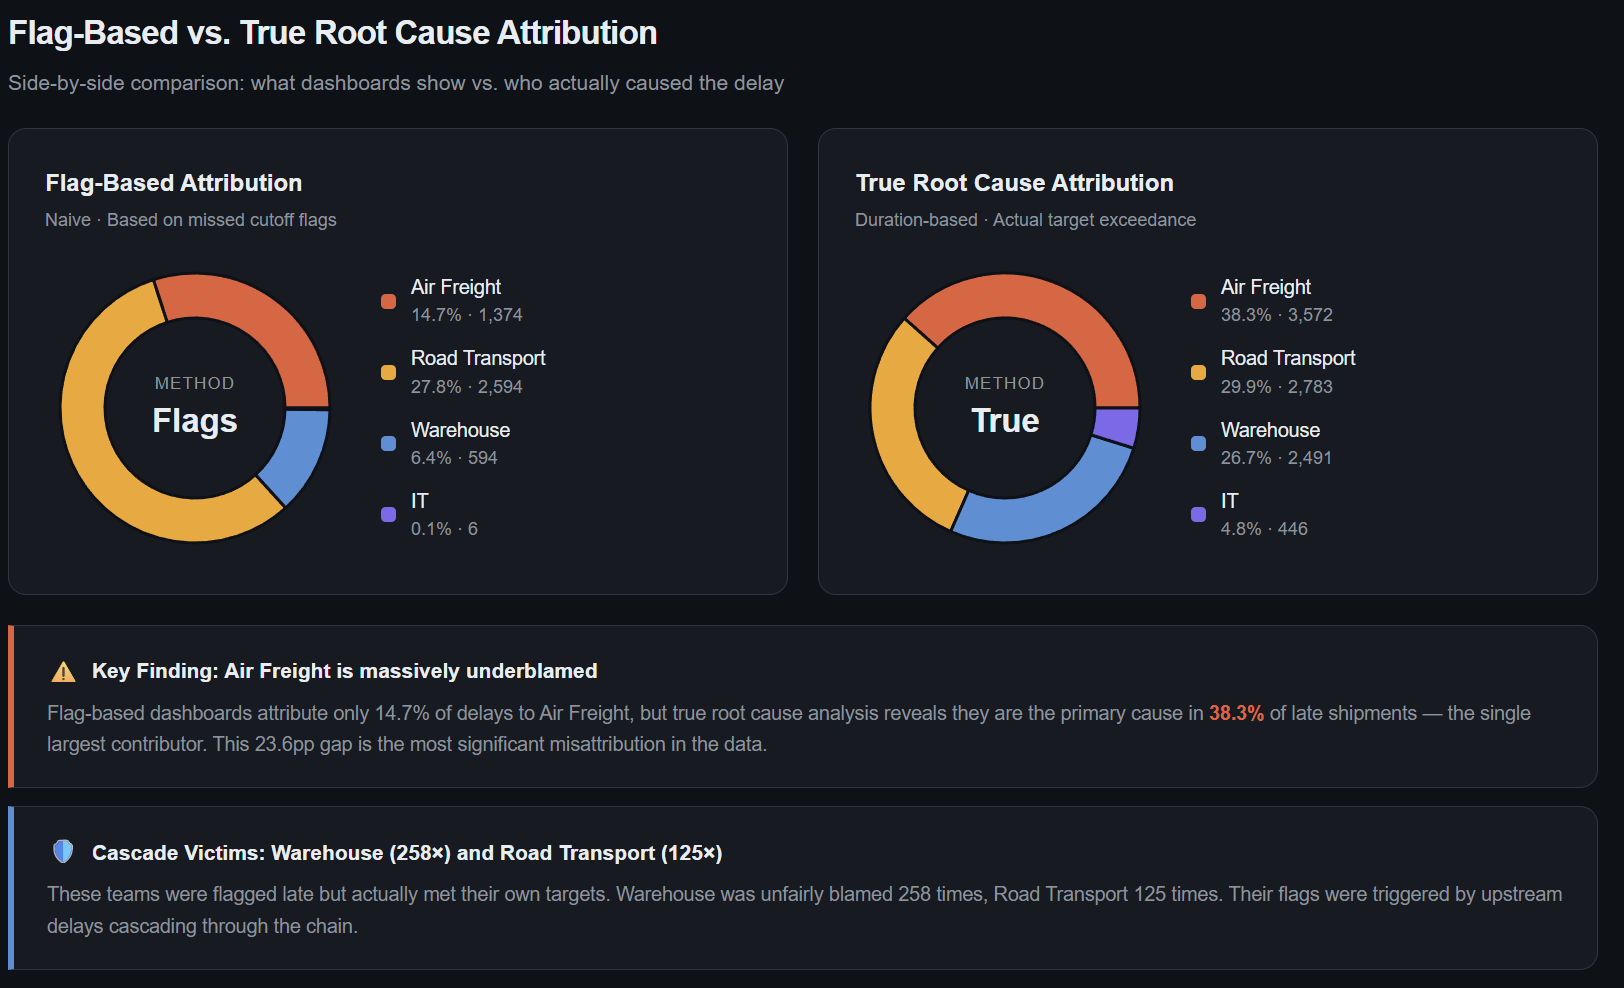
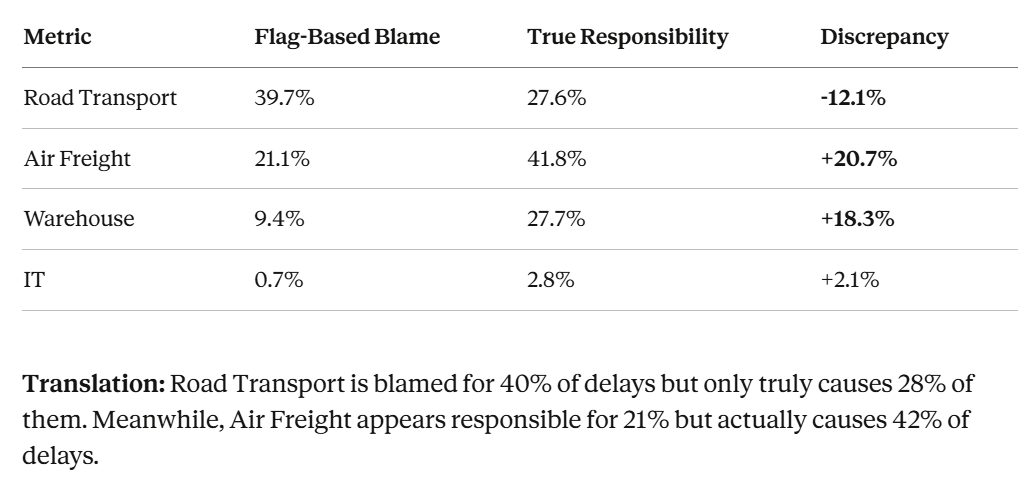
We can even use it to generate interactive visuals to convey a specific message.
In the visual above, the idea is to show that relying solely on Boolean flags may not fully reflect reality.
Flag-Based attribution was probably the source of a lot conflicts.
All of these visuals were generated by a non-technical user who communicated with the agent using natural language.
This is AI-powered analysis-as-a-service for supply chain performance management.
For more details and comments, you can find the video version of this article
Conclusion
Reflecting on this experiment, I anticipate that agentic workflows like this will replace an increasing number of reporting projects.
The advantage here is for the operational teams.
They do not have to rely on business intelligence teams to build dashboards and reports to answer their questions.
Can I export this PowerBI dashboard in Excel?
These are the common questions you may encounter when building reporting solutions for supply chain operational teams.
It is because static dashboards will never answer all the questions planners have.
With an agentic workflow like this, you empower them to build their own reporting tools.
The distribution planning use case focused on diagnosing past failures. But what about future decisions?
We applied the same agentic approach, using Claude connected via MCP to a FastAPI optimisation engine, to a very different problem: Sustainable Supply Chain Network Design.

The idea here was to support supply chain directors in their redesign of network in the context of sustainability roadmap.
Where should we produce to minimize the environmental impact of our supply chain?
Our AI agent is used to run multiple network design scenarios to estimate the impact of key decisions (e.g., factory openings or closures, international outsourcing) on production costs and environmental impacts.
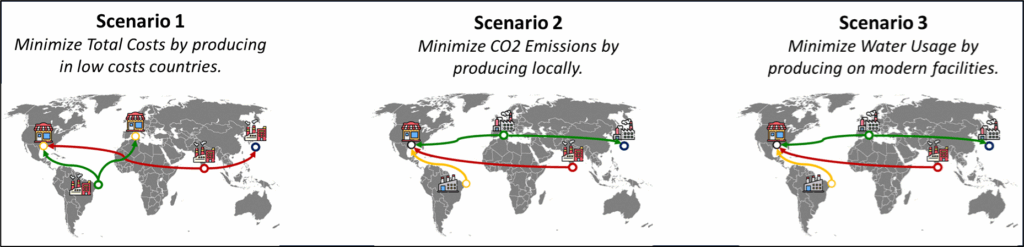
The objective is to provide decision-makers with data-driven insights.
This was the first time I felt that I could be replaced by an AI.
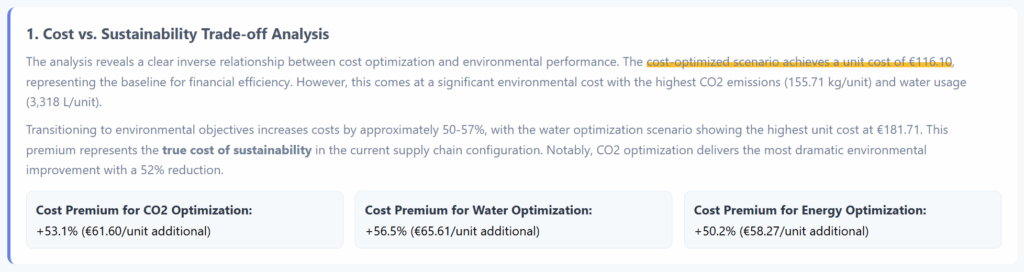
The quality of this analysis is comparable to that produced by a senior consultant after weeks of work.
Claude produced it in seconds.
More details in this tutorial,
Do you want to learn more about distribution planning?
Why Lead Time is Important?
Supply Planners use Inventory Management Rules to determine when to create replenishment orders.
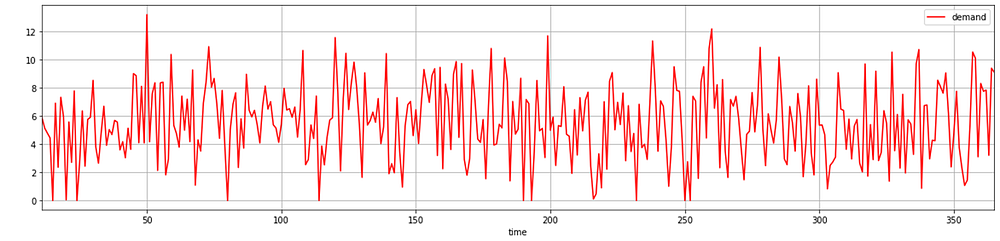
These rules account for demand variability and delivery lead time to determine the optimal reorder point that covers demand until goods are received.
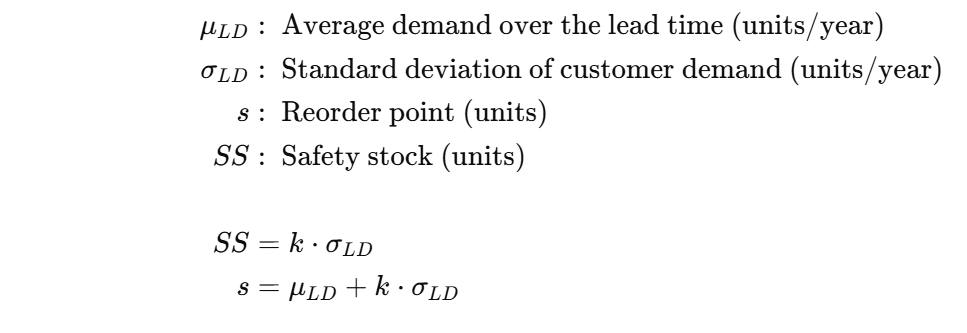
This reorder point depends on the average demand over the lead time.
But we can adapt it based on the actual performance of the distribution chain.
For more details, see the complete tutorial.
About Me
Let’s connect on LinkedIn and Twitter; I am a Supply Chain Engineer using data analytics to improve logistics operations and reduce costs.
For consulting or advice on analytics and sustainable supply chain transformation, feel free to contact me via Logigreen Consulting.