📈 ABC Analysis & Segmentation
🎓 Topic
Product segmentation refers to the activity of grouping products that have similar characteristics and serve a similar market.
It is usually related to marketing (Sales Categories) or manufacturing (Production Processes).
The objective is to understand the sales volumes distribution (fast/slow movers) and demand variability to optimise your production, storage and delivery operations to ensure the best service level by considering:
- The highest contribution to your total volume: ABC Analysis
- The most unstable demand: Demand Variability
I have designed this Streamlit App to provide a tool to Supply Chain Engineers for Product Segmentation, with a focus on retail products, of their portfolio considering the complexity of the demand and the volume's contribution of each item.
📜 Understand the Theory
💡 Get insights about your sales records
Pareto Analysis

INSIGHTS:
- How many SKUs represent 80% of your total sales?
- How many sales represent 20% of your SKUs?
For more information about the theory behind: Pareto Principle for Warehouse Layout Optimization
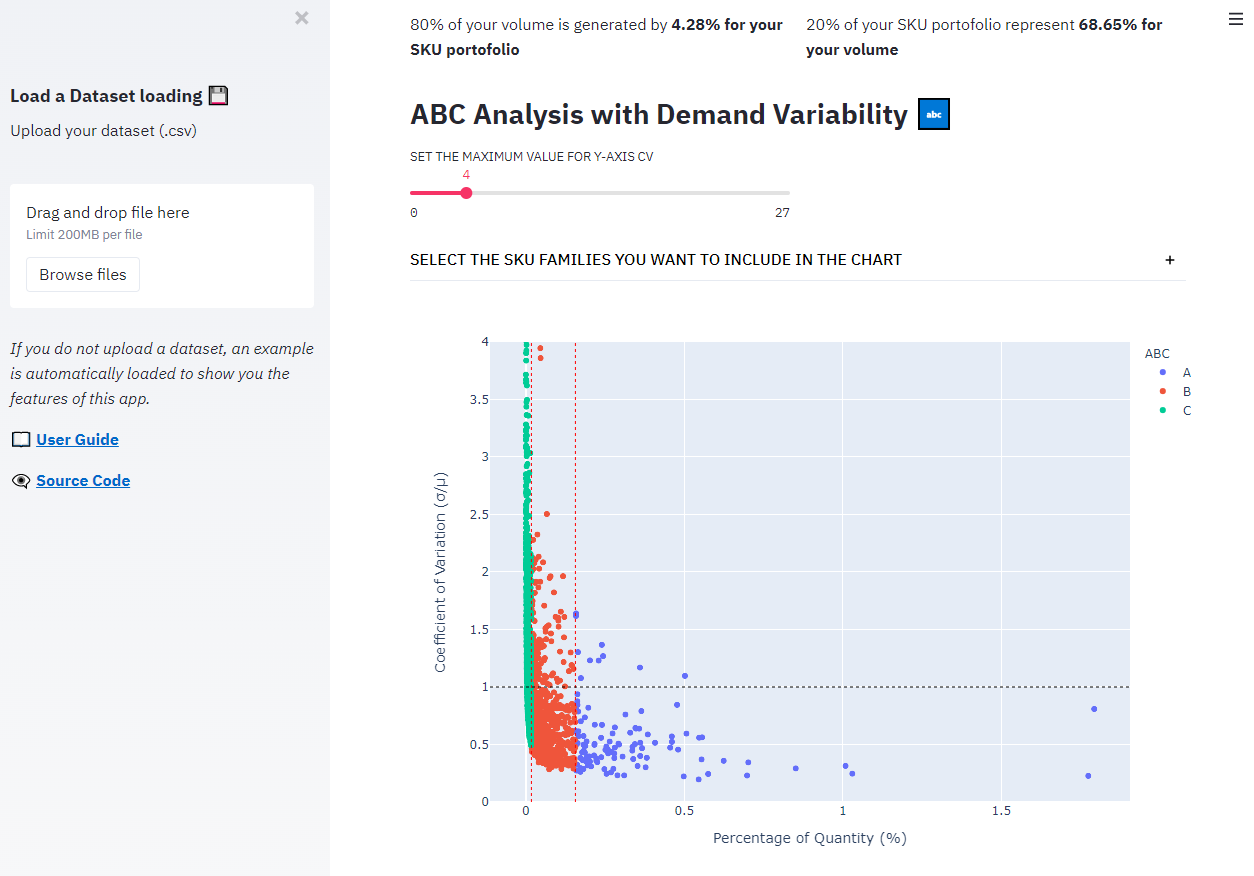
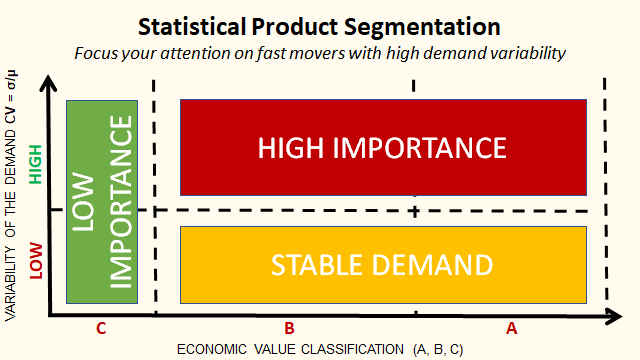
ABC Analysis with Demand Variability

QUESTIONS: WHAT IS THE PROPORTION OF?
- LOW IMPORTANCE SKUS: C references
- STABLE DEMAND SKUS: A and B SKUs with a coefficient of variation below 1
- HIGH IMPORTANCE SKUS: A and B SKUS with a high coefficient of variation
This split will impact your inventory management strategiesinto:
- A minimum effort should be put into LOW IMPORTANCE SKUS
- Automated rules with moderate attention for STABLE SKUS
- Complex replenishment rules and careful attention for HIGH IMPORTANCE SKUS

QUESTIONS:
- What is the split of SKUs by FAMILY?
- What is the split of SKUS by ABC class in each FAMILY?
Normality Test

QUESTION:
- Which SKUs have sales distributions that follow a normal distribution?
Many inventory rules and safety stock formulas apply only if your item's sales distribution is normal.
Therefore, it's better to know the % of your portfolio that can be managed easily.
📉 Access the Application
Step 0: Why should you use it?
This Streamlit web application is designed to support Supply Chain Engineers in their Inventory Management.
It will help you automate product segmentation using statistical models.
Step 1: What do you want to do?
You have two ways to use this application:
🖥️ Look at the results computed by the model using the pre-loaded dataset:
- In that case, you just need to scroll to see the visuals and the analyses OR
💾 Upload your dataset of sales records that includes columns related to:
- Item master data
For example, SKU ID, Category, Sub-Category, Store ID - Date of the sales: For example Day, Week, Month, Year
- Quantity or value: this measure will be used for the ABC analysis For example units, cartons, pallets or euros/dollars/your local currency
Step 2: Prepare the analysis
1. 💾 Upload your dataset of sales records

💡 Please make sure that your dataset format is csv with a file size lower than 200MB.
2. 📅 [Parameters] select the columns for the date (day, week, year) and the values (quantity, $)

💡 If you have several columns for the date (day, week, month) and for the values (quantity, amount) you can use only one column per category for each run of calculation.
3. 📉 [Parameters] select all the columns you want to keep in the analysis

💡 This step will basically help you to remove the columns that you do not need for your analysis to increase the speed of computation and reduce the usage of ressources.
4. 🏬 [Parameters] select all the related to product master data (SKU ID, FAMILY, CATEGORY, STORE LOCATION)

💡 In this step you will show at what granularity you want to do your analysis.
For example, it can be at:
- Item, Store level: that means the same item in two stores will represent two SKUs
- Item ID level: that means you group the sales of your item in all stores
5. 🛍️ [Parameters] select one feature you want to use for analysis by family

💡 This feature will be used to plot the repartition of (A, B, C) products by family
6. 🖱️ Click on Start Calculation? to launch the analysis

💡 This feature will be used to plot the repartition of (A, B, C) product by family