What Greenwashing Is, and How We Can Use Analytics to Detect It
Explore how data analytics can help us to detect and prevent greenwashing to promote genuine sustainability.

Greenwashing is the practice of making misleading claims about the environmental benefits of a product or a service to communicate a false image of sustainability.
This act of embellishment or hiding falsehood has become a common challenge as companies seek the attention of environmentally conscious consumers.
In this article, we will delve into greenwashing, explain its manifestations, and discuss how data analytics can be used to detect and prevent these unethical practices.
I. Understanding Greenwashing
1. What is Greenwashing?
2. Examples of Greenwashing
3. Greenwashing x Data Analytics
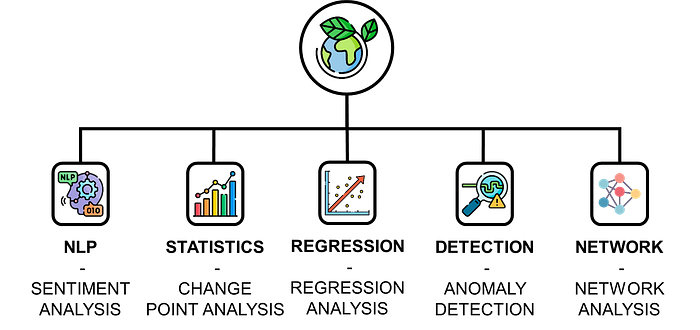
II. Data Analytics for Greenwashing Detection
1. The difficult task of detection
2. Natural Language Processing (NLP)
3. Change Point Analysis
4. Regression Analysis
5. Network Analysis
III. Conclusion
Understanding Greenwashing
I discovered Greenwashing during my first supply chain sustainability project.
As a supply chain solution manager, my task was to estimate the environmental footprint of our customers' manufacturing and logistics operations.
It was surprising to see the claims of some of their competitors, considering that they were producing and selling similar products.
How can a company selling disposable plastic products can claim to be carbon neutral?
The objective of this article is to show you how analytics tools can help you to detect this kind of false claim.
What is Greenwashing?
Greenwashing is a portmanteau word of ‘green’ and ‘whitewashing’.
This dishonest practice is used by organizations to create a false impression of environmental responsibility.
The objective is to capitalize on the growing demand for eco-friendly products from customers and investors.
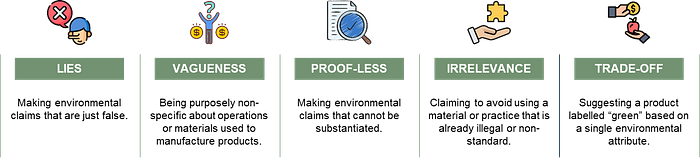
The most common forms of greenwashing include,
- Vagueness: undefined terms such as ‘eco-friendly’ or ‘all-natural’ are used without clear definitions or evidence.
For example, a company labels a product as ‘100% natural’ without disclosing that the natural materials were unsustainably sourced. - Irrelevance: highlighting an eco-friendly attribute that is either unimportant or unrelated to the product’s environmental impact.
For example, a company emphasises that its product is ‘CFC-free’ while Chlorofluorocarbons have been banned for decades. - Hidden trade-offs: promoting one environmentally friendly aspect of a product while ignoring other significant impacts
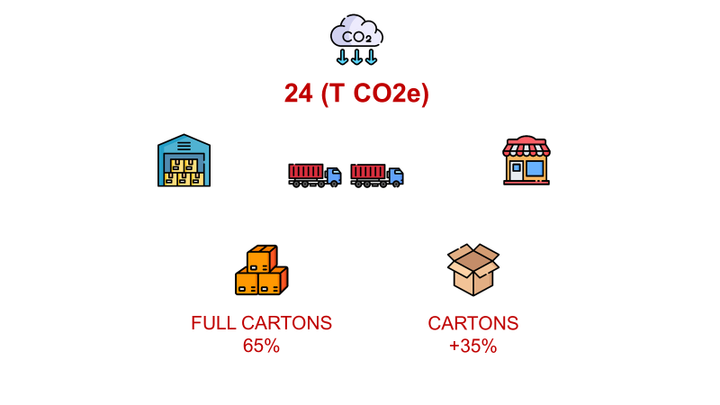
For example, a paper company promotes its use of recycled paper without mentioning energy consumption and carbon emissions for production and logistics.
When you see an advertisement for a naturally sourced, recycled t-shirt, consider:
- The amount of energy, electricity and water used to source these “natural raw materials”
- The additional CO2 emissions and waste generated by the recycling process
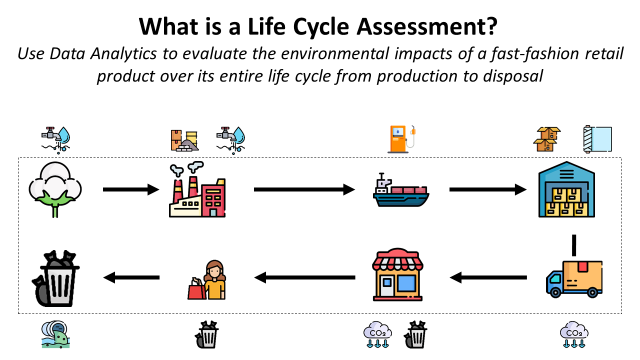
With life cycle assessment (LCA), you have a data-driven method to evaluate these impacts, considering the entire life cycle of the product and avoid this kind of trap.
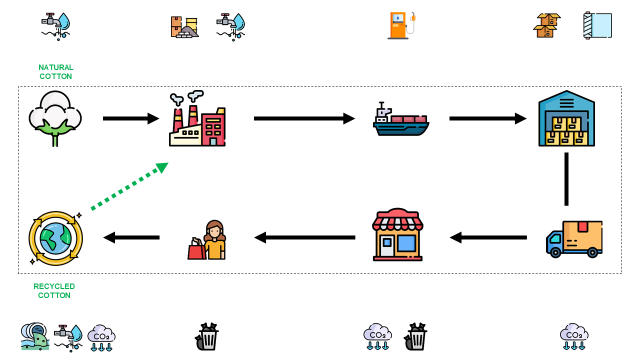
The idea is to estimate the environmental impact of sourcing, producing and using a specific product or service.
This requires collecting and processing data from multiple sources using Business Intelligence tools.
💡 For more details,
Examples of Greenwashing
Several high-profile cases have brought greenwashing into the spotlight.
- A large car manufacturer was found guilty of using software in their vehicles to cheat emissions tests on cars marketed as “environmentally friendly”.
- A famous water company advertised its product as “carbon-negative” without acknowledging the environmental cost of transporting bottled water from Fiji to global markets.
The second one can be easily debunked using basic supply chain analytics and publicly available data.
How?
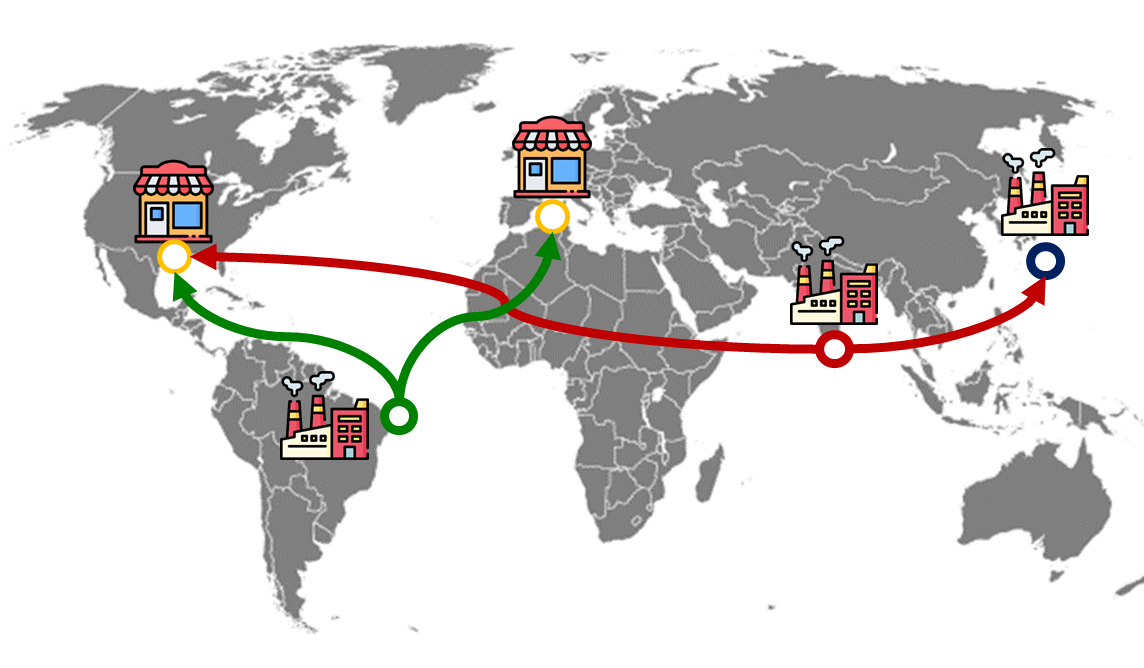
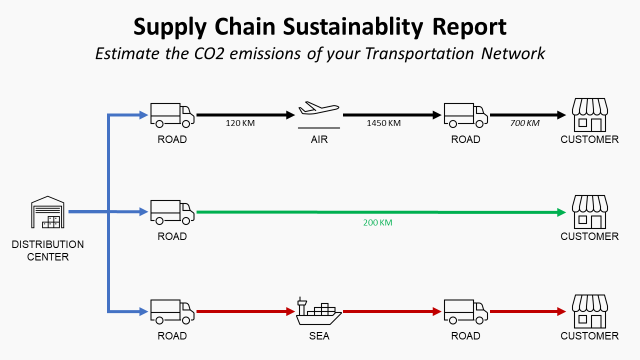
- Estimate sales volumes by market using the financial reports
- Calculate the emissions per bottle using the GHG protocol for the transportation from manufacturing plants to markets
- Compare the results with the figures published by the company
💡 For more details,
Greenwashing x Data Analytics
Understanding the various forms and implications of greenwashing is crucial to implementing proactive measures to tackle this problem.
While regulatory bodies and conscious consumers play a significant role in this fight, data analytics can be an additional boost to automate fraud detection.
The idea is to use…
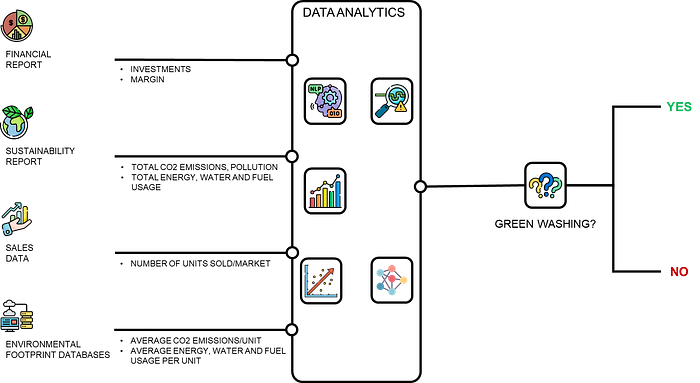
- Publicly available data: financial and sustainability reports, footprint databases, social media
- Advanced analytics models, including NLP, forecasting or statistical models to detect fraud
In the following sections, we will explore how to use these tools to promote a more transparent and sustainable corporate world.
Data Analytics for Greenwashing Detection
The difficult task of detection
Identifying greenwashing is a complex task, given its varied manifestations and the overwhelming volume of information available.
Data analytics can provide powerful tools for filtering large datasets to identify patterns and anomalies and extract valuable insights.
In the following sections, we will explore how to use these solutions using an example of potential fraud.
Natural Language Processing (NLP)
A primary application of NLP in greenwashing detection is sentiment analysis.
Let us consider the example of major oil companies.
They regularly publish sustainability reports and press releases highlighting their commitment to environmental protection.
The data at our disposal consists of these PDF documents available on their websites.
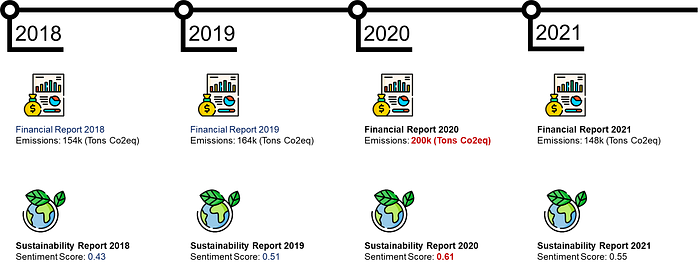
An NLP sentiment analysis model can evaluate the sentiment behind these statements.
💡 How to detect greenwashing?
If the statements convey overly positive sentiments that do not reflect the actual environmental performance metrics, it could be a sign of greenwashing.
For instance, in the example above
- Total CO2 emissions exploded in 2020: +26k Tons of CO2eq
- However, the sentiment score kept increasing
There is a contradiction between the actual sustainability performance and the narrative sold in the report.
Change Point Analysis
Change-point analysis identifies points in a data sequence where the statistical properties change.
For instance, a major automobile manufacturer reports a sudden decrease in its CO2 emissions.
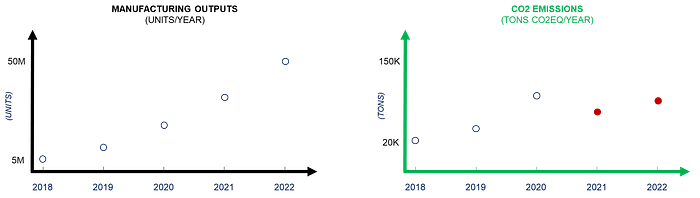
The available data would include a time series of the company’s reported emissions and manufacturing outputs.
💡 How to detect greenwashing?
Change point analysis can detect if these reductions correspond to
- Legitimate and continuous sustainability efforts
- Temporary this may be suggesting greenwashing
I have used a CO2 emissions dummy data set and applied the Python library ruptures:
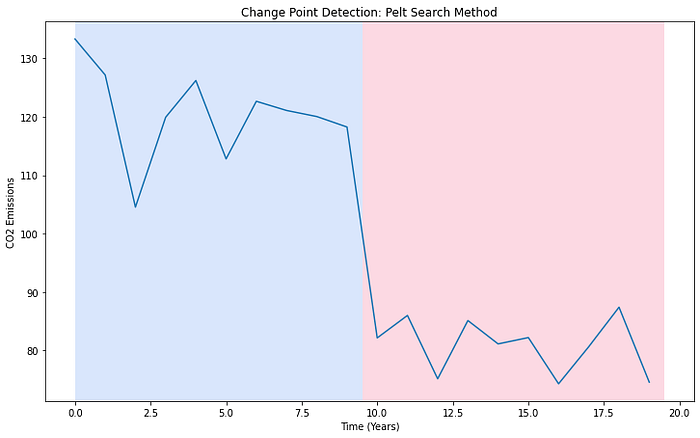
It has detected a major change in the 9th year, which we should investigate.
This is an initial assessment; the reduction may be due to the impact of actual initiatives.
And you can verify it in the detailed initiatives shared in the sustainability report.
💡 Check the code to get this visual,
- Change Point Analysis, GitHub
Regression Analysis
Regression analysis can help establish relationships between different variables.
For instance, a major fashion brand reports sustainability expenditures (in Euros) and waste production levels (in Tons).
💡 How to detect greenwashing?
A regression model can determine whether increases in sustainability expenditure are associated with proportionate decreases in waste production.
If not, this could be an indication of greenwashing, and this requires advanced investigations
- This is not an univariate problem, as waste can be (product design, raw materials, …)
- A product-centred approach (LCA) is preferred to track how expenditures are affecting the environmental footprint along the supply chain
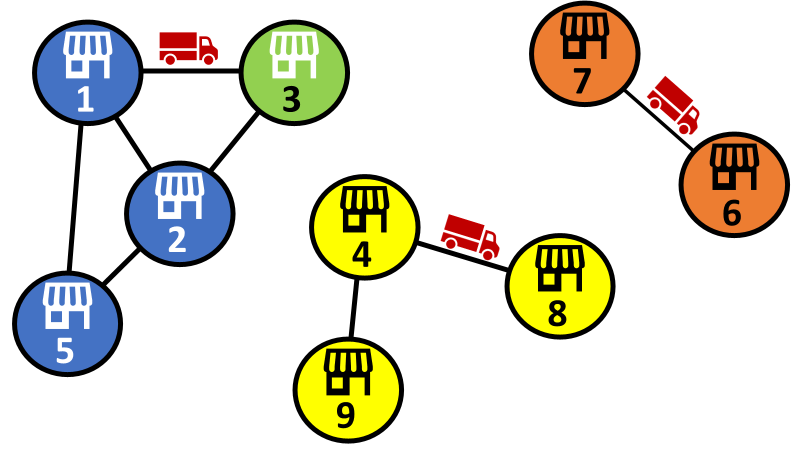
Network Analysis
Network analysis helps to understand relationships between entities in a network.
A company in the electronics sector might claim that its products are sourced from sustainable and ethical suppliers.
💡 How to detect greenwashing?
The data here would include the company’s supplier network and third-party reports on supplier practices.
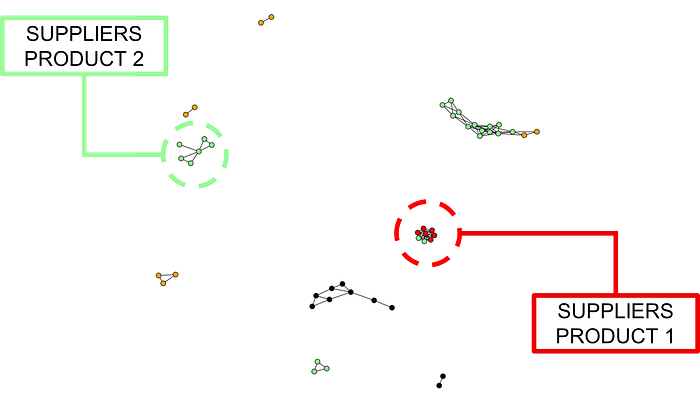
Using network analysis, we can scrutinize the sustainability KPIs (ESG scores for instance) of the suppliers and the connections between them.
If nodes in the network engage in questionable sustainability practices, this could indicate potential greenwashing.
💡 For more details on how to implement a network graph with Python:
This gives you an initial understanding of how to use advanced analytics to automatically detect greenwashing and fraud using publicly available data.
Conclusion
The End of Greenwashing?
As we look towards future ESG regulations, the connection between greenwashing and data analytics is set to take a significant turn.
As customer and investor awareness of sustainability grows, corporations will find it risky to hide behind vague or misleading sustainability claims.
Therefore, greenwashing will face significant challenges in an increasingly data-driven world.
Data Analytics for Footprint Reduction
Instead of building on false claims, companies can use advanced analytics to design and implement initiatives that deliver concrete results.
For instance, Sustainable Supply Chain Optimisation is a data-driven approach cost reductions and footprint reduction.
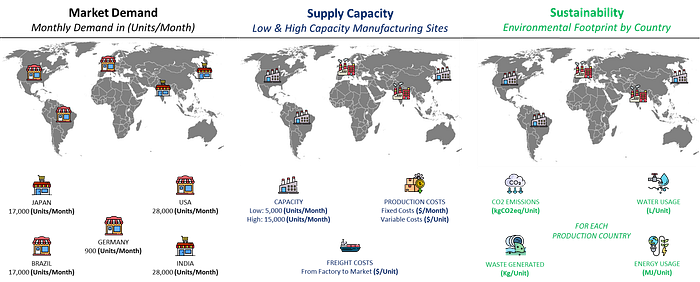
Let’s imagine that your company is producing and selling items worldwide.
Where to locate your factories and distribution centers?
This is an optimization model considering,
- Demand for each market location in (Units/Month)
- All the potential manufacturing sites with their production costs, environmental footprint (CO2, resources), ESG scores
- Constraints on environmental footprint per unit, social and governance scores
What is the most sustainable (and economically viable ) combination?
- To minimize costs if you want to focus on profitability
Can we respect environmental targets? - To minimize CO2 emissions if you want to focus on sustainability
Can we keep our profitability level?
💡 For more information,

About Me
Let’s connect on LinkedIn and Twitter. I am a Supply Chain Engineer using data analytics to improve logistics operations and reduce costs.
If you’re looking for tailored consulting solutions to optimise your supply chain and meet sustainability goals, feel free to contact me.