Optimize E-Commerce Last-Mile Delivery with Python
Organize your routes to deliver parcels with a minimum number of drivers using optimization models with python
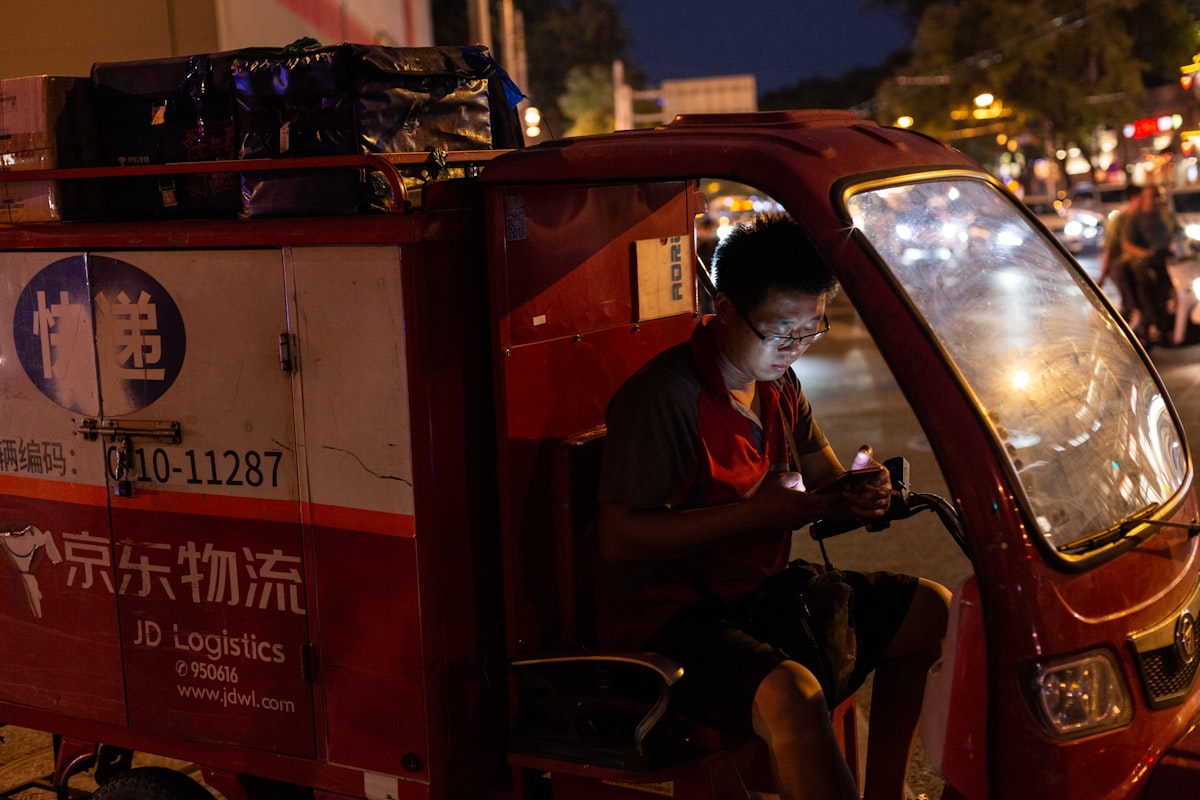
If you travel to first and second-tier cities of China, you will find on the street many delivery drivers (Chinese: 快递).
They take the parcels from small warehouses called customer service centres (Chinese:客户服务中心) located in each neighbourhood and deliver them to the final customers.
These centres are key elements of the Logistics Network of the major courier companies in China.
They increase geographic coverage for last-mile delivery while delivering the best service level and lead time in the market.
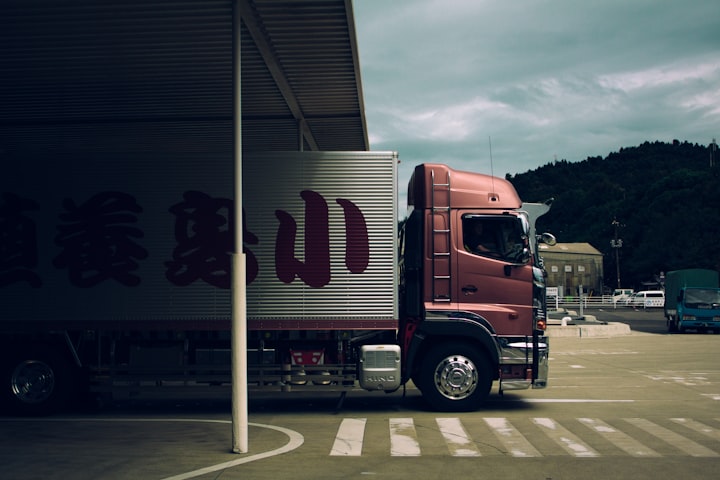
Before arriving at your door, your parcel will be picked up from the vendor’s warehouse, transit through several regional distribution centres and will finally arrive at the service centre of your neighbourhood.
When your parcel arrives at the centre, you will receive a notification on your phone that a courier will deliver your parcel during the day.
This article presents a solution to optimise last-mile delivery from these centres, reducing costs and ensuring a uniform workload for each driver.
💌 New articles straight to your inbox for free: Newsletter
Scenario
Problem Statement
You are a manager in a local service centre with
- 4 drivers in your team
- 15 parcel capacity per vehicle
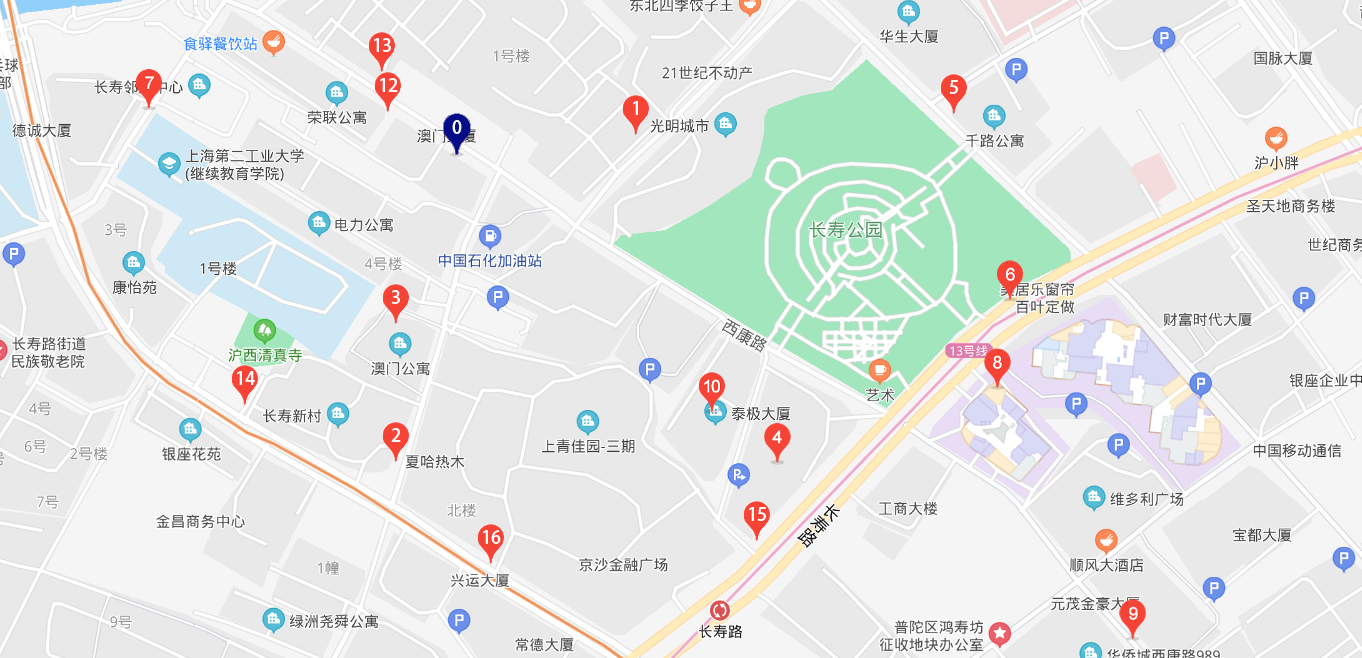
- 16 destinations to cover in the neighbourhood named Dj with j in [1, 16]
- D0 is the centre
- 1 route per driver
Distance Matrix
To build your model, you need to provide a distance matrix M as input, defined by
- M(i, j) with i, j in [0, 16]
- M(i, j) = distance between Di and Dj
This distance matrix will be loaded from an Excel file.
Demand: number of parcels to deliver to each location
We will use a Python list here with the first value at zero (because you don’t deliver anything in the centre)
- Demand = [0, 1, 1, 2, 4, 2, 4, 8, 8, 1, 2, 1, 2, 4, 4, 8, 8]
Objective
- Deliver all parcels with a minimum number of drivers
- Optimise the routing to minimise the distance covered per route
0 Parcels(0) -> 4 Parcels(4) -> 3 Parcels(6) -> 1 Parcels(7) ->
7 Parcels(15) -> 0 Parcels(15)
Distance of the route: 1552 (m)
Parcels Delivered: 15 (parcels)
Route for Driver 1
0 Parcels(0) -> 14 Parcels(4) -> 16 Parcels(12) -> 10 Parcels(14) -> 9 Parcels(15) -> 0 Parcels(15)
Distance of the route: 1552 (m)
Parcels Delivered: 15 (parcels)
Route for Driver 2
0 Parcels(0) -> 12 Parcels(2) -> 11 Parcels(3) -> 15 Parcels(11) -> 13 Parcels(15) -> 0 Parcels(15)
Distance of the route: 1552 (m)
Parcels Delivered: 15 (parcels)
Route for Driver 3
0 Parcels(0) -> 8 Parcels(8) -> 2 Parcels(9) -> 6 Parcels(13) -> 5 Parcels(15) -> 0 Parcels(15)
Distance of the route: 1552 (m)
Parcels Delivered: 15 (parcels)
Total distance of all routes: 6,208 (m)
Parcels Delivered: 60/60
Based on these results, you can assign each of your four drivers a route that has the same total distance
- 100% of parcels are delivered with a minimum distance covered
- Drivers’ vehicles are loaded to their maximum capacity (15/15)
Using this model helps ensure that your drivers, who are paid a fixed amount per delivery, are fairly assigned to routes.
You will avoid driver complaints about longer routes than their colleagues.
Moreover, you are using your resources at their maximum capacity.
Build your Model
Capacitated vehicle routing problem (CVRP) with Google OR-Tools
OR-Tools is an open-source collection of tools from Google for combinatorial optimisation.
The objective is to find the best solution out of a very large set of possible solutions.
Let us use this library to find the optimal routes.
Import Distance Matrix and Init parameters
Create functions to calculate distances and order quantities
Build your model with constraints
Show the solution
Conclusion
This model can help the centre manager to
- Optimise his fleet with full utilisation of his drivers and vehicles
- Ensure that the workload is equally distributed among all drivers
This is an example where optimisation tools can support transportation operations.
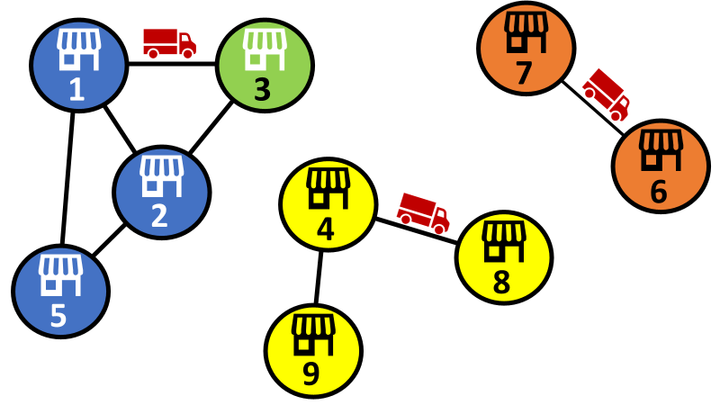
In another case study, we use Graph Theory to optimise truck routing for store deliveries.
This visual representation of the routing can help you to spot levers of optimisation while understanding loss of performance.
If you want to add this skill to your toolbox of transportation analysts, have a look at this video
Any question?
Feel free to share your version and commit to the GitHub repository.
About Me
Let’s connect on LinkedIn and Twitter. I am a Supply Chain Engineer who is using data analytics to improve logistics operations and reduce costs.
If you’re looking for tailored consulting solutions to optimise your supply chain and meet sustainability goals, feel free to contact me.