Machine Learning for Store Delivery Scheduling
Design Replenishment Strategies to Optimize Inventory and Reduce Number of Deliveries from your Warehouse

Design Replenishment Strategies to Optimize Inventory and Reduce Number of Deliveries from your Warehouse.
💌 New articles straight to your inbox for free: Newsletter
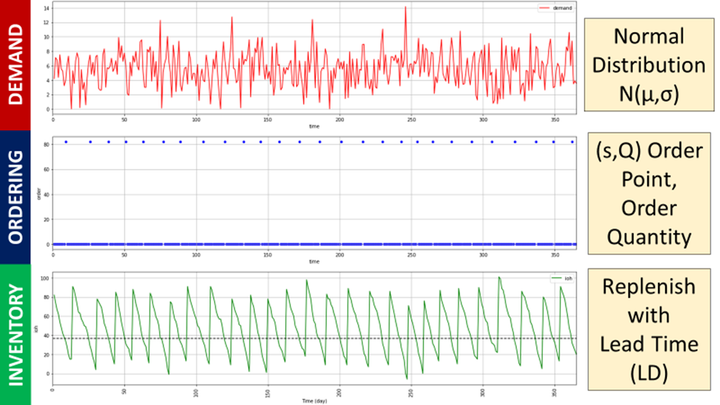
Replenishment Strategy & Sequence
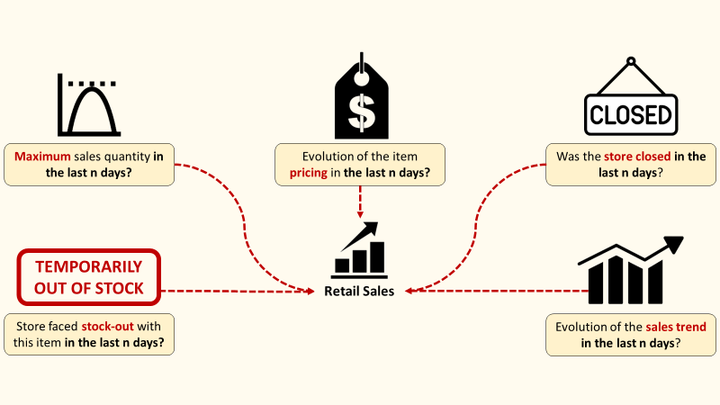
Demand Planning & Delivery Schedule
Scope
- Transactions from 2013–01–01 to 2017–12–31
- 913,000 sales transactions
- 50 unique SKU
- 10 Stores
- 4 days or replenishment per week: Monday, Wednesday, Friday, Sunday
- 24 hours lead-time between order creation and delivery from the warehouse
- Store opening from 10:00 am to 08:00 pm
- Delivery from the warehouse at 09:00 pm
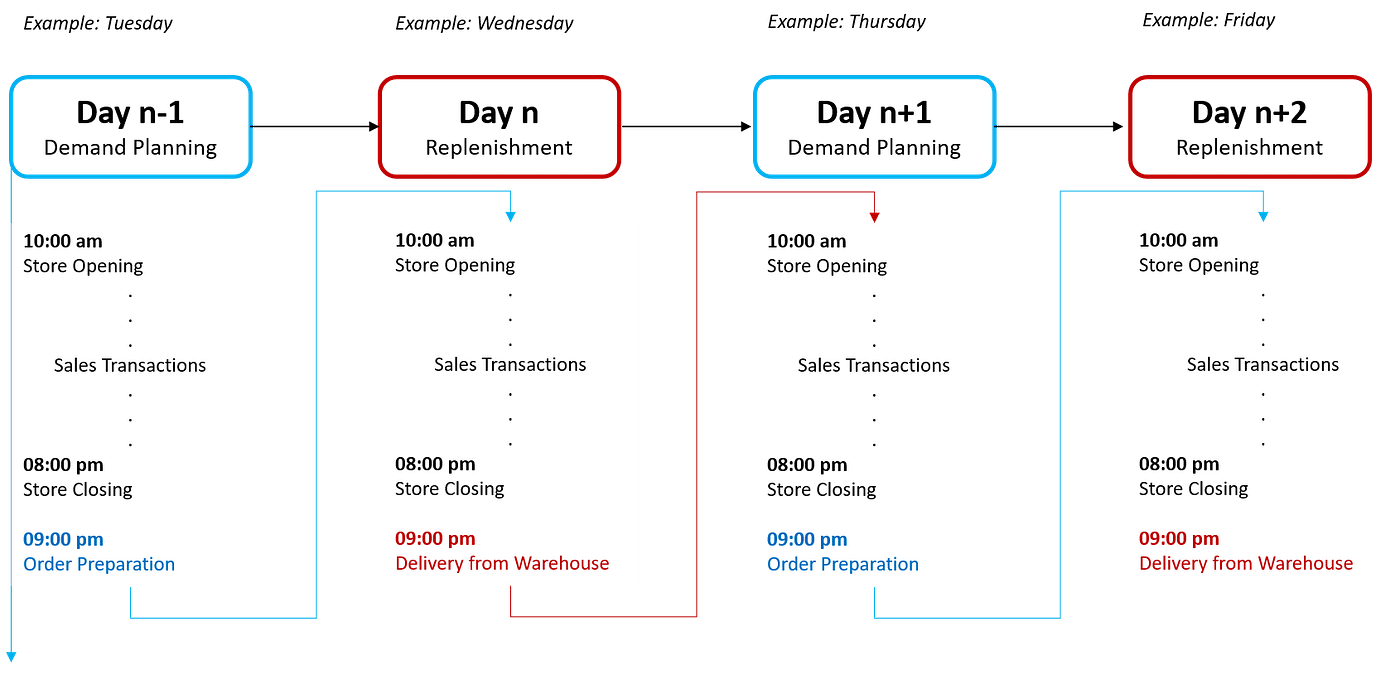
Following our lead-time requirements, replenishment orders have to be created by the store the day before store closing.
Our replenishment algorithm will measure the inventory level
- 10:00 am: before store opening
- 08:00 pm: after store closing and before delivery (if replenishment day)
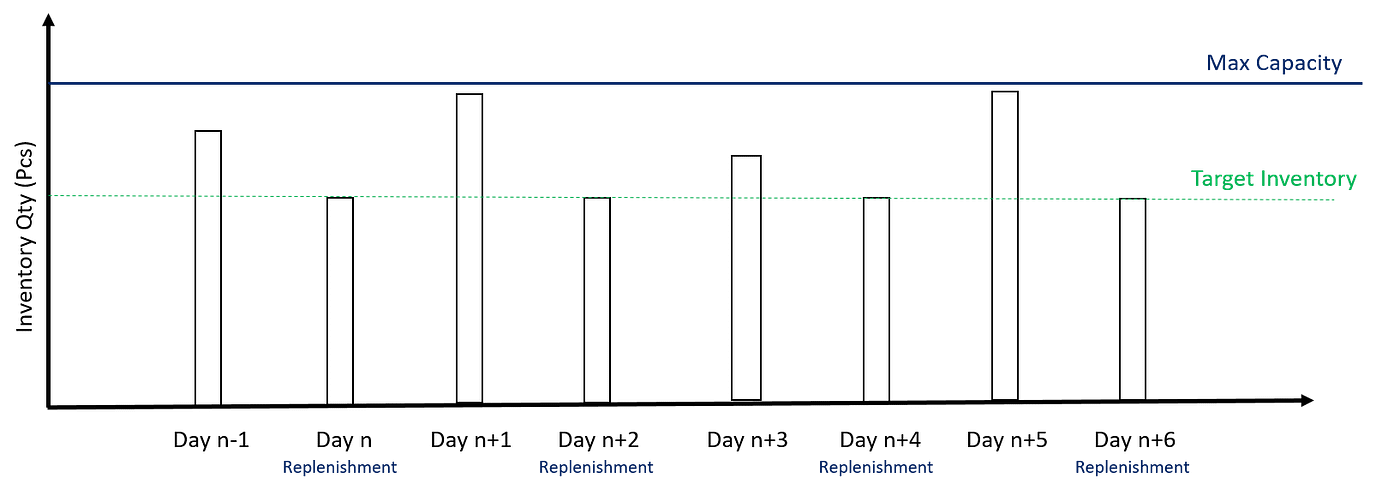
Target: Inventory Day n+1 (10:00 am) = alpha x Capacity (alpha in [0, 1])
- Day n-1: Prepare Replenishment
Data Input: Inventory Day n-1 (09:00 pm), Sales Forecast Day_n, Day_n+1, Day n +2 - Target: Inventory of Day n+2 (08:00 pm)
Fix inventory level before the following delivery: (09:00 pm) Day n+ 2 - Demand Planning
Day_n replenishment needs to cover the demand of Day_n, Day_n+1 and Day_n+2 to reach the inventory level target at the end of Day_n+2 before the next delivery. - Constraint
Inventory after delivery must be lower than the Maximum Capacity

KPI setting for the simulation of different strategies
Inventory Shortage Incidents
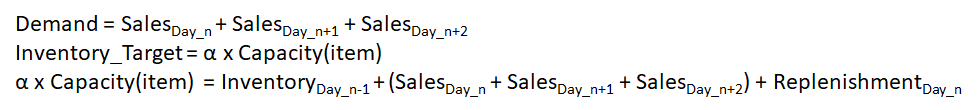
Our replenishment strategy will be evaluated on its capacity to accurately estimate replenishment quantity to reach inventory target day n+2. This estimation can be underestimated:
Example
- Day n-1: Prepare Replenishment Orders
- Warehouse starts preparing orders - Day n: Shipments received at the end of the day
- Inventory reduced by daily transactions
- Orders received at the end of the day - Day n+1: Inventory Shortage
- Inventory level inherited from Day n is not enough to meet Day n+2 demand before shipments arrive at the end of the day.
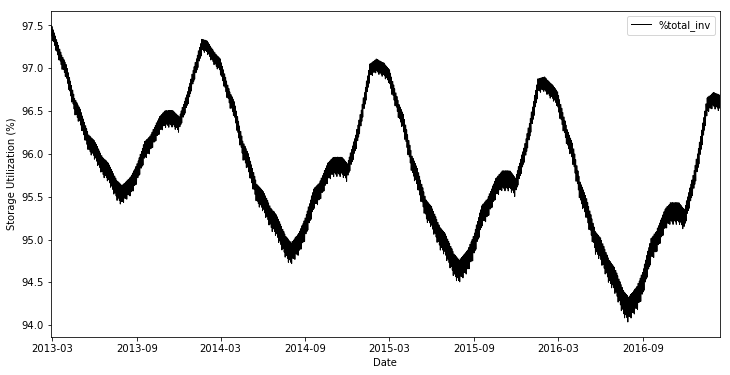
Average Inventory Level (%)
By day,
100 x Storage Qty (Pcs) / Storage Maximum Capacity (Pcs)
Inventory Optimisation: reach the lowest value possible without getting Inventory Shortage Incidents
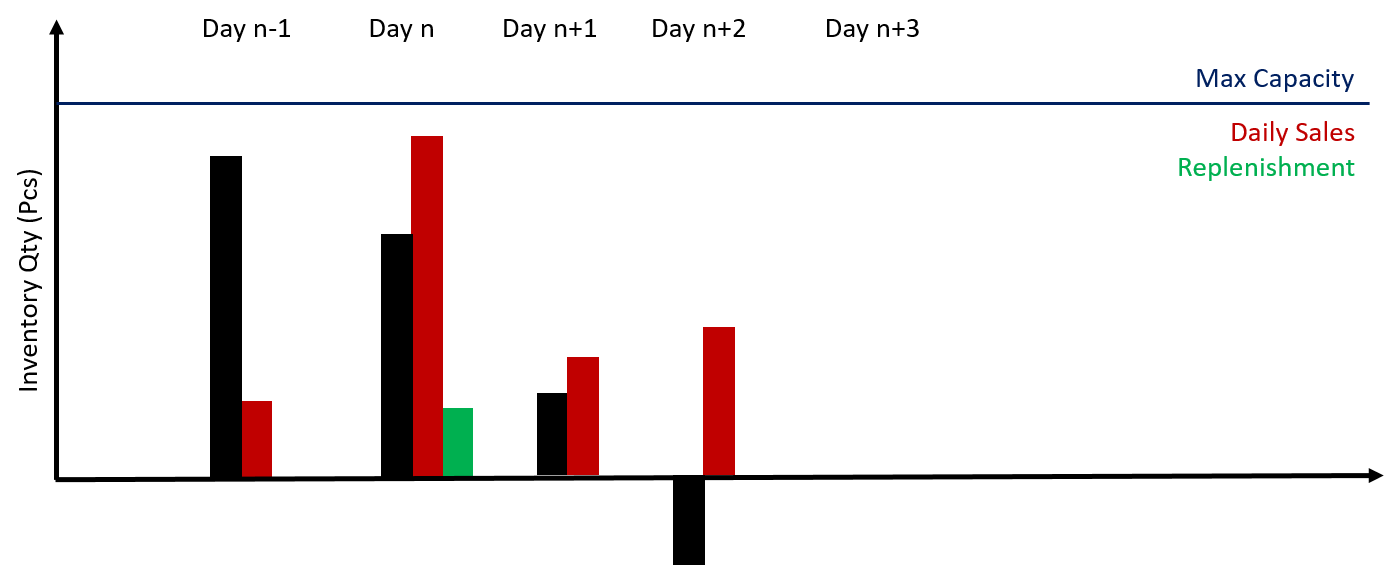
Reducing Replenishment Frequency
Using the sales forecast, a replenishment strategy can reduce the number of replenishments.
The example above shows an example of replenishment day skipped; day n inventory is higher than minimum inventory and enough to meet day n+1 demand.
Remark: This KPI is highly dependent on Inventory Level (%); with a low inventory level, it is difficult to skip a replenishment without risking shortages.
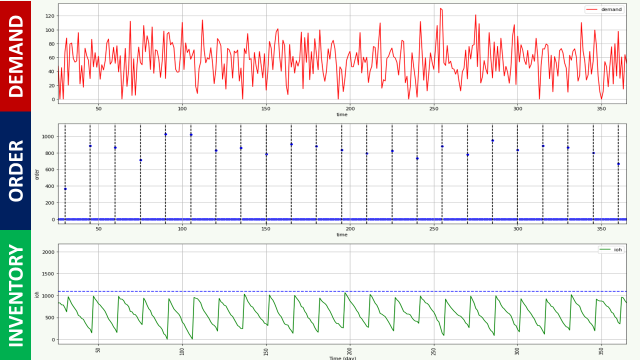
Replenishment Method 1: Full Storage Capacity
We’ll start with a simple replenishment strategy, where the replenishment order quantity is calculated based on:
- Day n-1: Replenishment Order at Day n-1
Input Data: Inventory_Day_n-1 (09:00 pm), Capacity(item) - Order Quantity to reach maximum capacity

- Initial Data
Create Sales DataFrame, Inventory Record, Capacity by Item and Replenishment Data
Remark
- Maximum Storage Capacity = 10 x Maximum Daily Sale (can be tuned later)
- Replenishment Days: ‘Monday’, ‘Wednesday’, ‘Friday’, ‘Sunday’
2. Method 1
Demand = Capacity_Max - Inventory_Day_n-1 (09:00 pm)
3. Run Simulation by Day
Sales Transactions, Inventory Replenishment, Inventory ≥0
Simulation Results
- Capacity = 10 x Maximum Daily Sales
- Replenishment Days: ‘Monday’, ‘Wednesday’, ‘Friday’, ‘Sunday’
Number of Replenishment Skipped: 0
Conclusion and next steps
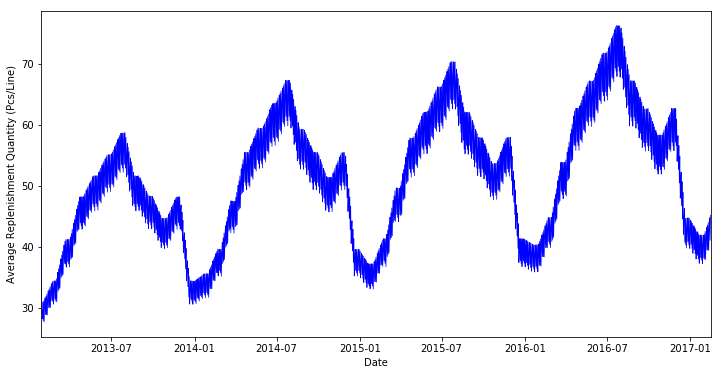
Method 1 is simple and can be optimised. As expected, we have average storage utilisation of nearly 100% and no skipped replenishment days.
The average replenishment quantity graph is also showing us that sales transaction trends are periodic and follow a trend.
- Inventory level: target the lowest inventory level ensuring no inventory shortage incidents
- Order Frequency: using our forecasting model to reduce replenishment
About Me
Let’s connect on LinkedIn and Twitter, I am a Supply Chain Engineer that is using data analytics to improve logistics operations and reduce costs.
If you’re looking for tailored consulting solutions to optimize your supply chain and meet sustainability goals, please contact me.