How Spreadsheets Quietly Cost Supply Chains Millions
A simulation of how a single forecast change moves through five planning teams, and why most retailers lose money in the gap between Sales and Stores.
Last quarter, a fashion retailer ran a national TV campaign for its best-selling apparel line.
The demand planner updated the forecast on a Tuesday morning. But the supply team only found out eleven days later, in the monthly meeting!
By then, the factory lead time had expired, and two outlet stores had empty shelves for the first week of the campaign.
VP of Marketing: Tens of thousands of dollars in lost campaign revenue due to insufficient inventory!
The marketing budget was spent. The traffic showed up. The product did not.
This is what S&OP was supposed to fix, and in most retailers, it still has not.
This is not a technology problem. It is the way most retailers organise the conversation between Sales and Operations.
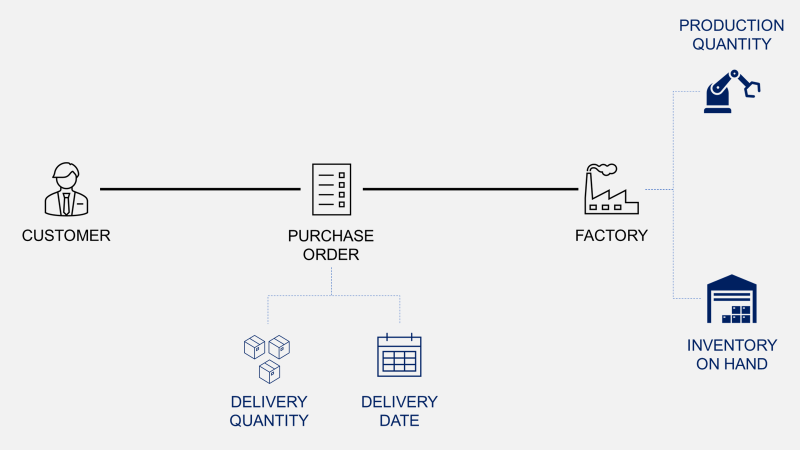
Integrated Business Planning, also known as Sales and Operations Planning (S&OP), is the process that translates sales forecasts ("We expect to sell 50 units next month") to products on the shelf ("75 units delivered at Store 125 last week").
In a spreadsheet world, each team works on its own copy of the data, and a single forecast change takes weeks and the cost is measured in lost sales nobody can trace back to the original delay.
What should be a seamless process becomes a chain of emails and meetings, in which teams discover changes too late.
At a fashion retail company I've been working with, it took up to 27 days to see a change in the demand signal to be communicated to the warehouse teams.
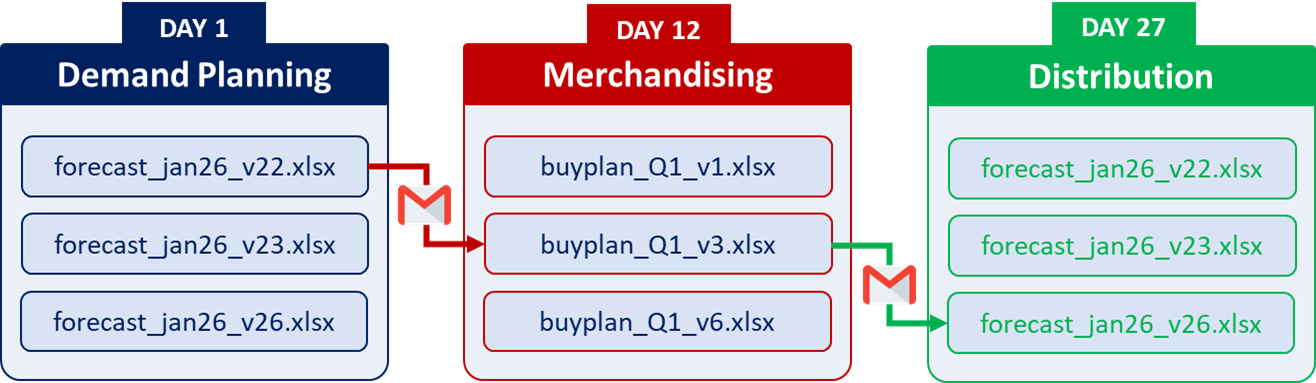
The information was trapped in isolated Excel files shared via email, with limited traceability and version control.
The root cause of poor planning execution is rarely the forecasting model alone. It is the siloed organisation around it.
Merch Team to Demand Planning: Can you send me forecast_jan2026_v12.xslx to prepare tomorrow's buying session?
In most companies, the answer is measured in weeks, and the cost shows up in next quarter's margin without anyone connecting the dots.
In the simulation you are about to read, it is one working day!
A perfect forecast that nobody downstream sees in time is worth nothing.
In this article, I will show how a connected planning platform turns that two-week delay into a same-day action plan, and why this single change can save retailers millions.
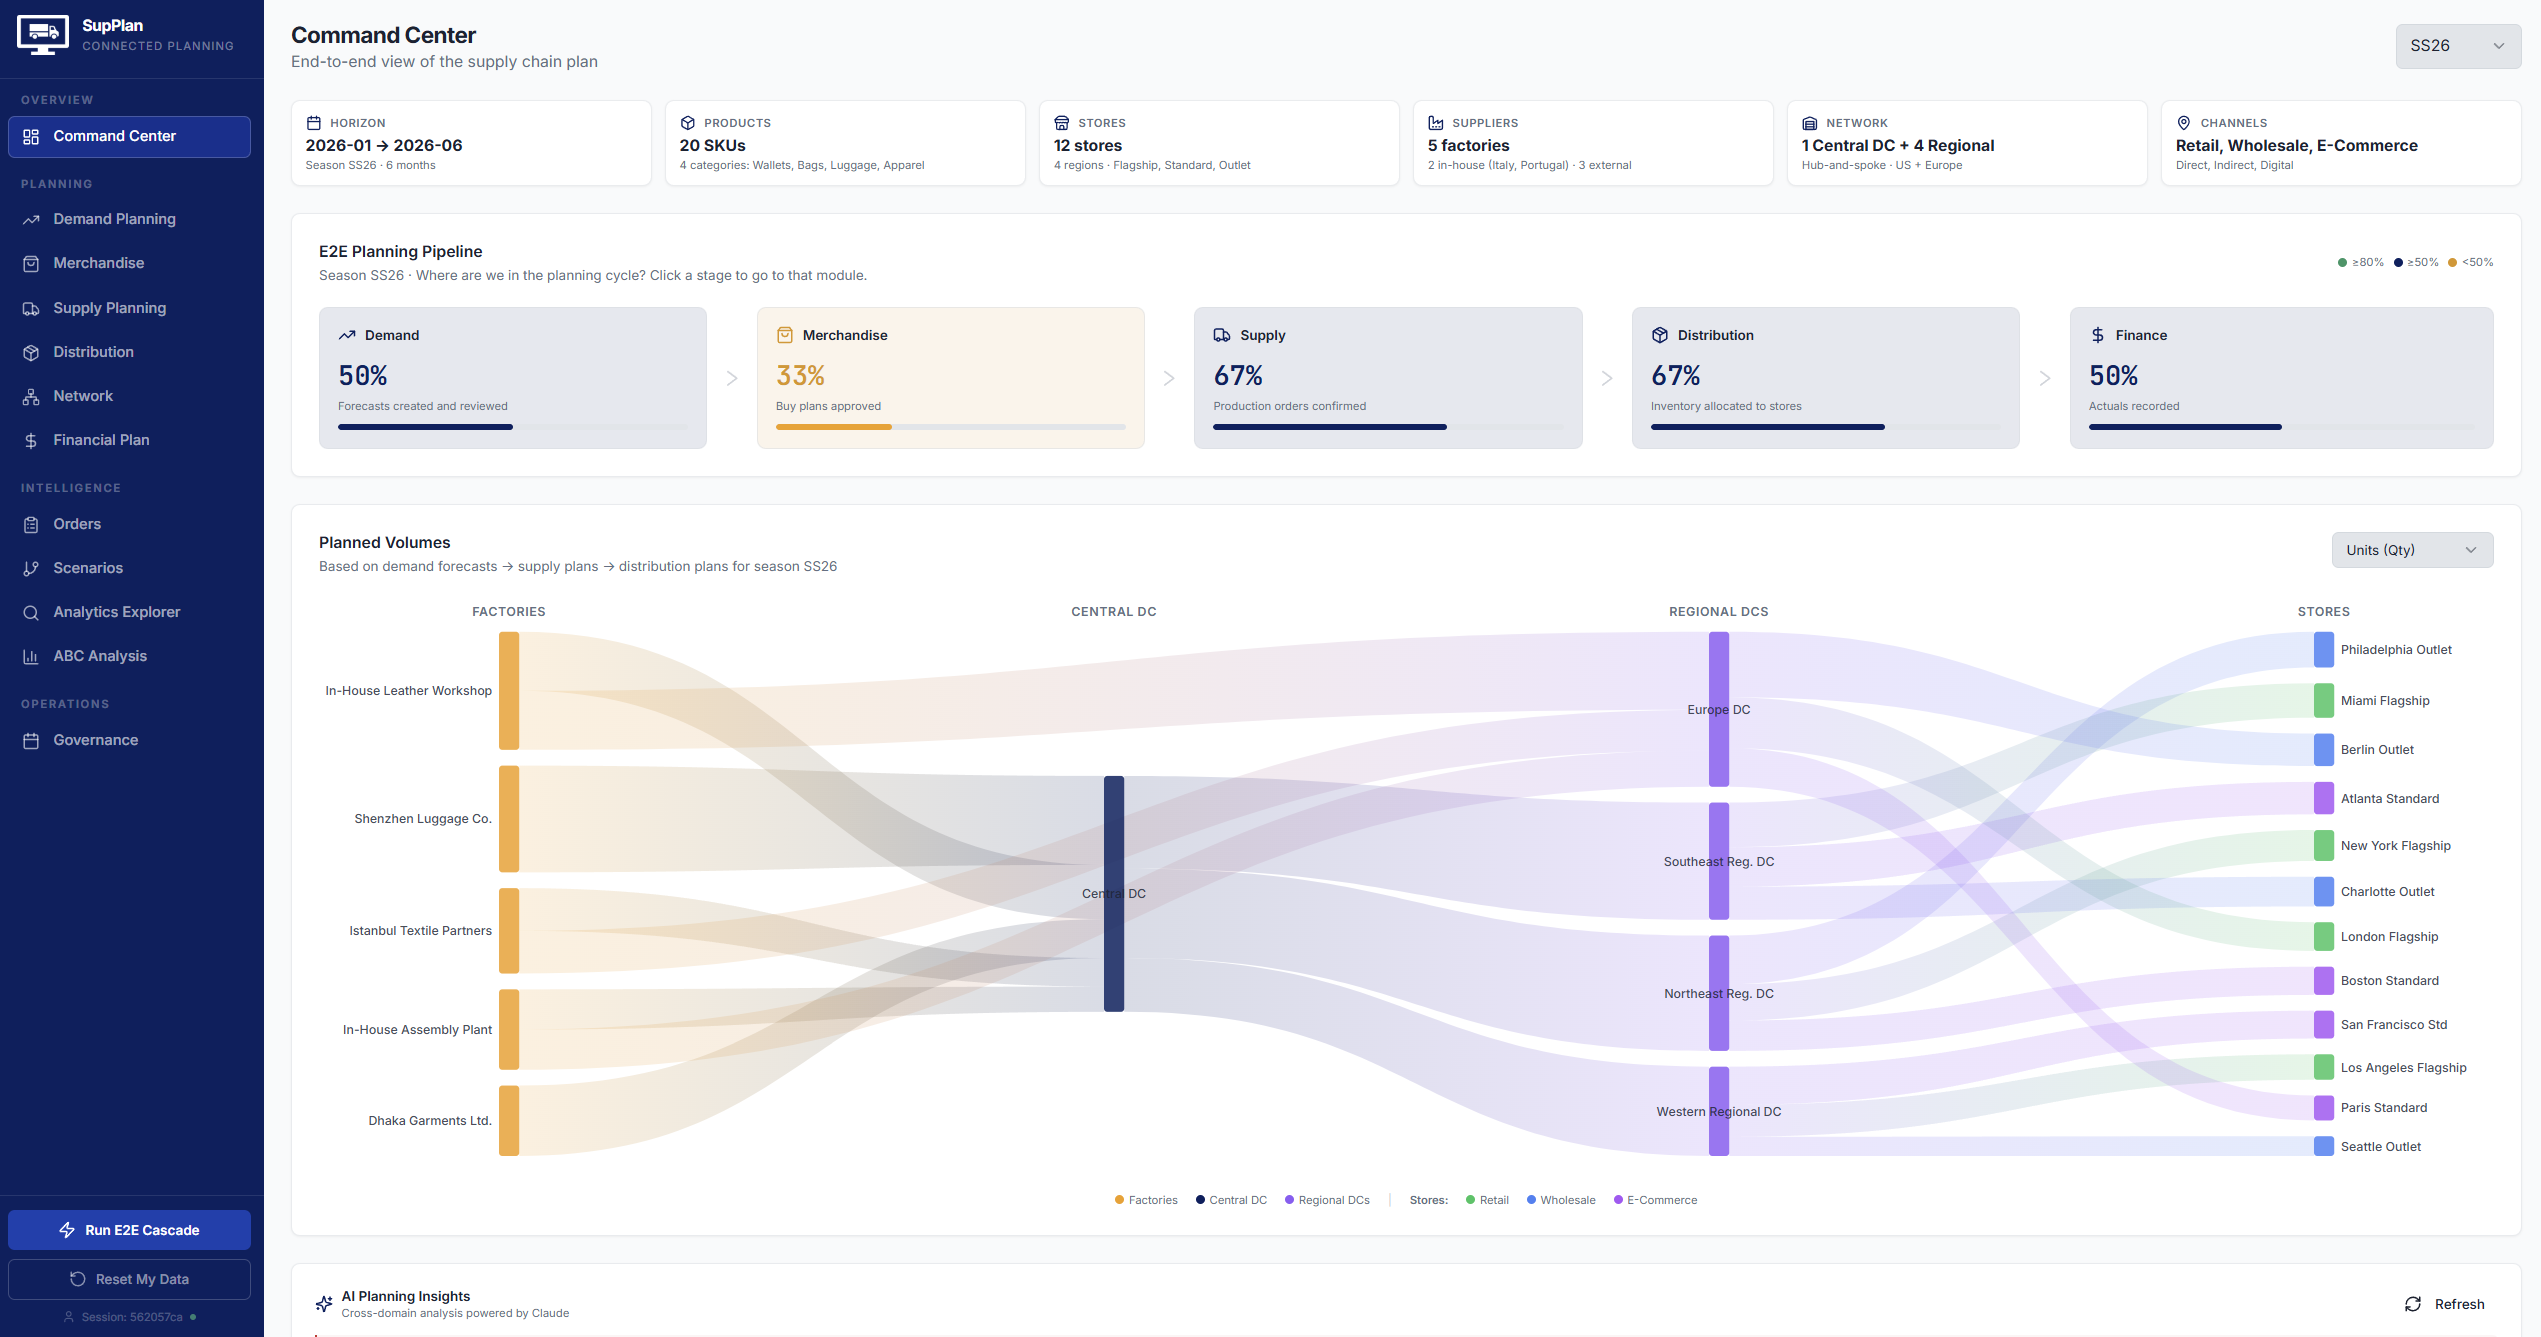
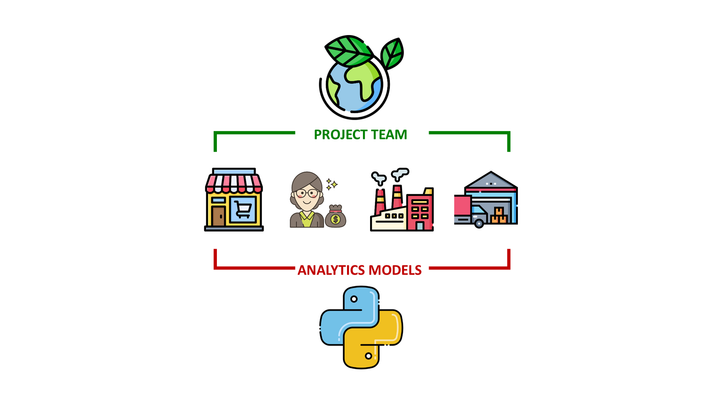
We will use a simulation platform that I designed from scratch, where you can experiment with how information flows across teams through integrated business planning.
The Five Teams That Don't Talk
To make this concrete, let's look at SupFashion, a mid-size European fashion retailer that is small enough to be agile and big enough to feel every planning failure in its margin.
A Mid-Size Fashion Retailer with a Complex Supply Chain
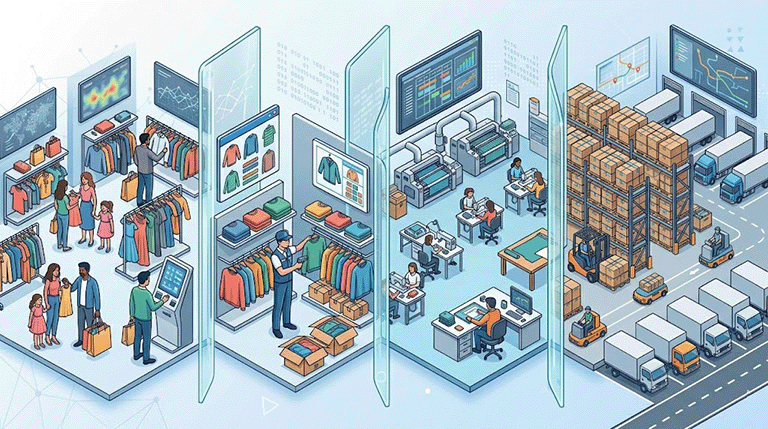
SupFashion is a mid-size fashion retailer based in Europe.
It sells four product lines (wallets, bags, luggage, apparel), sources from five factories on three continents, and runs 12 stores across the United States and Europe.
The brand is small by industry standards, but the planning challenges are exactly the same as those of a global fashion giant.
The five teams in the chain
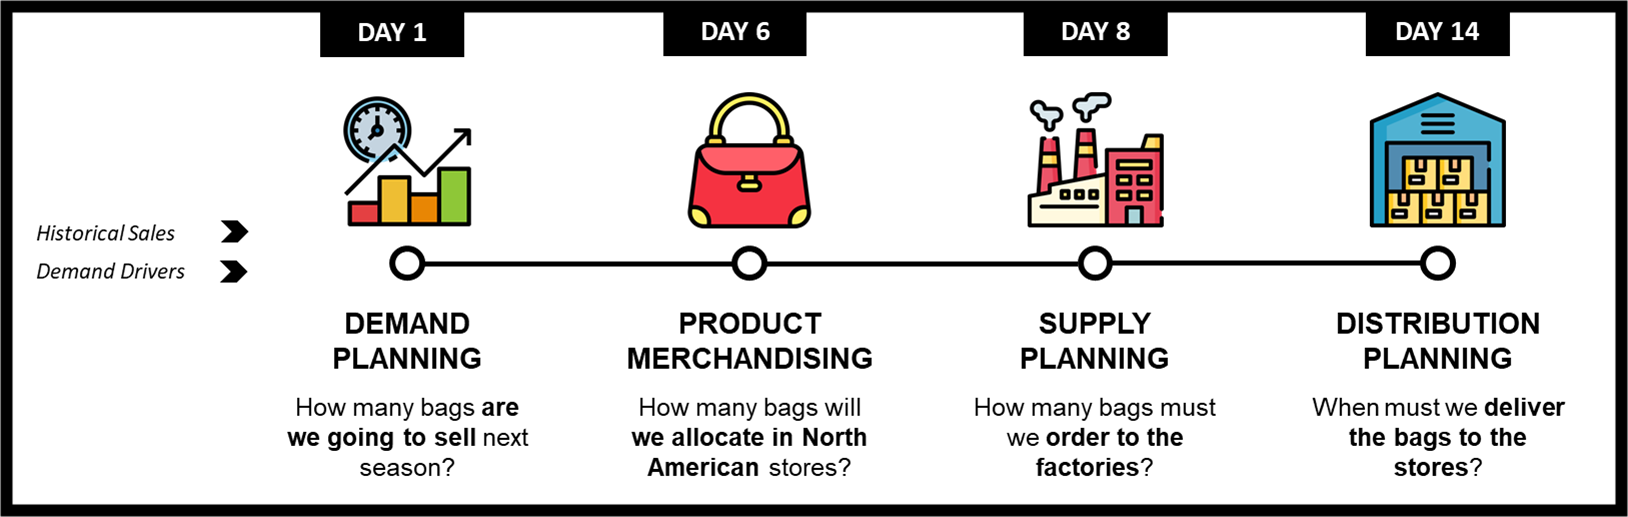
To plan and run this network, four planning teams work in sequence every month, supported by a finance team that closes the loop.
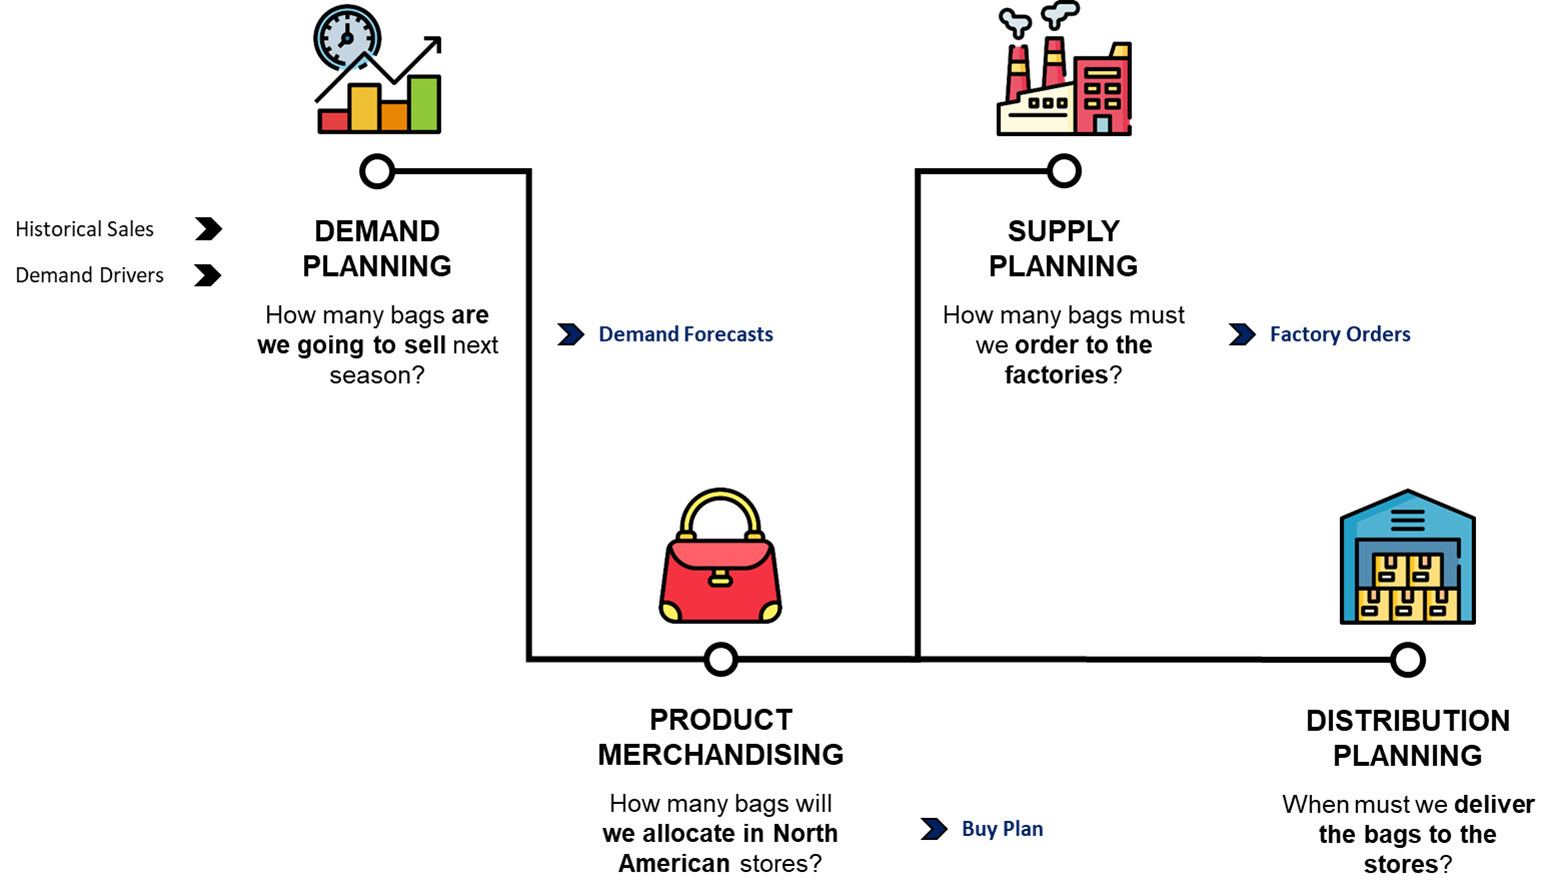
Each team's job depends on the output of the team before it:
- The merchandiser cannot lock a buy plan until the demand planner has signed off on the forecast.
- The supply planner cannot place a factory order until the buy plan is approved.
- Finance cannot project margin until production and freight costs are confirmed.
Here is the catch. None of these five teams works in the same tool!
Five Teams, Five Spreadsheets, Zero Conversation
This is how every planning error enters the system. Not through bad models, but through copy-and-paste.
In a SupFashion, each of these five teams works on its own copy of the data, in its own tool:
- A demand planner has
forecast_jan2026_v22.xlsx. - The merchandiser has
buy_plan_SS26_FINAL_v3.xlsx. - The supply planner manages a Google Sheet shared with the factory.
- Distribution runs on a Power BI dashboard built three years ago by someone who has since left.
- Finance reconciles all of it in a separate system, two weeks after the fact.
When the demand planner changes a number, it sits in her file until the next monthly meeting.
From there, it travels by email and is re-typed across four teams. Two weeks later, the distribution finally hears about it.
Are we working on the right version of XXX.xlsx ? 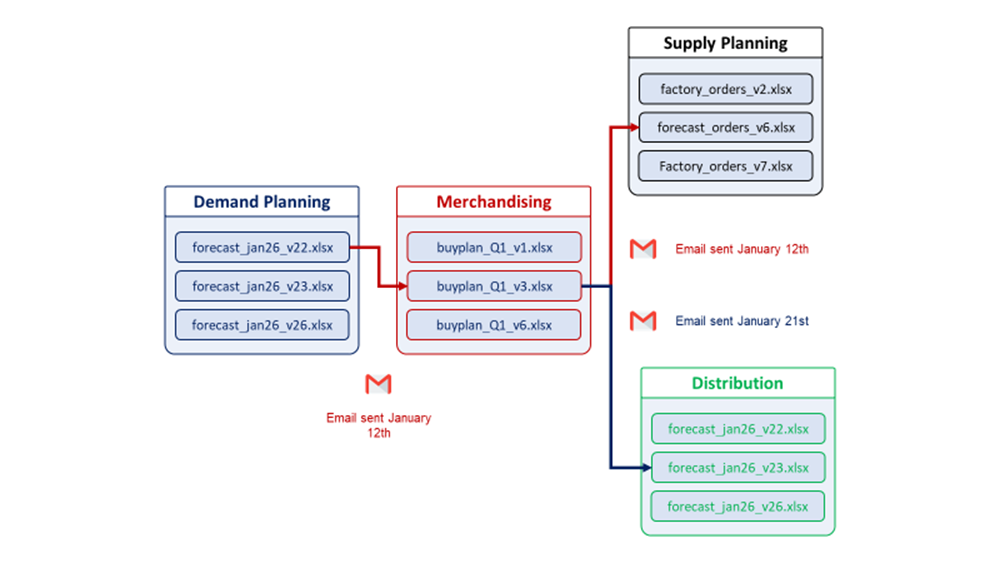
In the next section, we will follow a single forecast change in detail and see what happens when those two weeks become one working day.
One Forecast Change, Two Realities
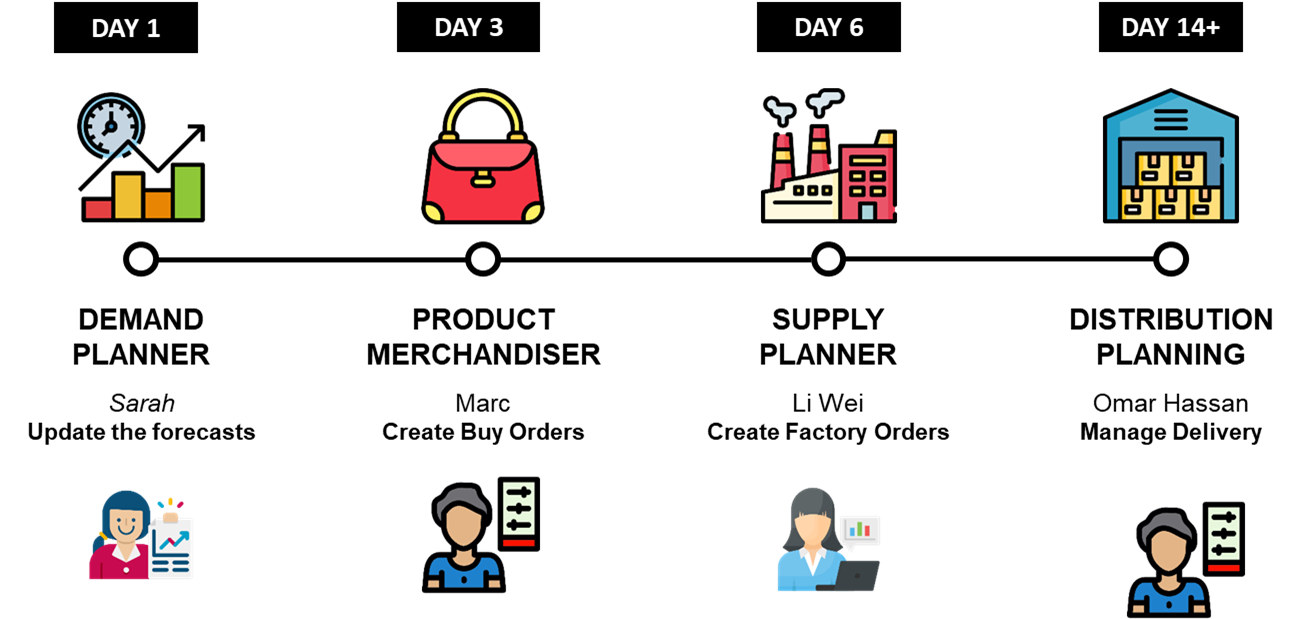
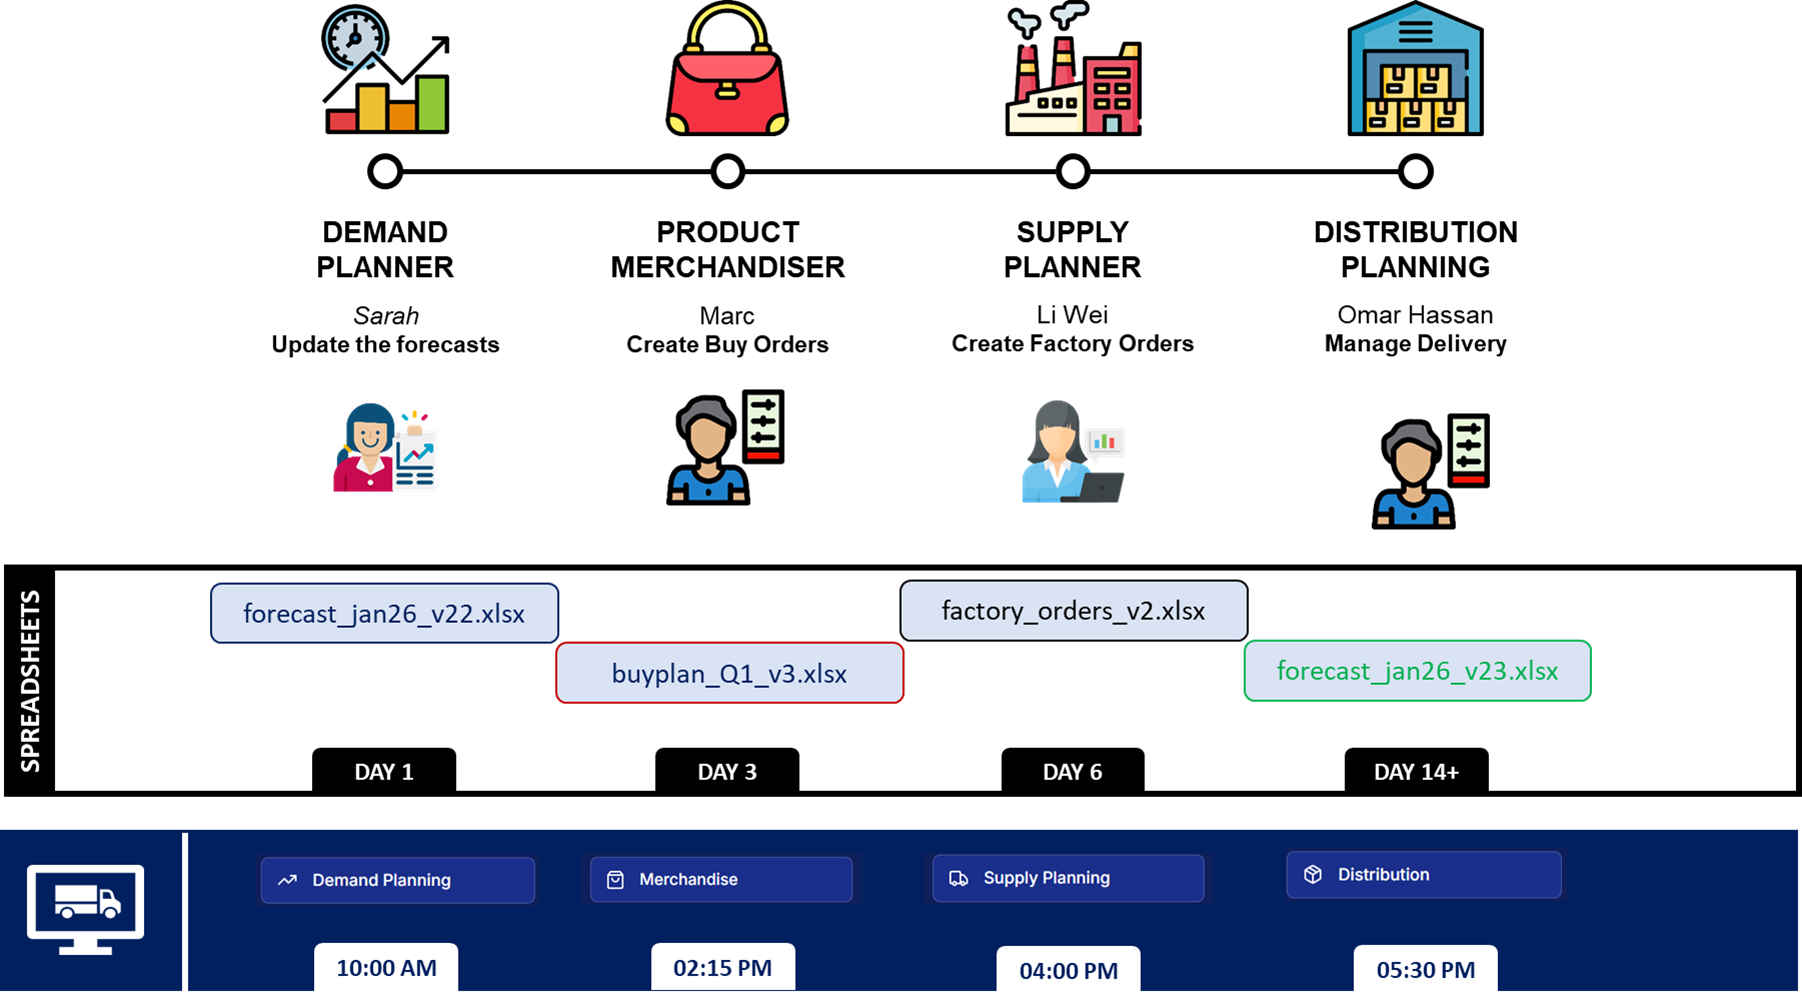
Let me introduce you to SupFashion's end-to-end planning team.
We will analyse how the entire process chain reacts to a change in the demand signal, considering two scenarios:
- Scenario 1: The isolated spreadsheets world that SupFashion lives in today
- Scenario 2: Planners working on the same connected platform SupPlan
We will discover how SupPlan enabled SupFashion to cut the end-to-end cycle time from 14 days to less than 24 hours.
The trigger: A Sports Fair Starting in May
It is Fmorning, April 10th.
Sarah, the demand planner at SupFashion, receives a message from the marketing director.
"The Base Layer Top - Black has been selected for the Southeast Summer Sports Fair in Charlotte and Atlanta (May 2026). We expect a 30% footfall increase in both stores. Please adjust the forecast accordingly."
Sarah knows from past campaigns that outlet stores in tier-2 cities respond strongest to TV advertising.
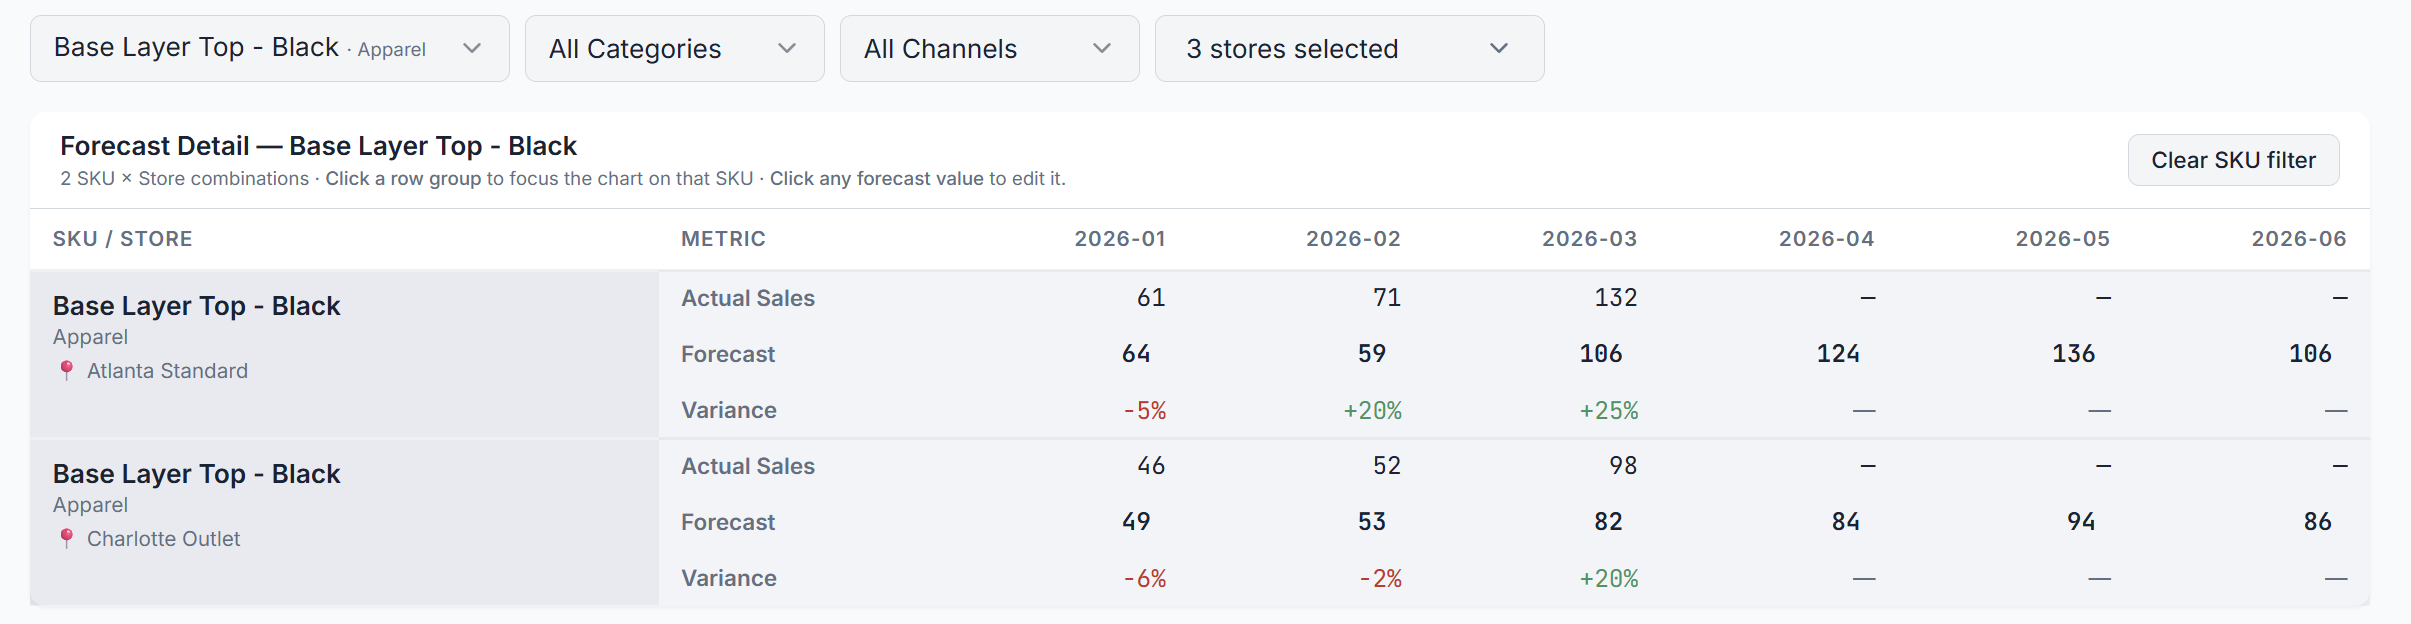
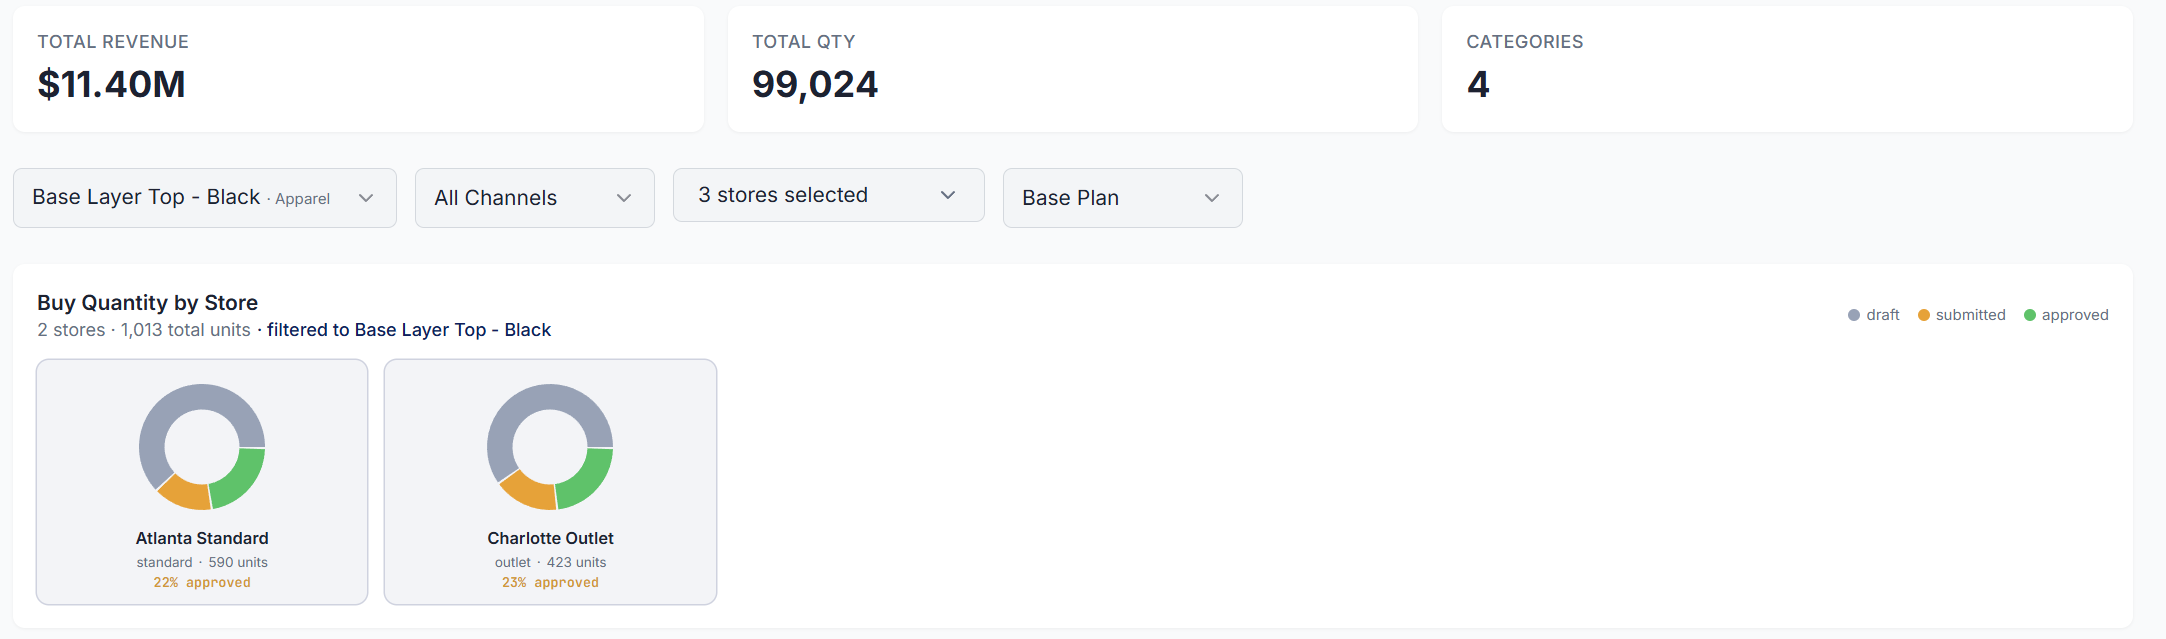
She needs to increase the forecast for Base Layer Top - Black (Apparel category) at two Southeast US stores for May 2026:
- +30 units at Charlotte Outlet (94 → 124)
- +20 units at Atlanta Standard (136 → 156)
Total adjustment: +50 units for one month, two stores.
What happens at SupFashion today with spreadsheets
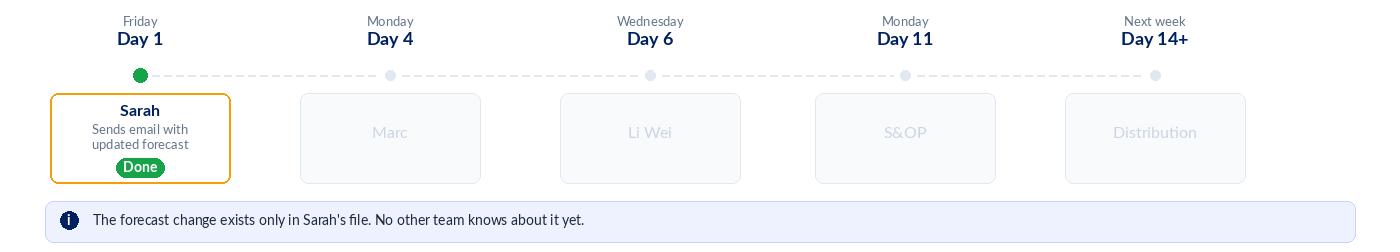
Sarah opens forecast_apr2026_v8.xlsx, updates the cells for Charlotte and Atlanta stores.
She saves the file and emails it to Marc, the merchandiser in charge of the North American market.
Timeline - Day 1 (Friday): Sarah sends the email.
- Subject:
Updated forecast for Base Layer Top, Charlotte + Atlanta, pls review.
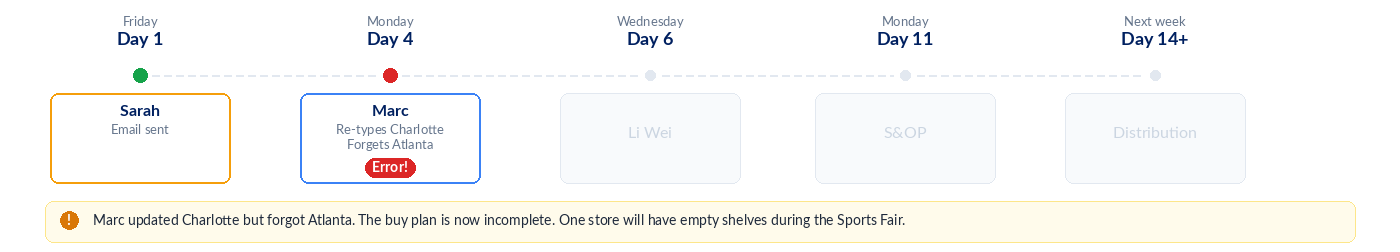
Timeline - Day 4 (Monday): Marc opens the email and
- Downloads the file, compares it with
buy_plan_SS26_FINAL_v3.xlsx - He manually re-types the new quantities into his own spreadsheet, but forgets Atlanta Standard.
Base Layer Top - Black - (Image by Samir Saci)The Atlanta Standard buying plan does not account for the additional demand of 20 units.
Unfortunately, he emailed the updated buy plan to Li Wei, the supply planner.
Timeline - Day 6 (Wednesday): Li Wei opens Marc's buy plan to update factory orders
- Checks the factory capacity of the apparel supplier, Dhaka Garments Ltd.
- Only updates the orders of Philadelphia Outlet.
- She found a problem!
With a 21-day lead time from Dhaka, she needed to commit on March 10th to receive goods by May 1st.
That was six days ago.
It is too late. The goods will not arrive on time for the campaign.
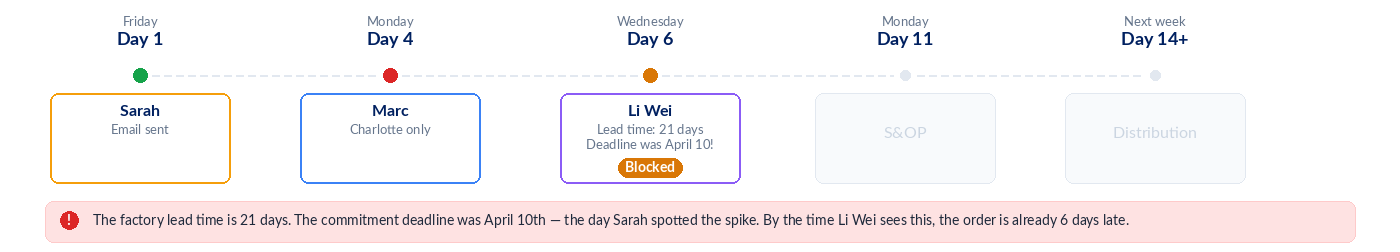
Li Wei flags the issue in a reply-all email, but nobody responds until Wednesday.
Timeline - Day 11 (Monday): The monthly S&OP meeting happens.
- Sarah presents her forecast.
- Marc presents his buy plan with the Atlanta adjustment missing.
- Li Wei raises the concern about the lead time.
The distribution team hears about the change for the first time.
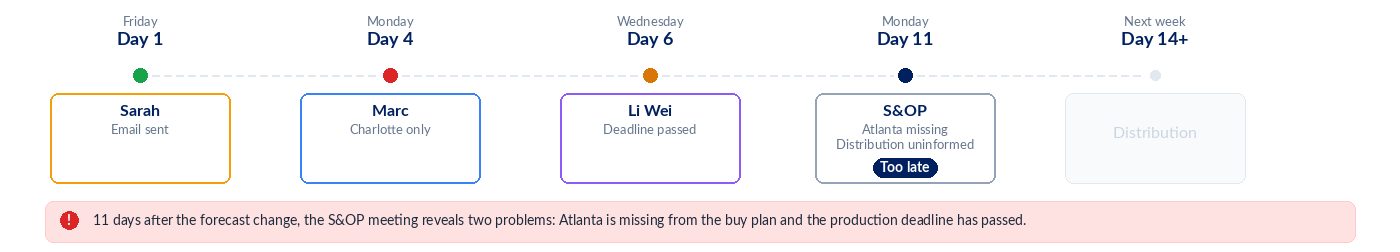
Distribution Team: "Where is the store allocation?"
It does not exist yet!
Timeline - Day 14+ (Thursday): Distribution finally receives the confirmed production order and starts planning the warehouse allocation.
But goods will arrive in late May at the earliest, missing the first two weeks of the Sports Fair.
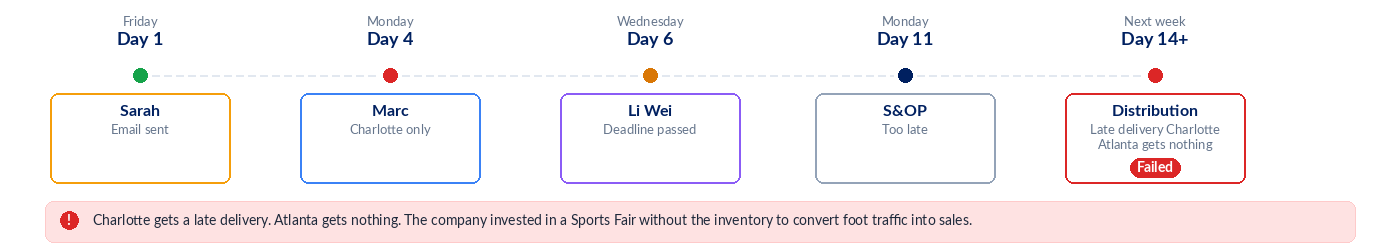
Result: investing in a marketing campaign without the inventory to convert it
- Charlotte store will get late deliveries.
- Atlanta gets nothing.
A $40,000 marketing investment that drives traffic to half-empty shelves in Charlotte and zero stock in Atlanta.
The lost sales from Atlanta alone exceed $1,500. The lost sales from Charlotte's late delivery push the total well past the cost of the campaign itself.
In the next section, we will simulate the exact same scenario using now SupPlan.
The same scenario, the same 52-day constraint, the same stores. The only variable we change is how the information travels.
What happens with a connected platform?
Let us imagine our scenario triggered by the same event at the exact same time.
But this time, Sarah uses the connected planning platform SupPlan instead of spreadsheets.
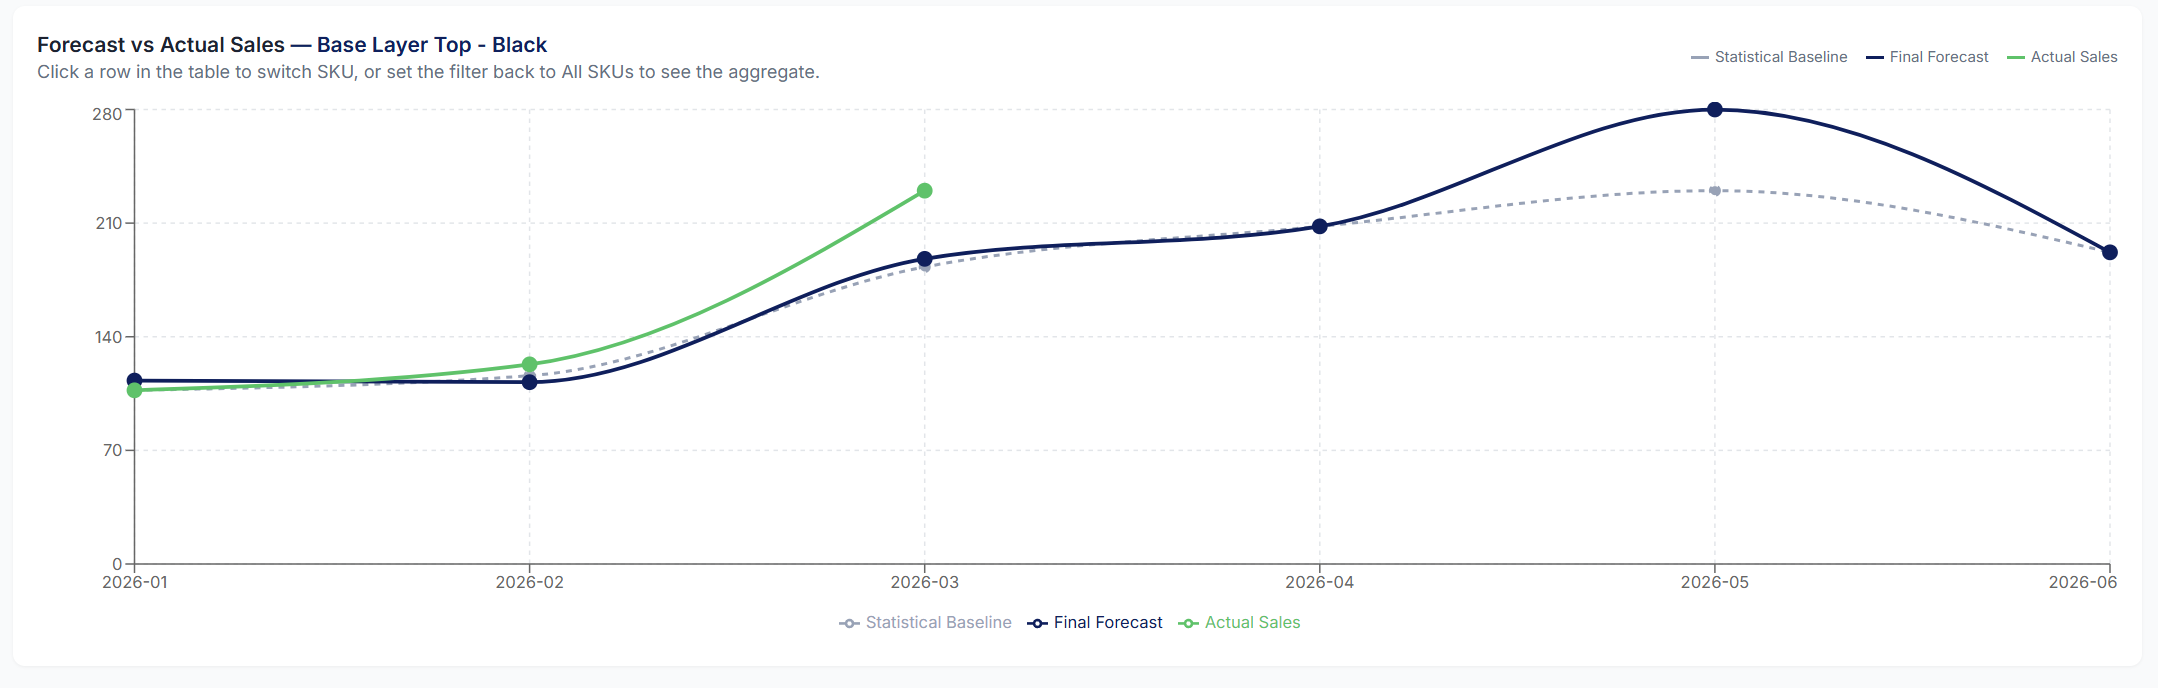
- Sarah opens the Demand Planning page and selects the Planner View tab.
- She filters by the SKU: Base Layer Top - Black.
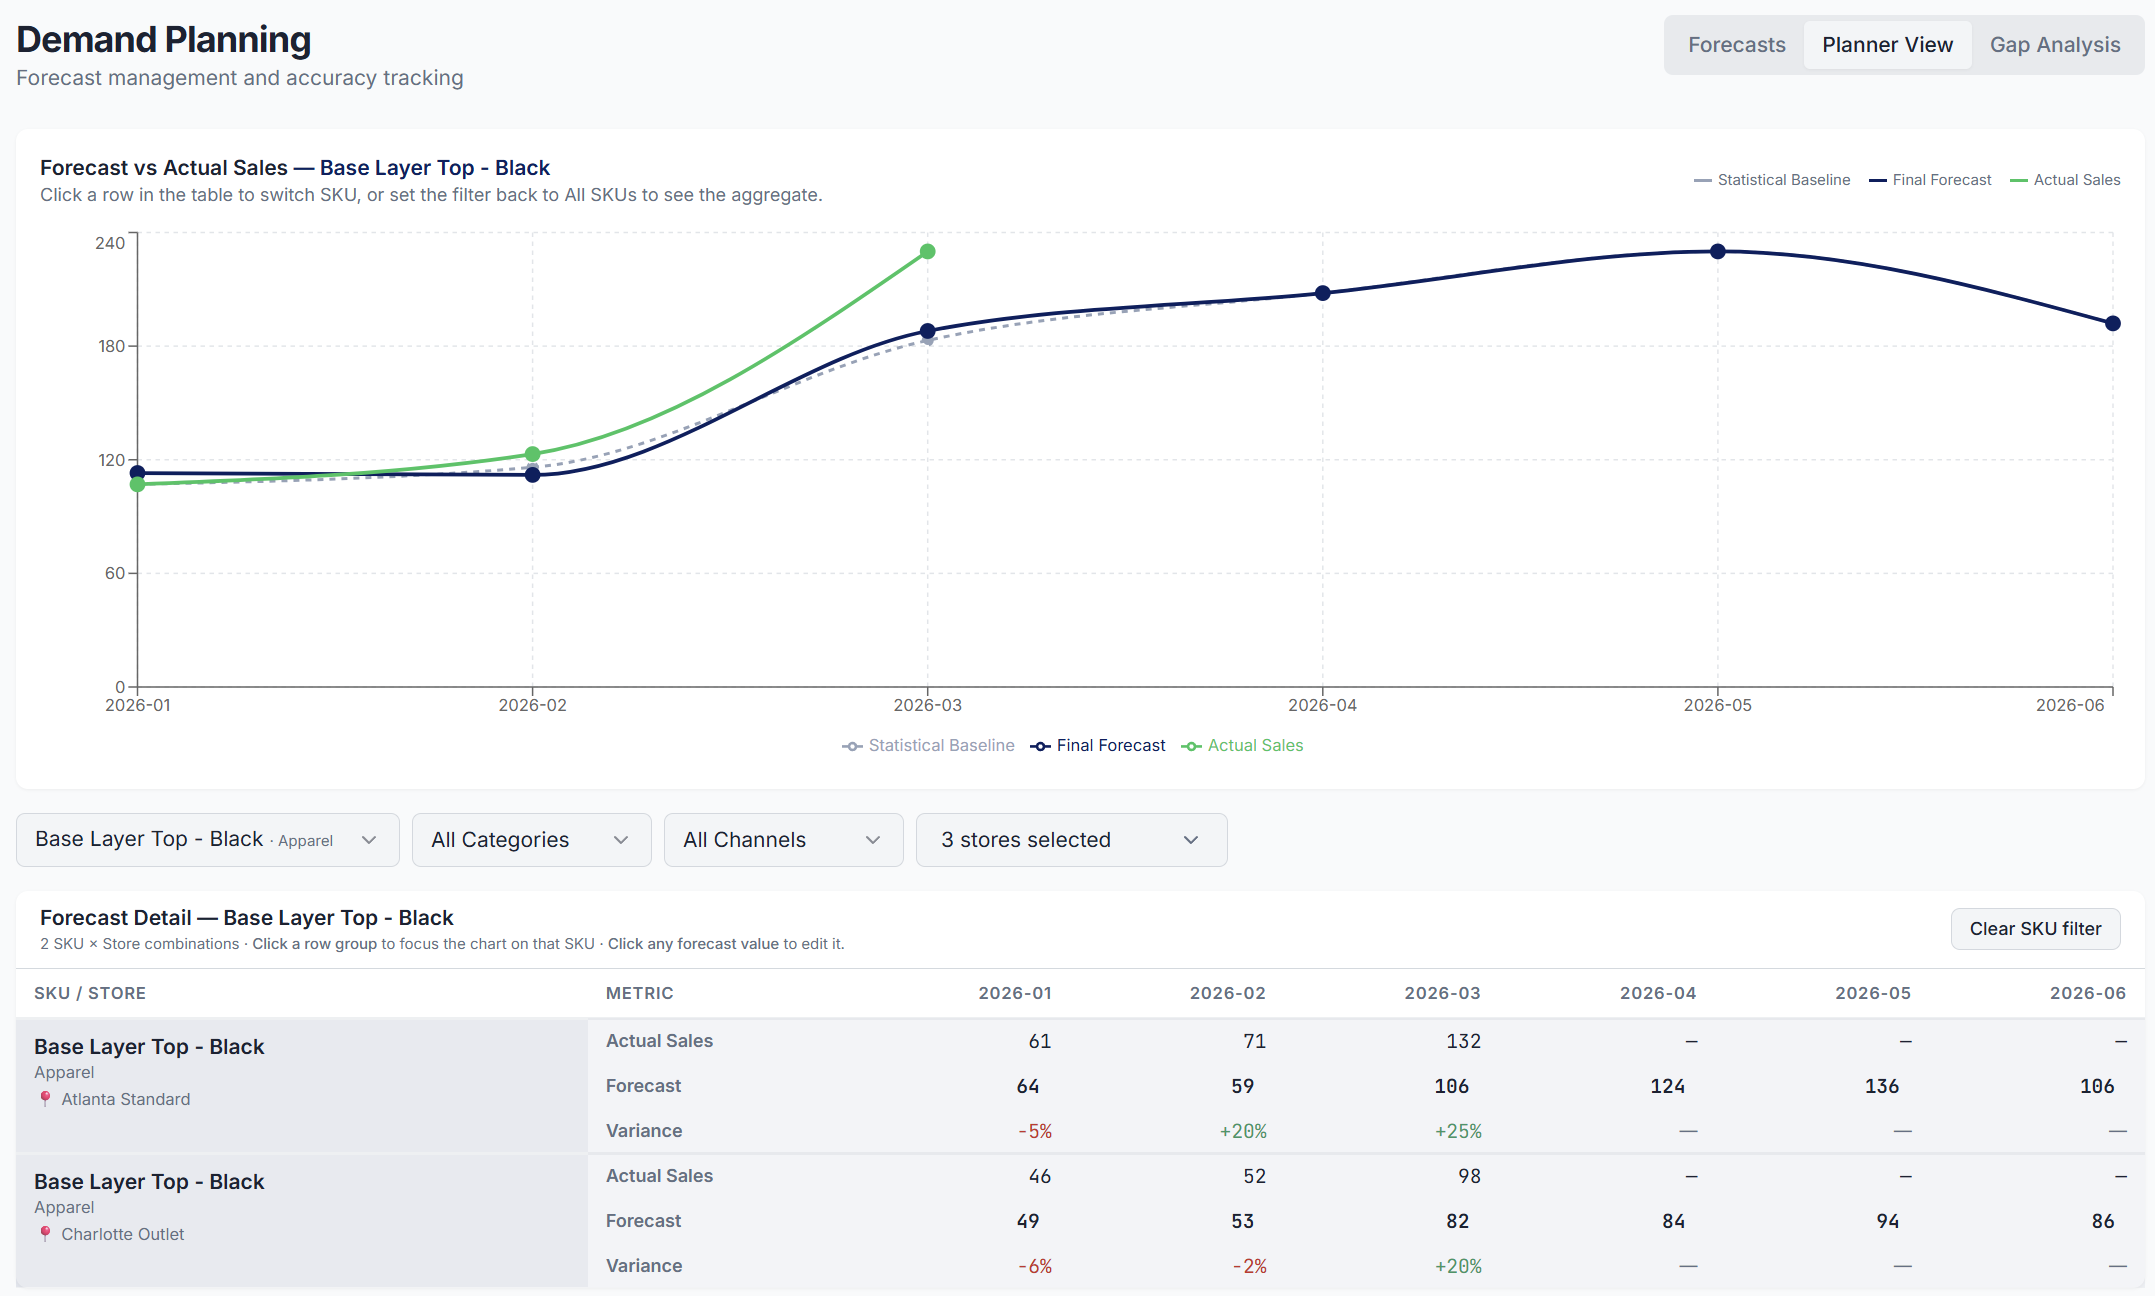
Timeline - Day 1, 10:00 am: Sarah Opens the Planner View
- Sarah clicks on the forecast cell for Charlotte Outlet, 2026-05, types the new value, and presses Enter.
- She does the same for Atlanta Outlet.
For each change at the SKU x Store level, the tool provides an overview of the potential impacts.
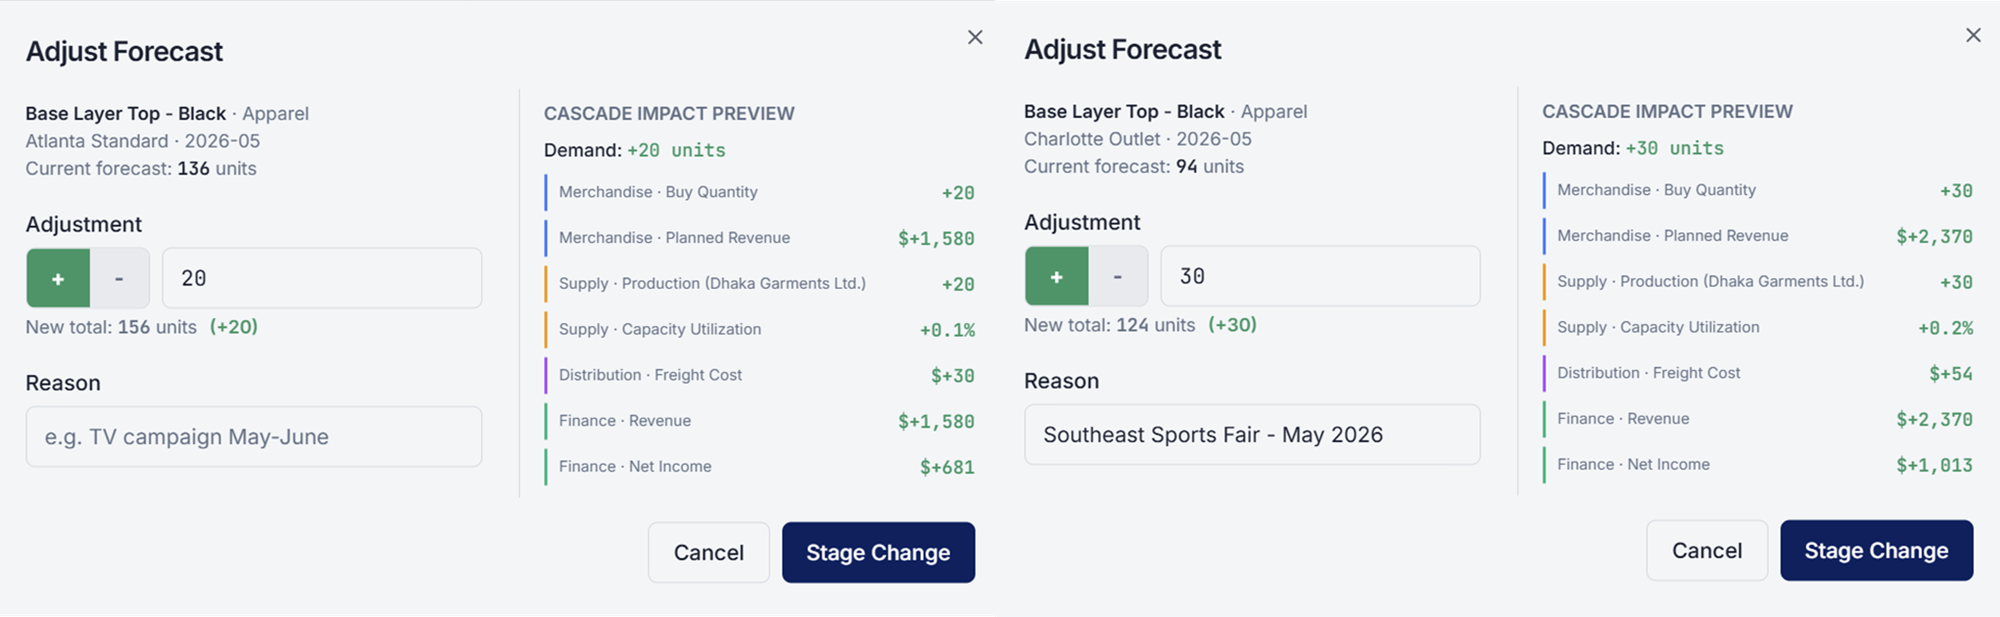
She has increased the May forecast for Base Layer Top - Black by 50 units.
These two changes are staged; that means they have not yet cascaded to the rest of the planning chain.
Timeline - Day 1, 11:00 am: Before saving, Sarah switches to the Forecasts tab.
The Cascade Impact Preview panel opens on the right.
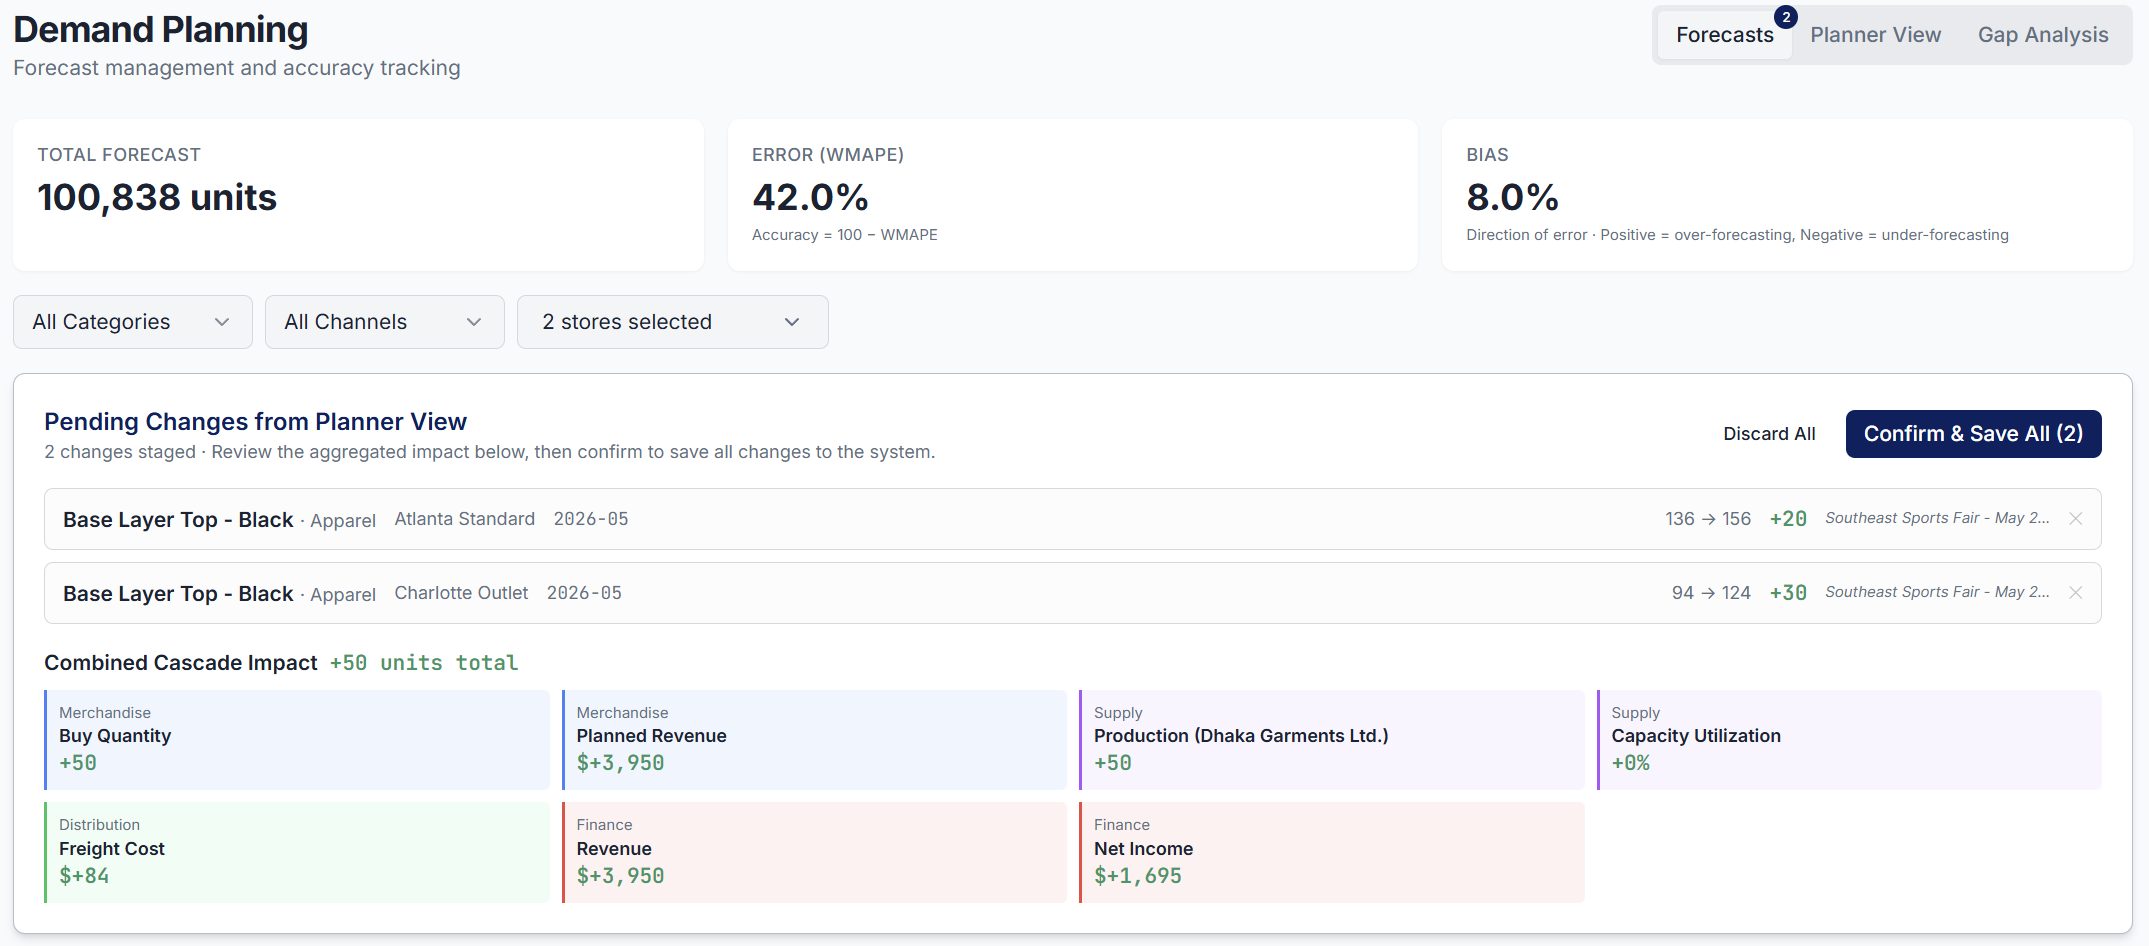
This window appears to inform Sarah about the cascading impact of these two changes:
- Merchandising: what is the impact on buy? (+50 units)
- Supply Planning: impact on factory orders? (+50 units to produce at Dhaka Garments, 52-day lead time)
- Finance: additional revenue and costs? ($+3950 in revenue)
Sarah now sees the full downstream impact before committing to anything.
She saves the adjustment with the reason: "Southeast Sports Fair - May 2026" and clicks Run E2E Cascade to inform the other teams.
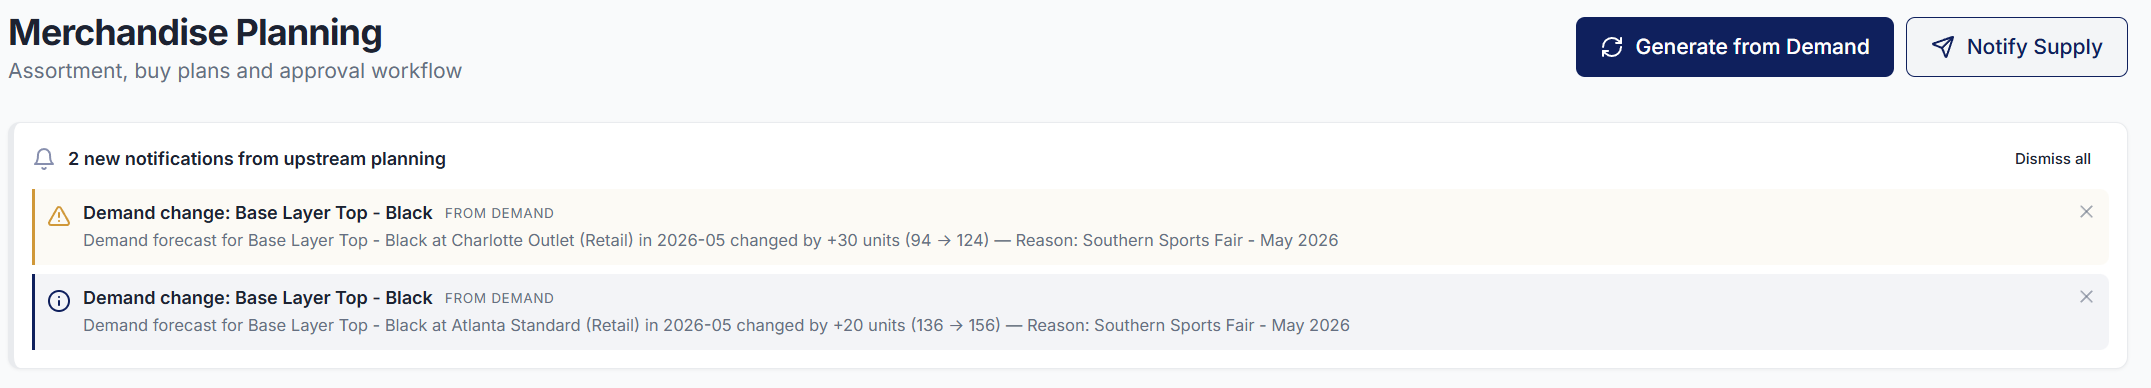
Timeline - Day 1, 02:15 pm: Marc opens the Merchandise Planning page.
A notification banner is already at the top of his screen:
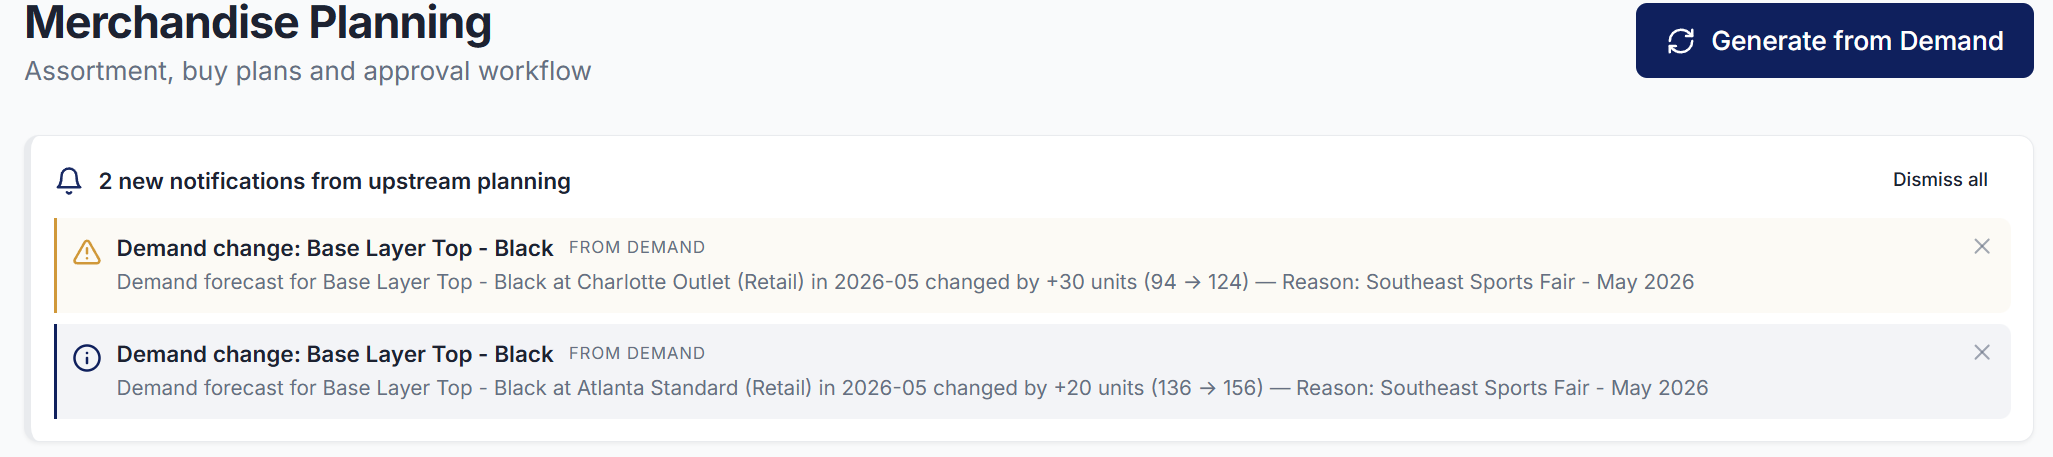
"Demand change: Base Layer Top - Black.
Forecast for Charlotte Outlet (Retail) in 2026-05 changed by +30 units (94 to 124).
Reason: TV campaign May-June, outlet stores, confirmed by marketing."
The system generates two updated buy orders for May 2026, already reflecting the new forecast quantities.
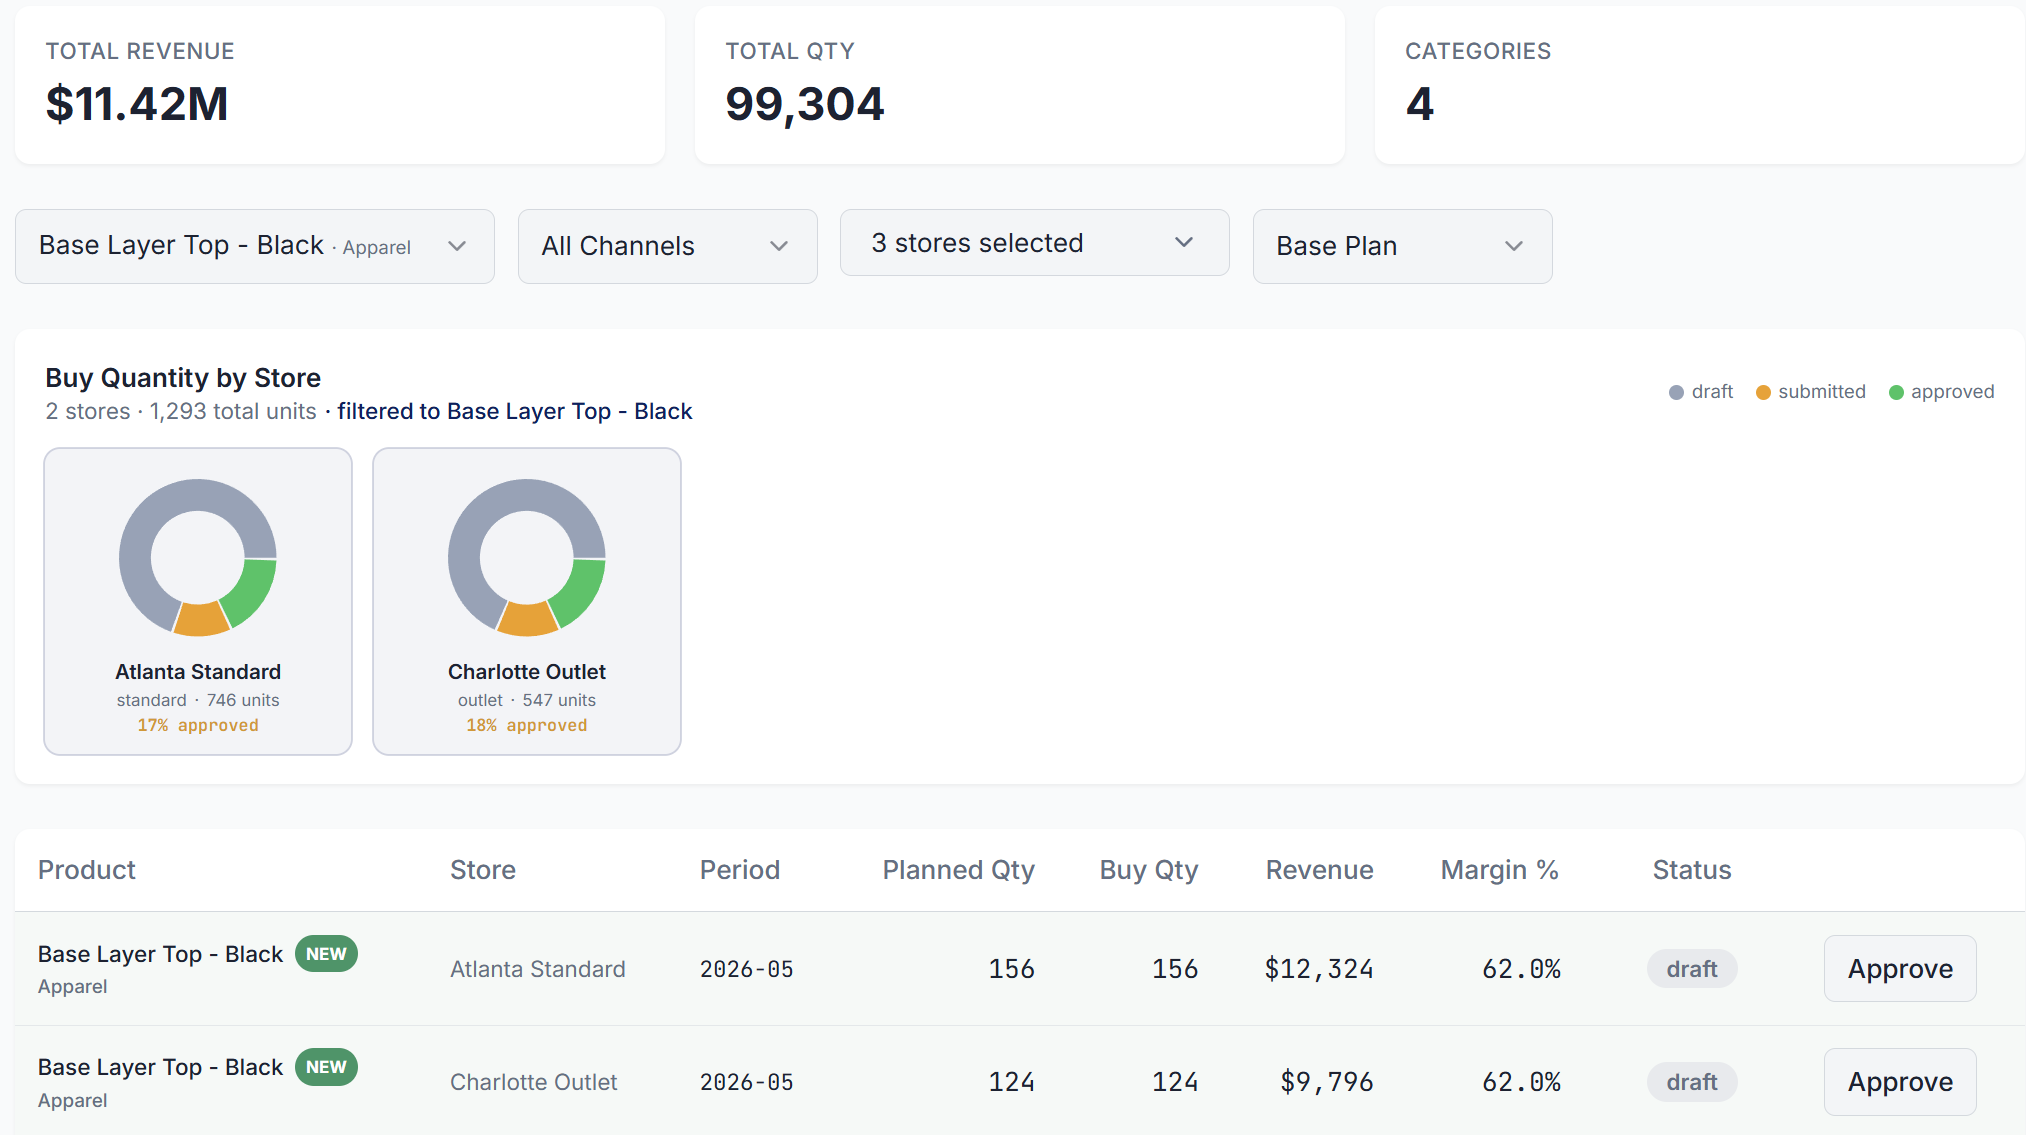
Marc doesn't need to open an email, retype numbers, or reconcile a spreadsheet.
He simply opens the buy plan and finds two new draft lines already waiting for him with:
- Updated quantities: former baseline + Sarah's forecast adjustments
- Corresponding revenue projections: units x (unit price)
- Margin impact: units x (unit margin)
He just has to approve each row and select the top-right button, Notify Supply, to inform Li Wei.
We saved a meeting and, more importantly, Marc will not miss Atlanta Standard!
Timeline - Day 1, 04:00 pm: Li Wei opens the Supply Planning page.
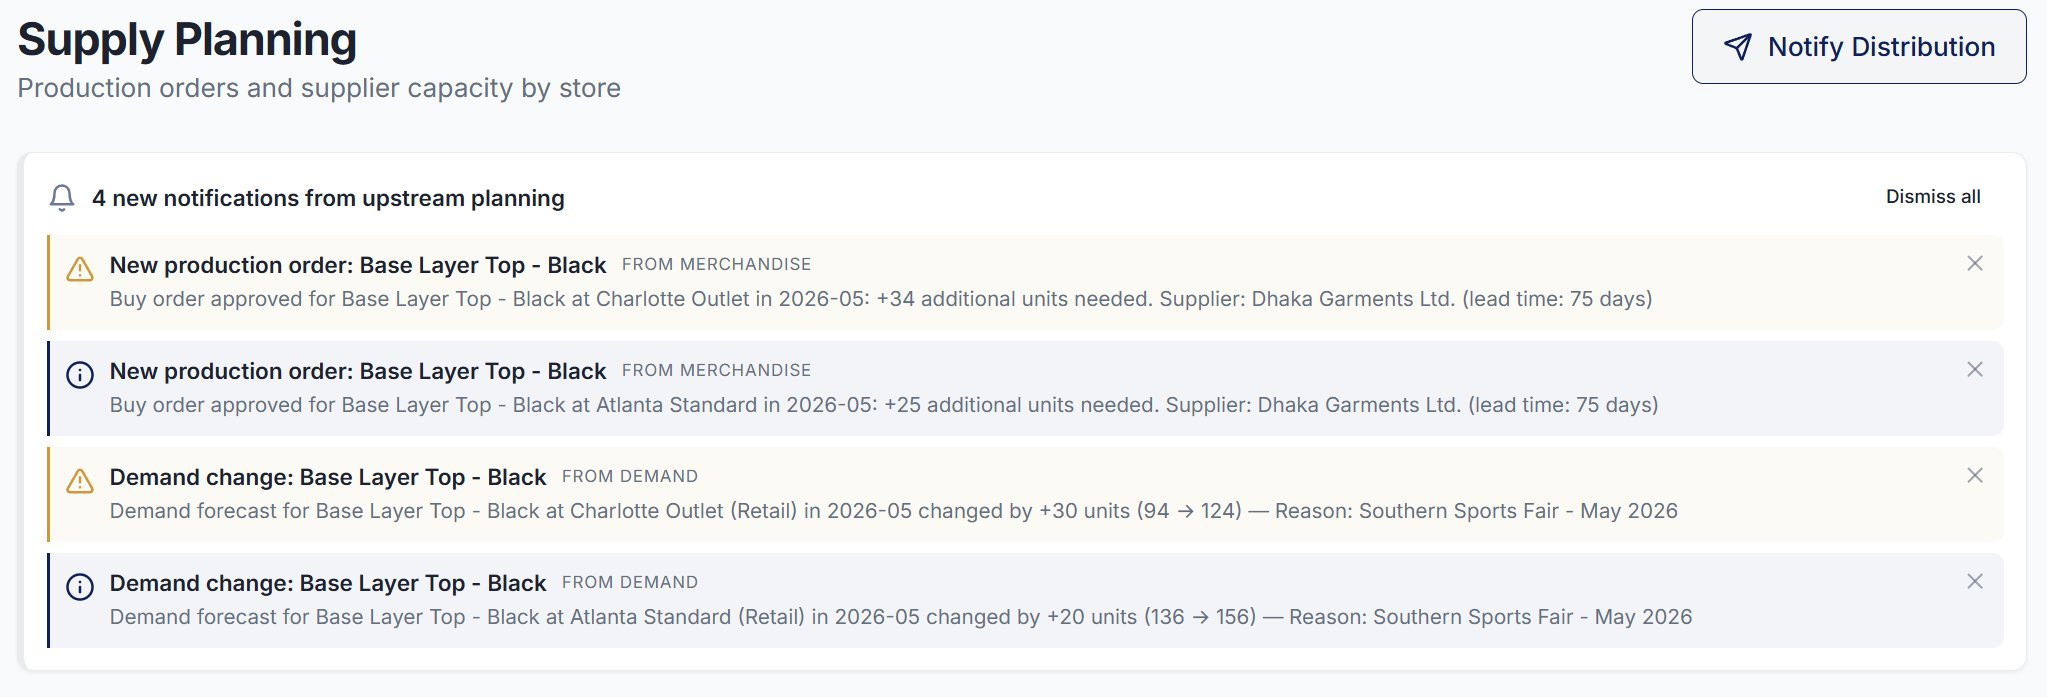
The same notification is waiting for her informing her that:
- Sarah updated the demand forecasts for the two stores
- Marc created new buy orders reflecting this change
And she can find below two additional production orders created.
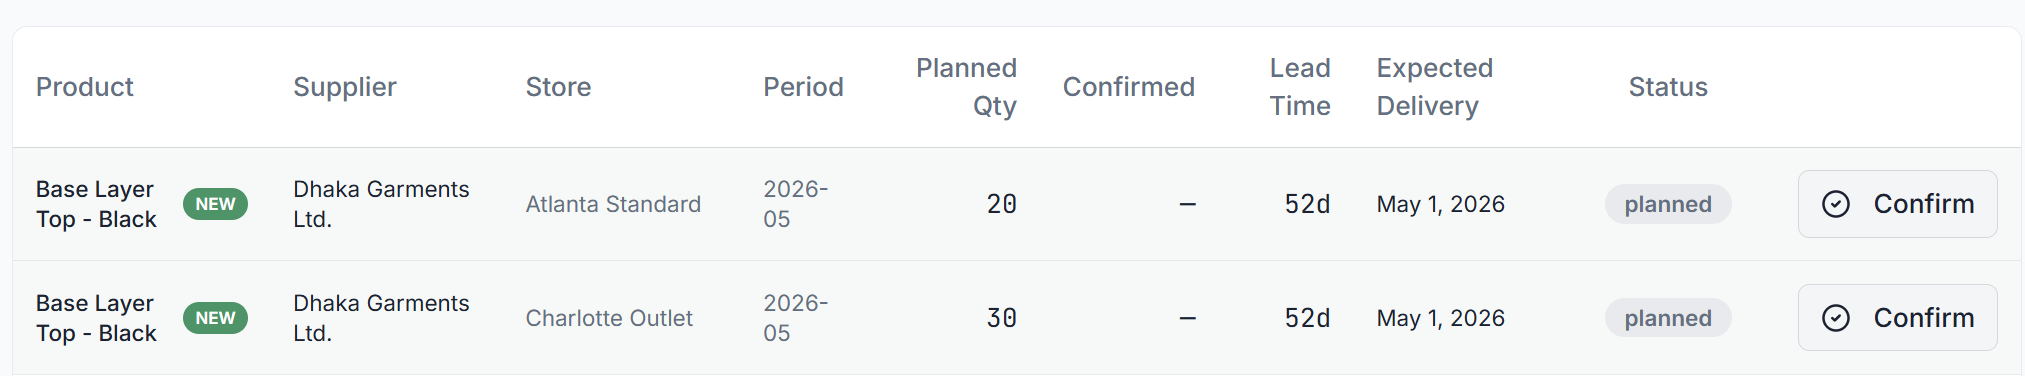
Unlike in the previous scenario, they are now expected to be delivered on time (May 1st, 2026).
If Li Wei confirms them today, the stores will be ready for the campaign!
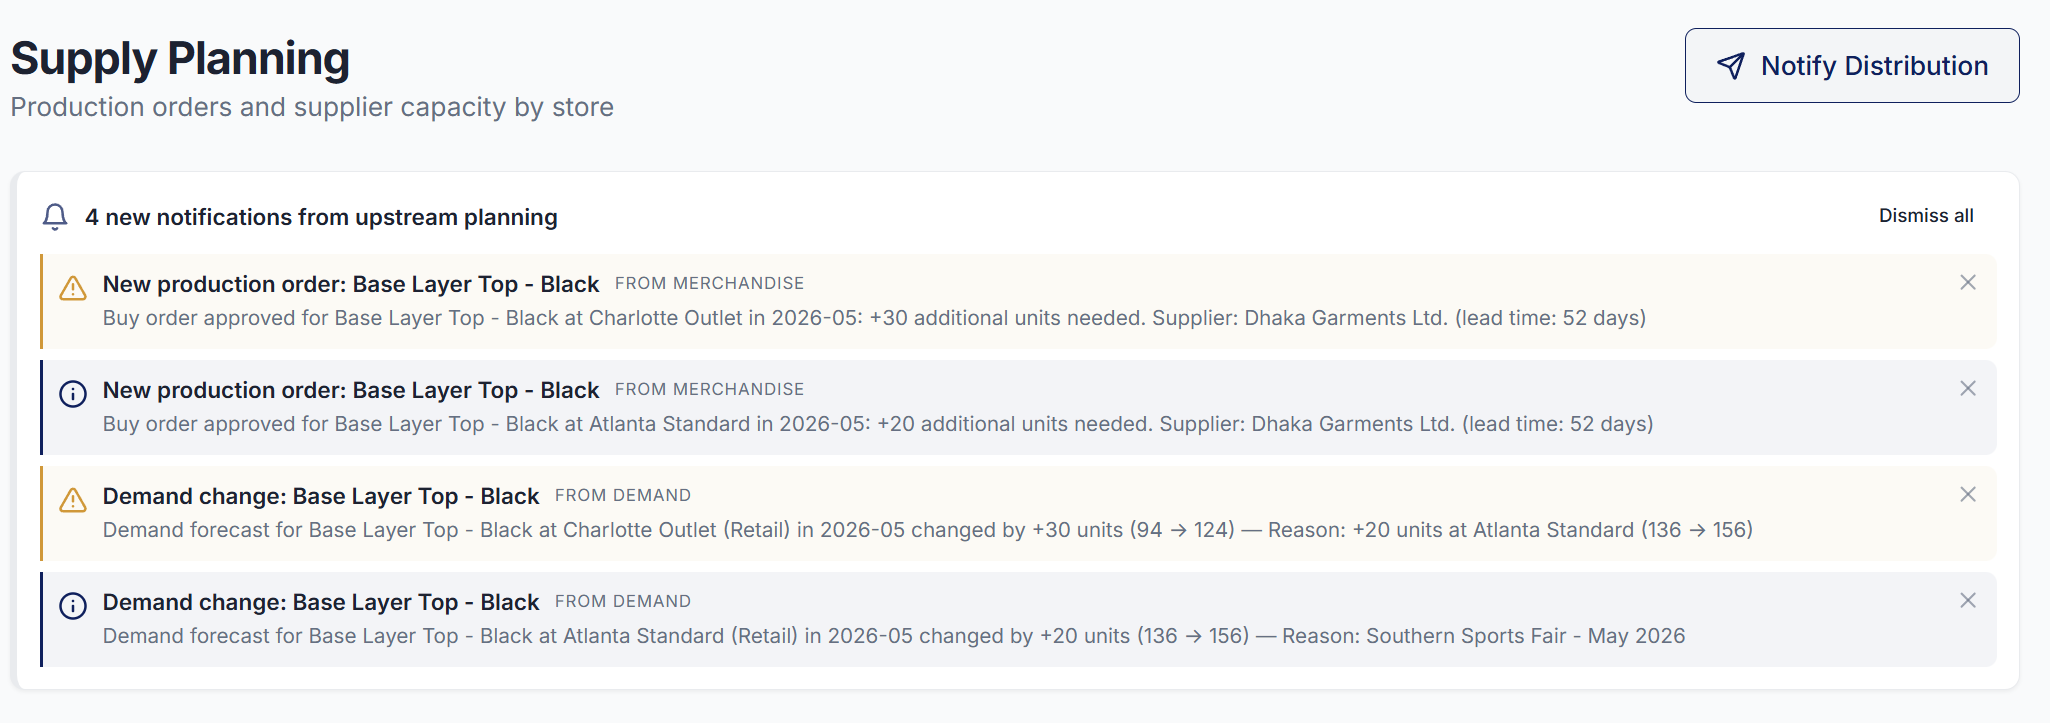
She just has to press Notify Distribution, so the logistics team are informed about these additional shipments.
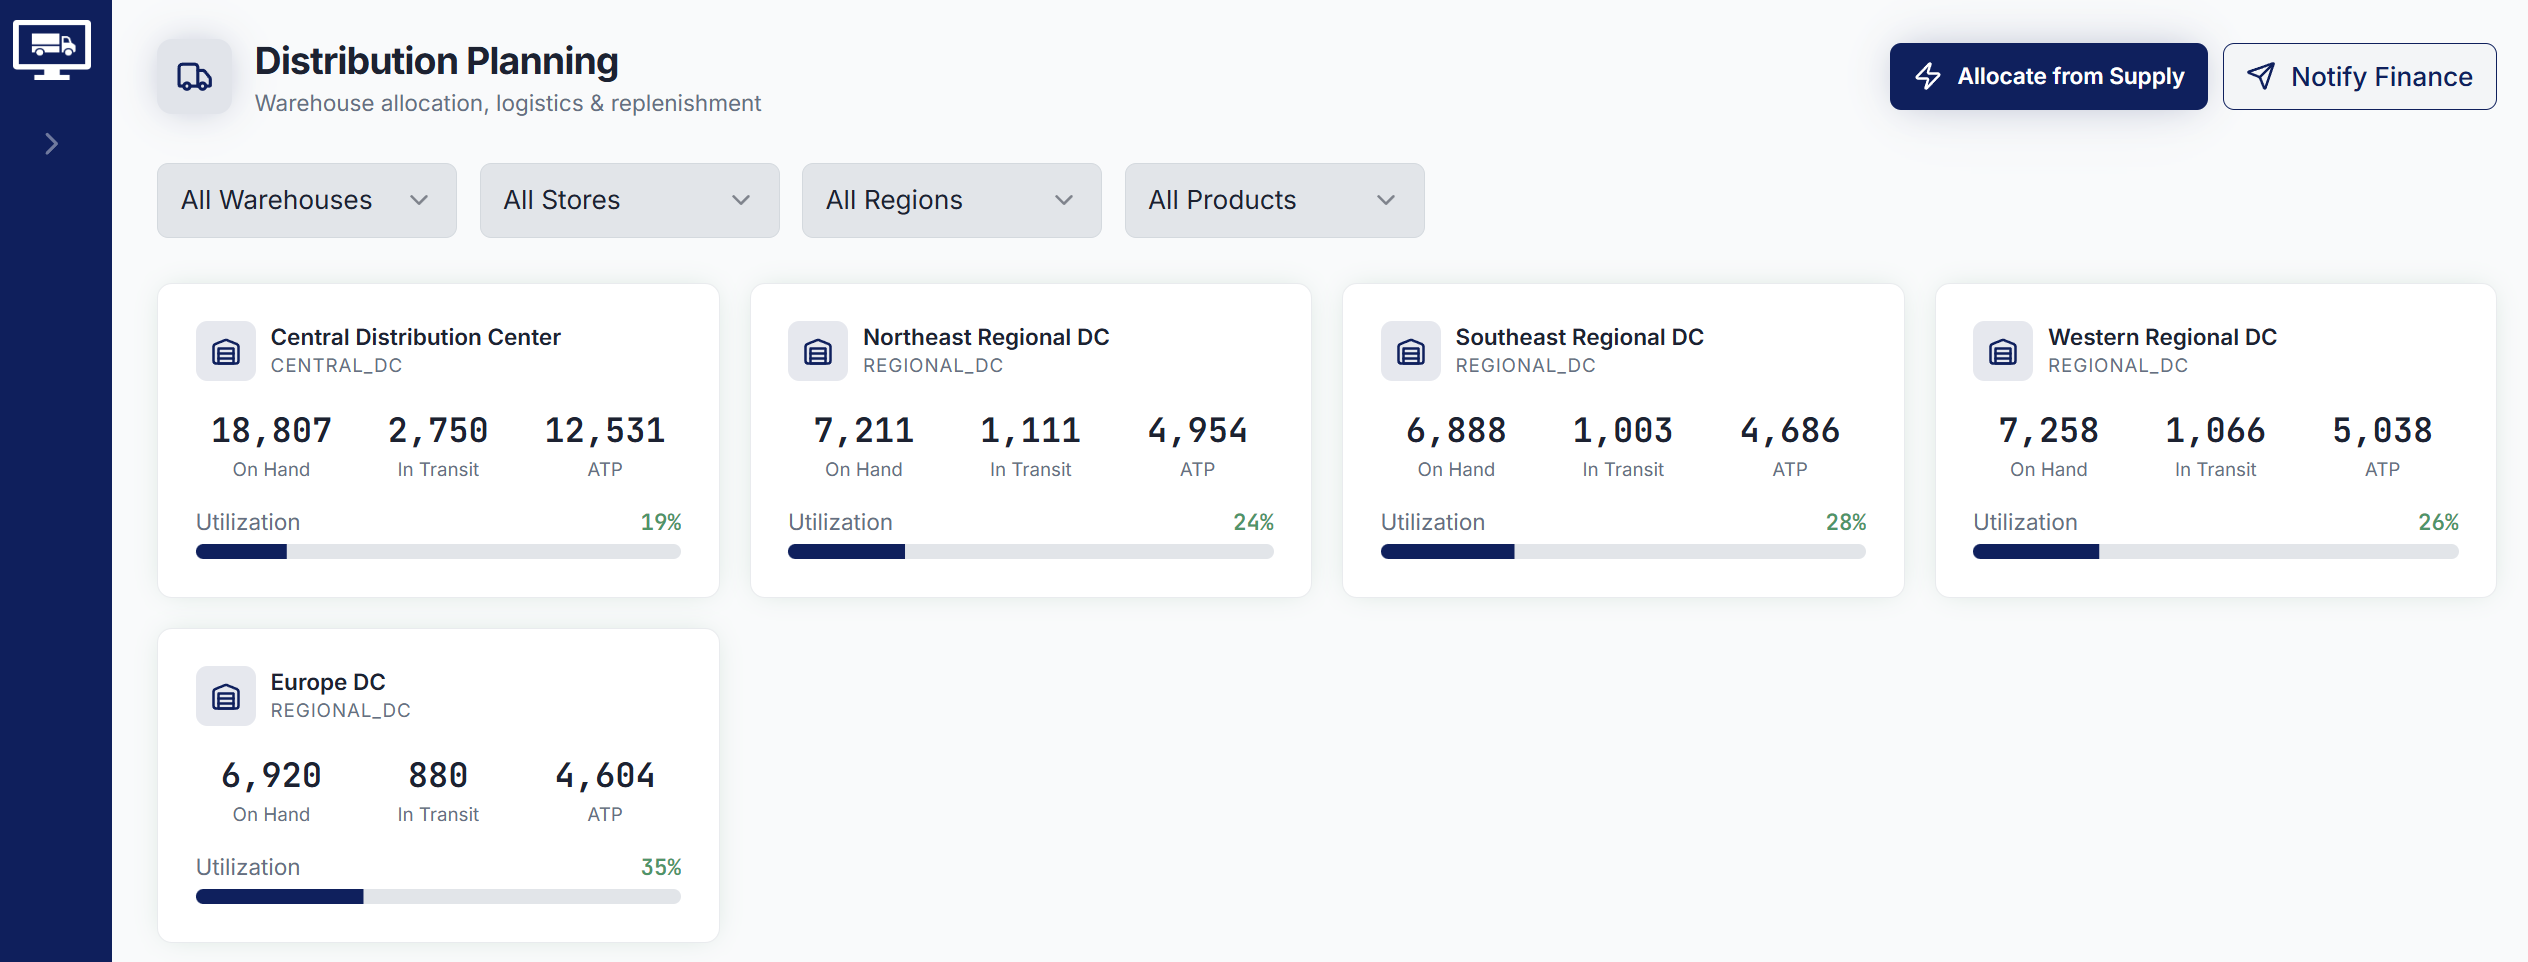
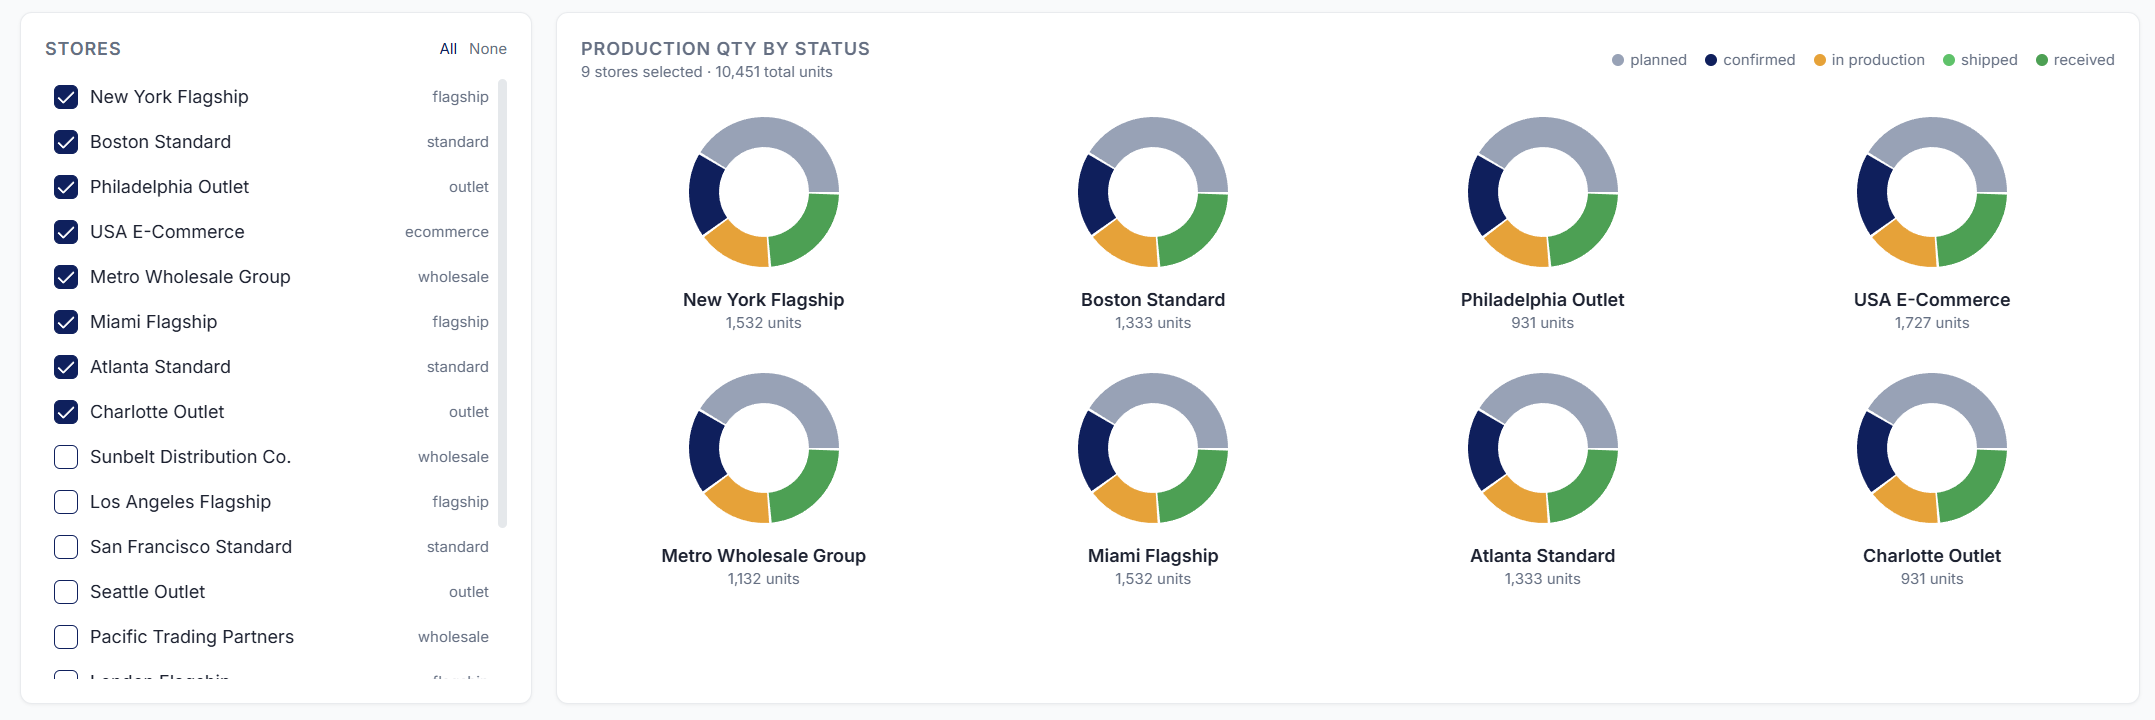
Timeline - Day 1, 05:30 pm: Omar Hassan, our distribution planner, receives a notification
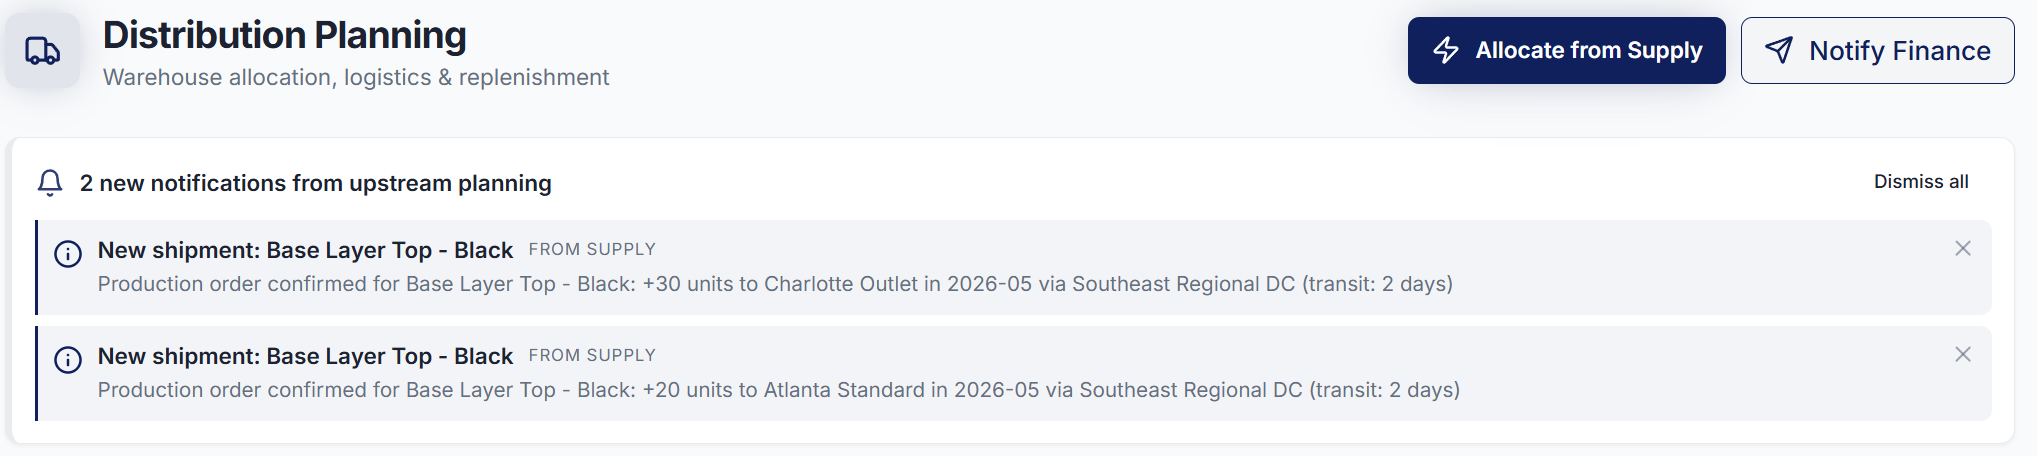
He is notified about the two new factory orders created by Li Wei.
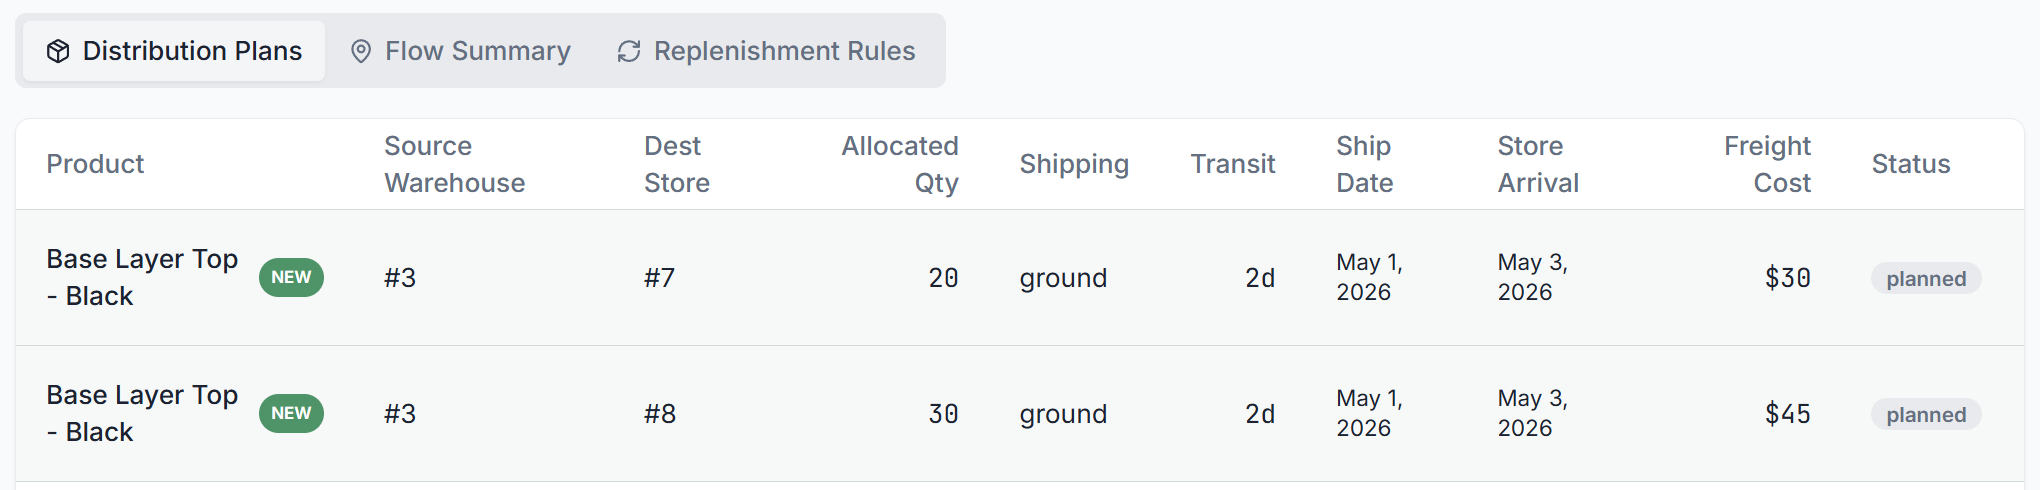
And two additional orders have been created, with a status of planned, to make sure that the finished goods received from the factory are transferred to the store.
Result of a completely integrated platform
Four teams aligned in a single working day, from demand forecast to distribution planning, without a single email, meeting, or re-typed number.
Because the cascade reached Li Wei on Day 1, the production order goes to Dhaka with the full 52-day lead time intact.
The product landed at the Southeast Regional DC on May 1st and reached Charlotte Outlet and Atlanta Standard by May 3rd.
Stores were replenished 2 days before customers arrived at the Sports Fair.
Atlanta also gets its +20 units (and avoids potential lost sales) because Sarah's adjustment was never lost in someone else's inbox.
Conclusion
I built SupPlan to simulate the impact of integrated business planning for medium-sized companies that still rely on spreadsheets and emails to coordinate their planning teams.
The SupFashion scenario shows that the problem is not with the forecast model.
It is the time it takes for a signal to travel from one team to the next.
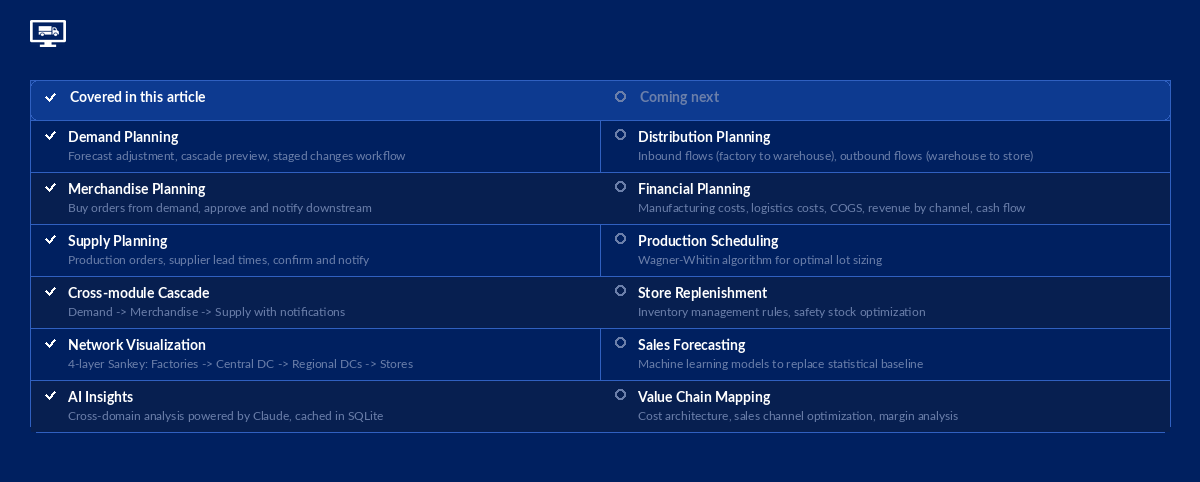
What we covered in this article
The cascade from demand to supply: how a single forecast change propagates through merchandise and production planning, and why lead time constraints make every lost day expensive.
We stopped at the beginning of distribution: Omar receives the shipment notification, but the detailed warehouse allocation, routing, and last-mile delivery logic are not yet implemented.
What comes next
SupPlan is a foundation for testing optimisation algorithms designed by my startup LogiGreen, introduced in previous articles:
- Production Scheduling with Wagner-Whitin for supply planning and manufacturing optimisation
- Inventory Management Rules for store replenishment and safety stock optimisation
- Machine Learning for Sales Forecasting to replace the statistical baseline with adaptive models
- Value Chain Mapping for business planning, including cost architecture and sales channel optimisation

Each of these algorithms was designed in isolation. SupPlan is the environment where they come together and where their interactions become visible.
What I will improve
- A complete distribution planning module with inbound flows (factory to warehouses) and outbound flows (warehouses to stores)
- Detailed financial flows: manufacturing costs, logistics costs, COGS breakdown, revenue streams by sales channel, inventory valuation, and cash flow projections
The platform is open-source and publicly available. You can replicate every scenario from this article, change a forecast, watch the cascade, and reset the data when you are done.
Try it now:
About Me
Let's connect on LinkedIn and Twitter. I am a Supply Chain Engineer who is using data analytics to improve logistics operations and reduce costs.
If you're looking for tailored consulting solutions to optimise your supply chain and meet sustainability goals, please contact me.