Why Supply Chain is the Best Domain for Data Scientists in 2026 (And How to Learn It)
My take after 10 years in Supply Chain on why this can be an excellent playground for data scientists who want to see their skills valued.
As we step into 2026, my LinkedIn inbox is full of data scientists reaching out.
Same questions. Same concerns. Is supply chain data science the right move?
After 10 years in supply chain data science, including five years writing on this blog, I have developed strong views on this question.
Supply chain is an exceptional playground for data scientists.

Rich problems, beautiful mathematics and tangible impacts.
But I'm not here to tell you what's best for your career.
In this article, I want to give an honest view of the opportunities that excite me and the challenges that frustrate me.
More importantly, I will show how to explore this domain yourself using the tutorials and case studies shared across this blog.
You can then test yourself to see whether supply chain analytics resonates with you.
Why do we need Supply Chain Analytics?
What is a Supply Chain?
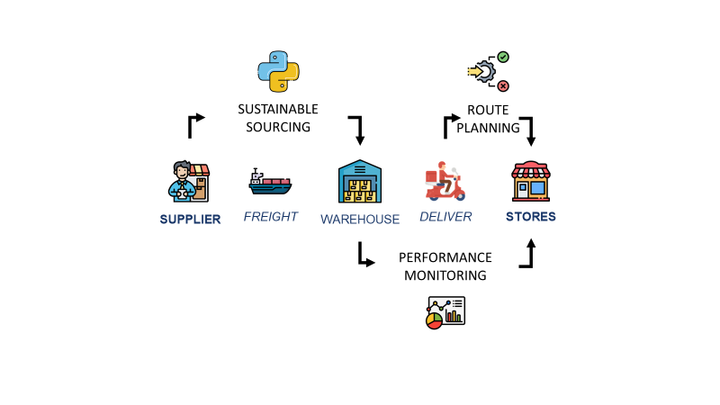
A Supply Chain is usually defined as several parties exchanging flows of material, information or monetary resources with the ultimate goal of fulfilling a customer request.
Factories, warehouses and planning teams use systems to communicate and exchange information.
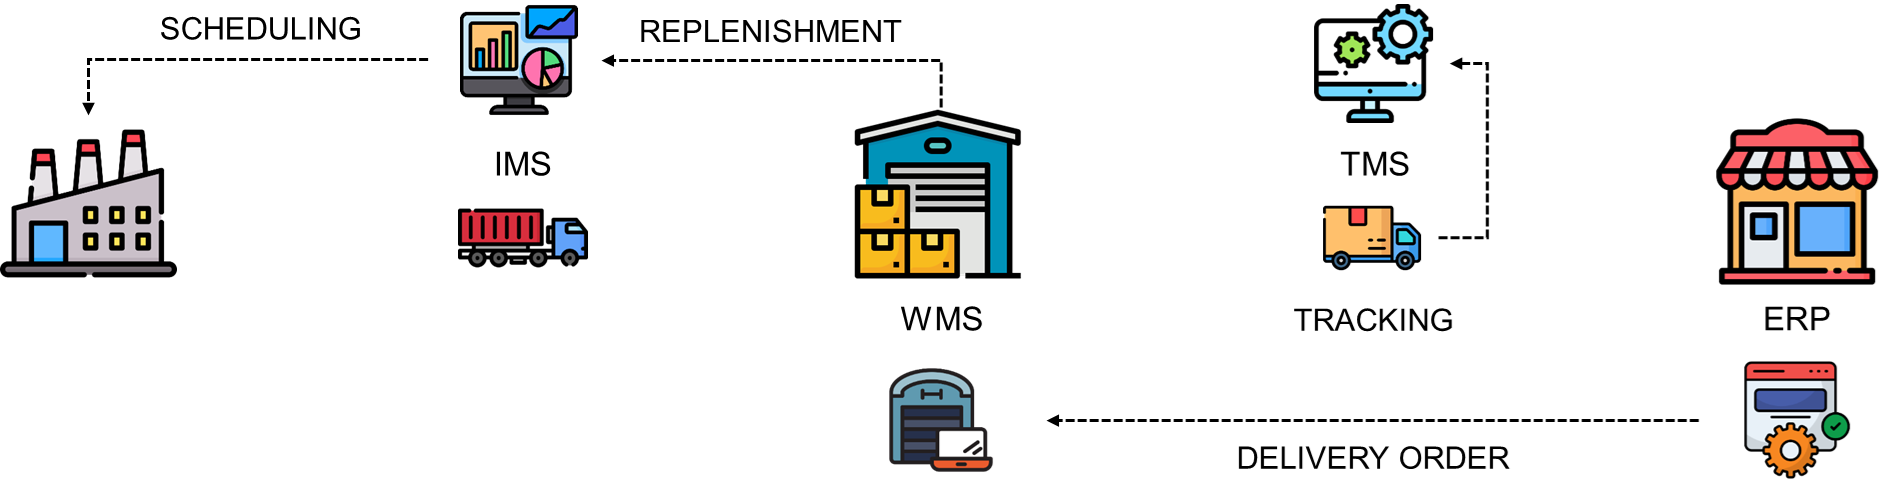
These systems store a large amount of transactional data in databases that reflects the activity of your entire supply chain.
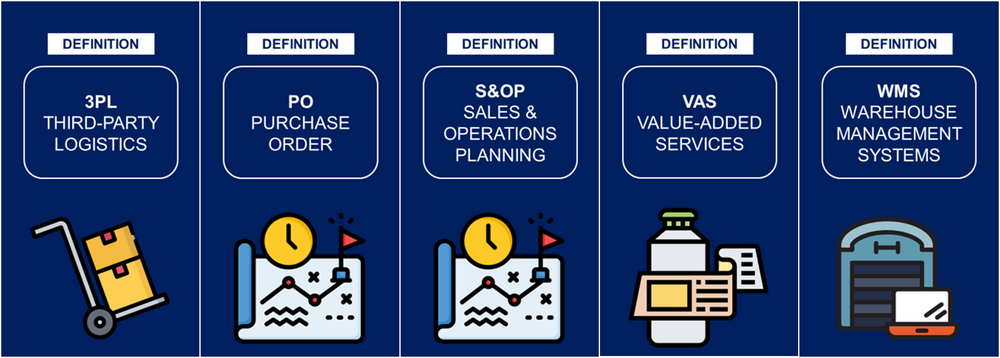
- Warehouse Management Systems (WMS) store all the inbound (flows coming to the warehouse) and outbound (flows leaving the warehouse) transactions.
- Enterprise Resource Planning (ERP) systems can store all the purchase orders (to suppliers) and invoices (to customers)
- Transportation Management Systems (TMS) will record all the shipments leaving the warehouse and notify you when they are delivered.
As it is impossible to track each shipment across the supply chain, these data remain the only way to monitor your operations.
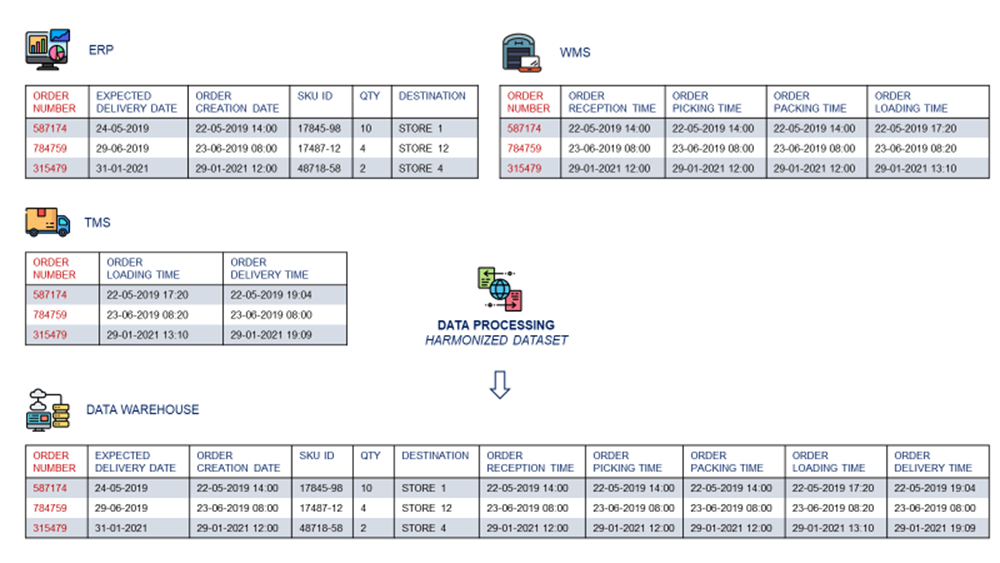
Therefore, Supply Chain Analytics has emerged as a methodology that organisations use to gain insights from data associated with all processes within the value chain.
We need to exploit this data, but for what?
Descriptive Analytics: Bring Visibility to Operational Teams
Yes, this isn't machine learning or advanced optimisation yet.
But it's where most supply chain analytics journeys begin, and where you can deliver immediate value!
I discovered in my first years as a Supply Chain Solution Designer that operational teams were drowning in data but unable to see patterns.
They know something went wrong, but they can't explain why.
Operations manager: we don't manage to increase our capacity of orders prepared per day and we don't why!
In a warehouse storing products for a cosmetics retailer, I was asked to support the reengineering of operations to increase e-commerce capacity.
Around November 11th, you have a huge e-commerce festival in China during which volumes are multiplied by ten.
Operations manager: we recruit more operators but it does not impact the capacity.
To find the root cause, I decided to go on-site and observe a shift during peak hours.
And I quickly observed that many operators were packed in some alleys of the warehouse waiting for their turn to pick products.
I assumed that was probably the root cause, but I needed a way to prove that and communicate it to the operations manager.
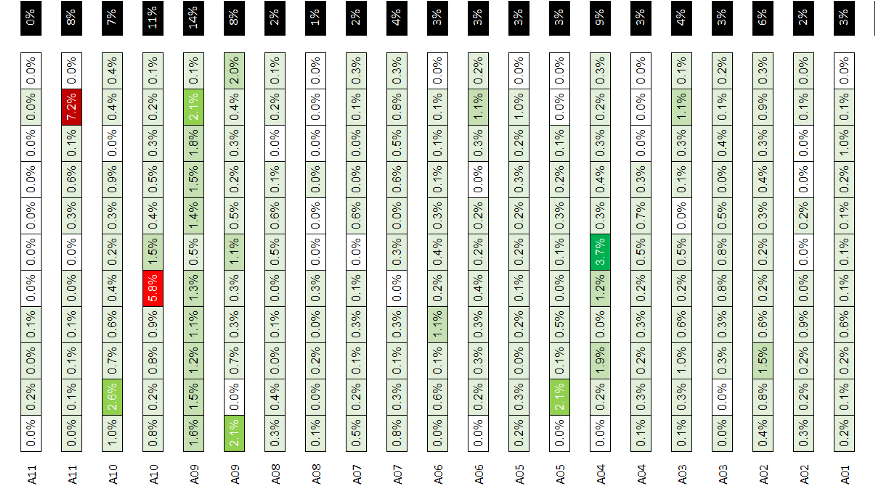
With this heatmap, showing the percentage of orders per storage location, we unlocked the situations by quickly understanding the root cause.
They knew that some areas contained high rotation SKUs, but not to this extent.
Operations Manager: we must spread the high rotations across the warehouse to avoid congestion.
This simple visualisation, which I learned from EDAs in Kaggle, was the beginning of a more complex optimisation study that I documented in this series of articles.
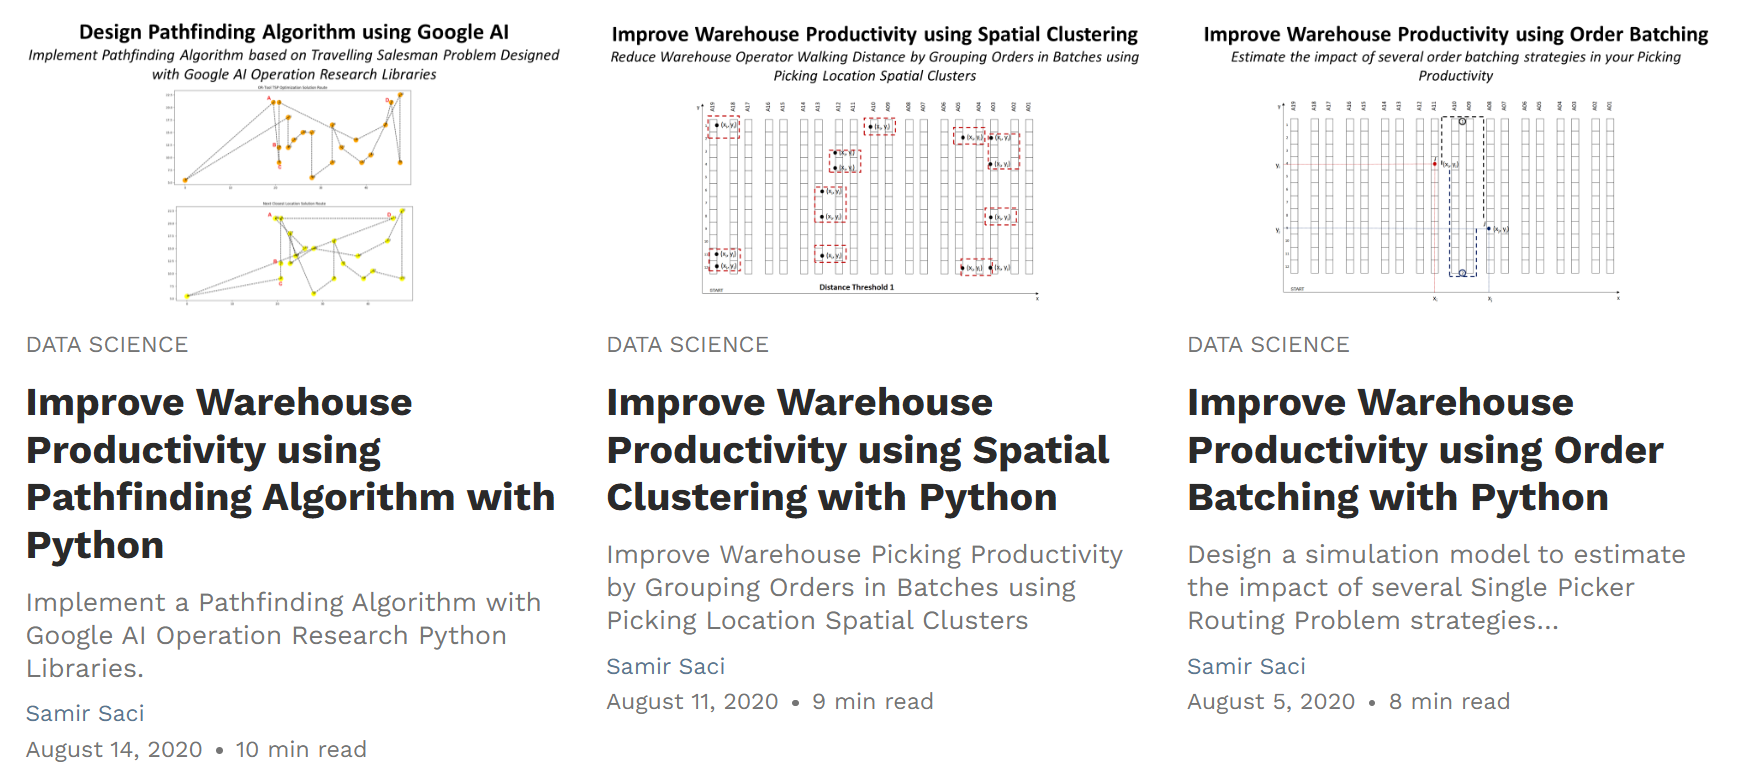
Even if this isn't deep learning or complex optimisation, never underestimate the value of the proper visualisation solving the right operational problem.
The reengineering study that started from this simple visual helped us to renew the contract with this customer and earn several million euros.
What if you want more technical challenge?
Diagnostic Analytics: Data supporting Root Cause Analysis
We can now step up the technical complexity.
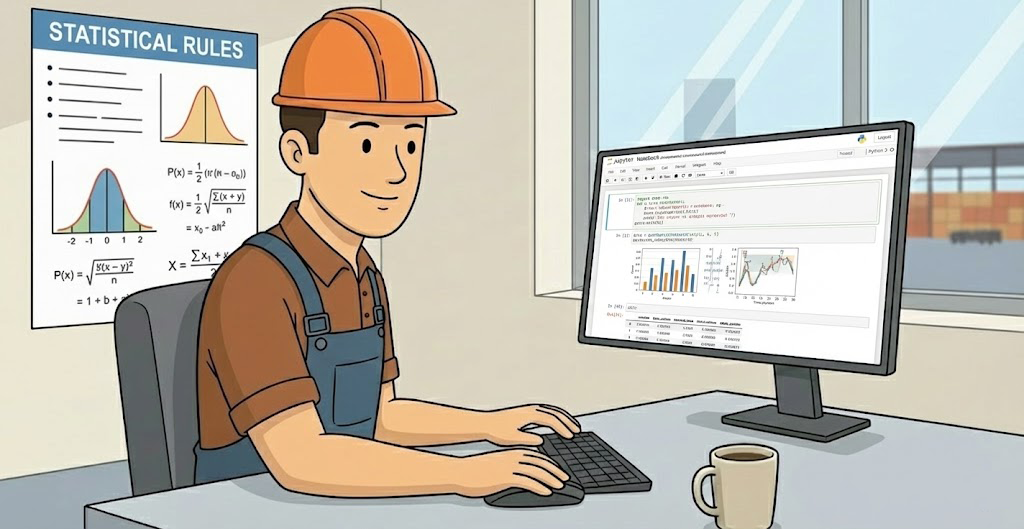
Let me introduce a methodology that became my favourite playground for supply chain data science: Lean Six Sigma.
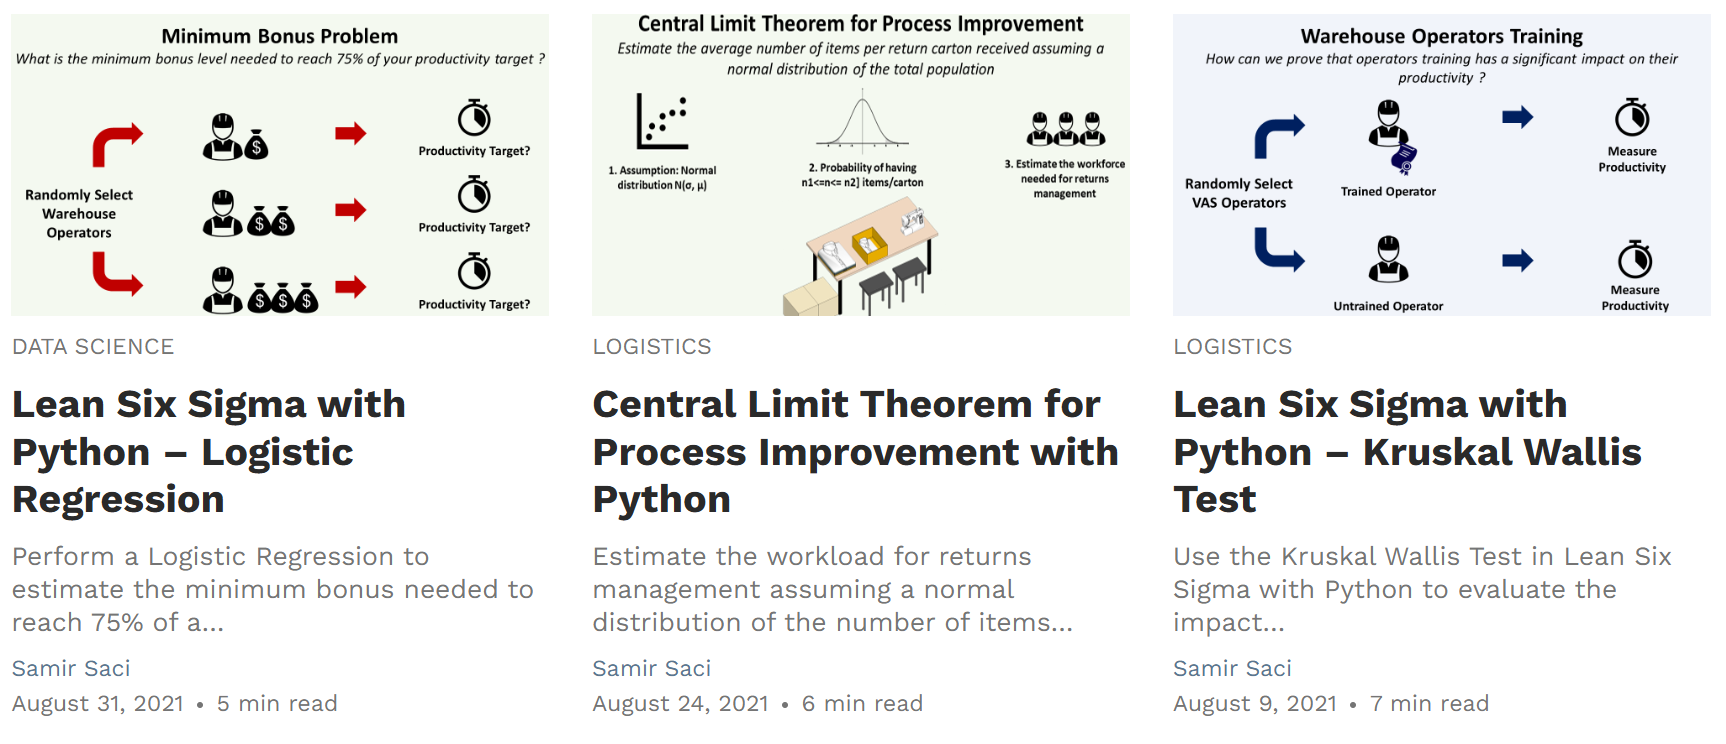
Lean Six Sigma is a step-by-step approach to process improvement that uses statistical tools to validate assumptions.
Why Lean Six Sigma? Because it forces rigour through statistically backed assumptions.
Operations teams make assumptions daily that are most often based on their experience, but rarely on data, as they're too deep in the day-to-day management.
We can support them with statistics using the Lean Six Sigma approach.
I first used this approach for a project supporting the transportation team of a factory in North America.
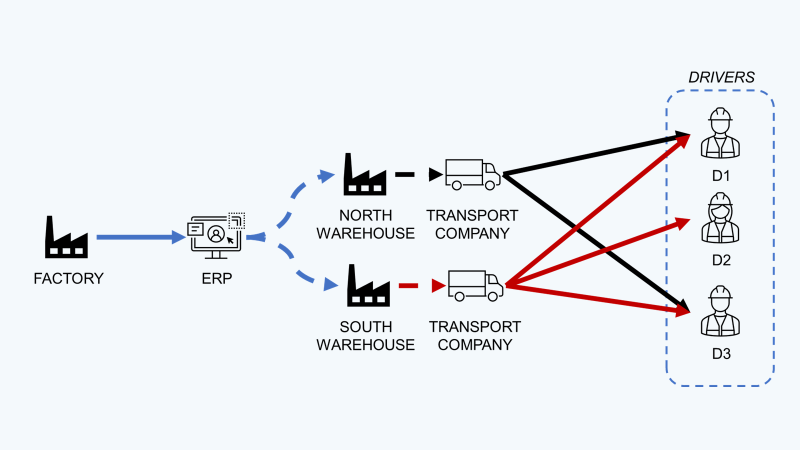
The Inbound Transportation Manager received products from two different routes.
- Route 1: with difficult road conditions and heavy traffic
- Route 2: with no traffic and a beautiful modern road
An external service provider allocates the shipment to a pool of drivers (D1, D2, D3).
What's the problem?
When an order is allocated to the northern regional hub, the lead time for the request to be accepted is 35% higher than at the southern hub.
Transportation Manager: We assume that drivers avoid as much as possible to be allocated to the north route.
Before jumping to conclusions (and starting a conflict with drivers), we decided to analyse the past shipment confirmations.
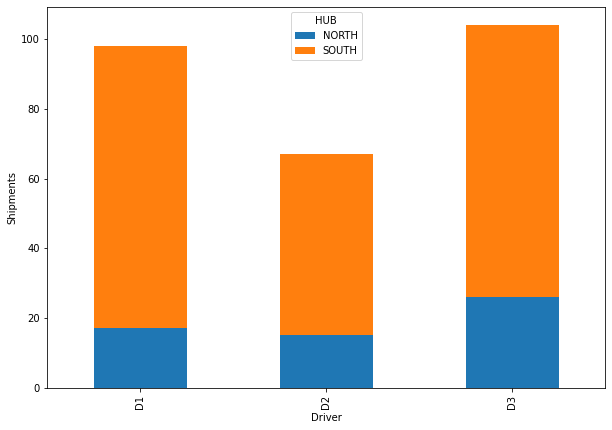
We used cross-validation and the Chi-Squared test to show that there is no significant proof that the driver’s allocation is linked to the Hub.
This helped the team to investigate other potential root causes to solve the problem.
For more details about the approach (and examples with source code), you can have a look at these videos:
- Lean Six Sigma with Python | Kruskal-Wallis Test
- Lean Six Sigma with Python | Logistic Regression
- Lean Six Sigma with Python | Chi-Squared Test
With these descriptive and diagnostic tools at hand, you can find the root cause of most operational issues in warehouses, factories, and planning teams.
- Why do we have a drop in productivity with this shift of operators?
- Why are there +20% picking errors in this area?
- Why do we have an additional day of lead time in this specific freight road?
Answering these questions with statistically backed methodologies can help teams implement action plans.
Can we support these action plans with data-backed prescriptions?
If we summarise what we've seen so far, in the continuous improvement journey, you can
- Help to identify the problem with a carefully chosen visualisation
- Use statistical methods to find the root cause
It is time now to provide solution-oriented insights to support operational improvements.
Prescriptive Analytics: Optimisation for Decision Making
The idea here is to solve an optimisation problem.
We want to maximise or minimise a specific objective function (e.g., procurement cost, number of operators hired, space used, production costs) while respecting particular constraints.
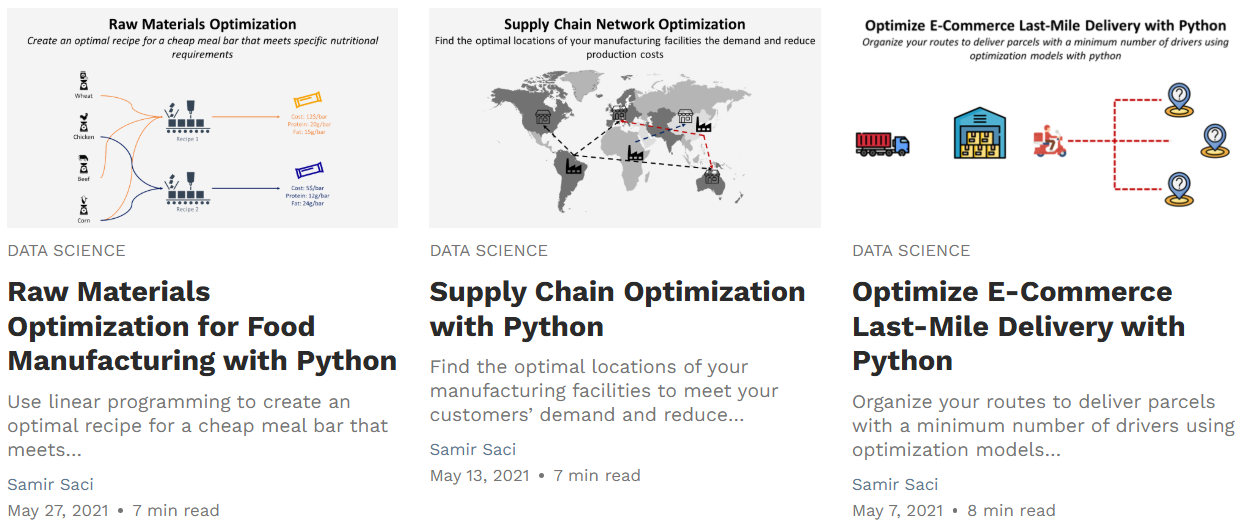
In this blog, you can find dozens of examples using linear and non-linear programming to optimise a specific process.
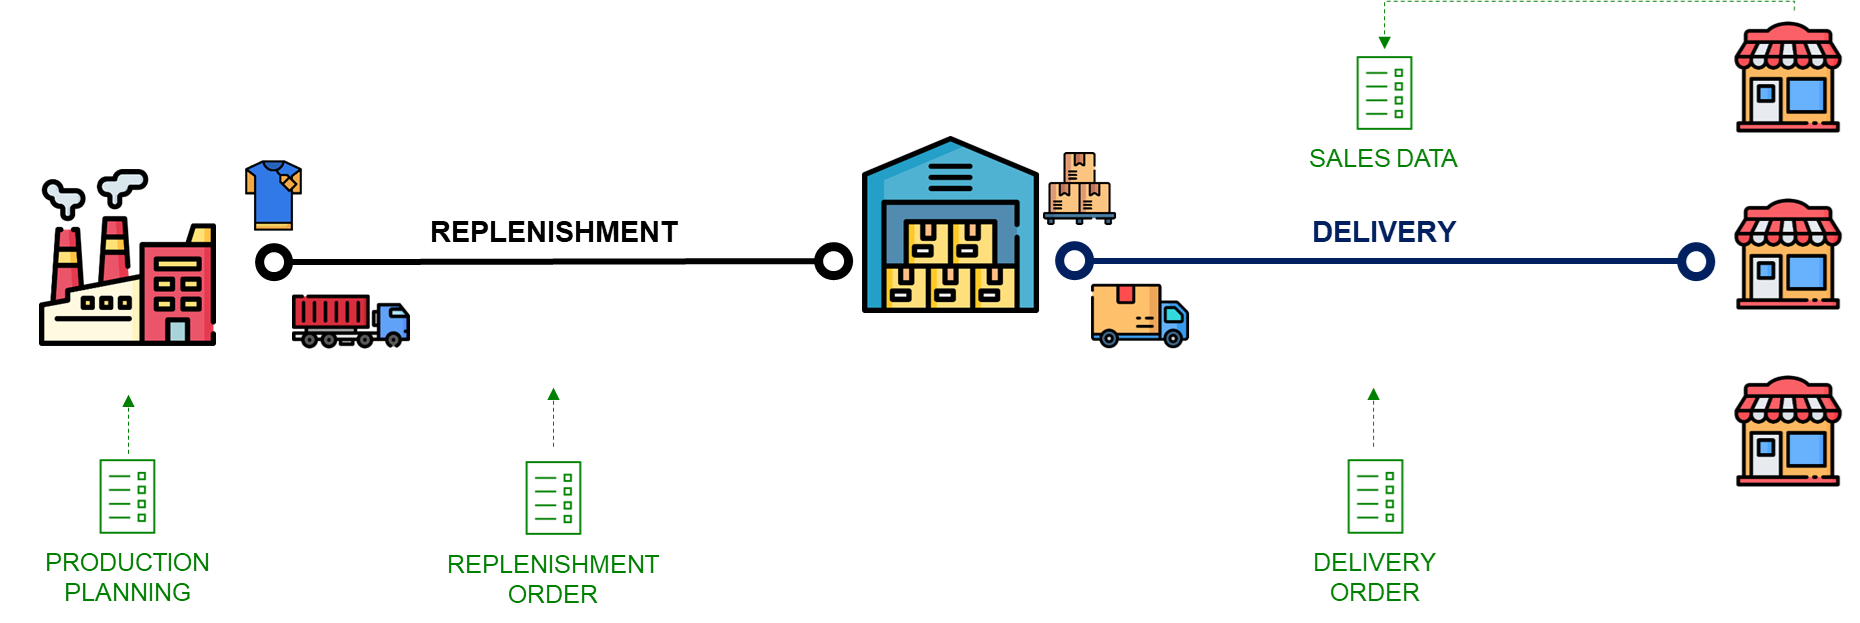
I will use the Supply Chain Network Design problem to illustrate the challenges you may face when conducting this kind of study.
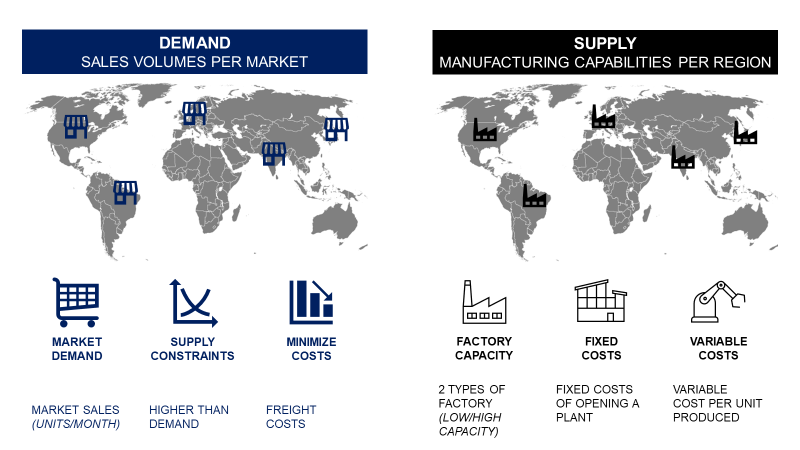
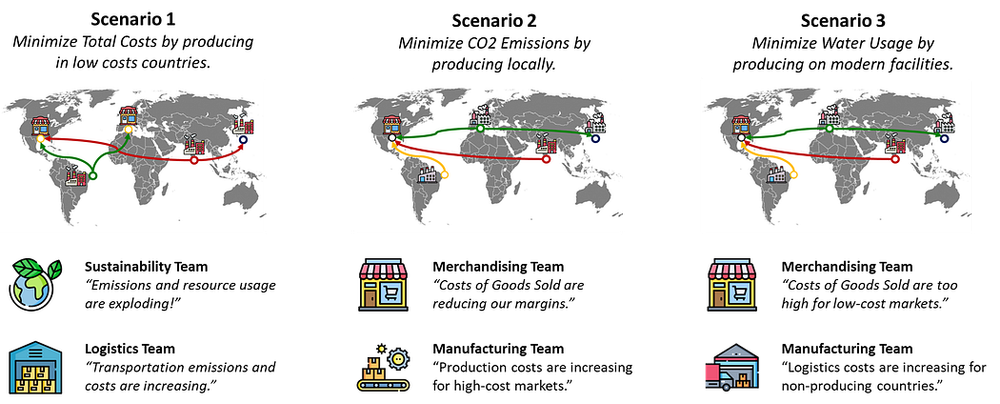
A multinational company with markets and factories in different countries would like to redesign its supply chain network to reduce costs and environmental footprint.
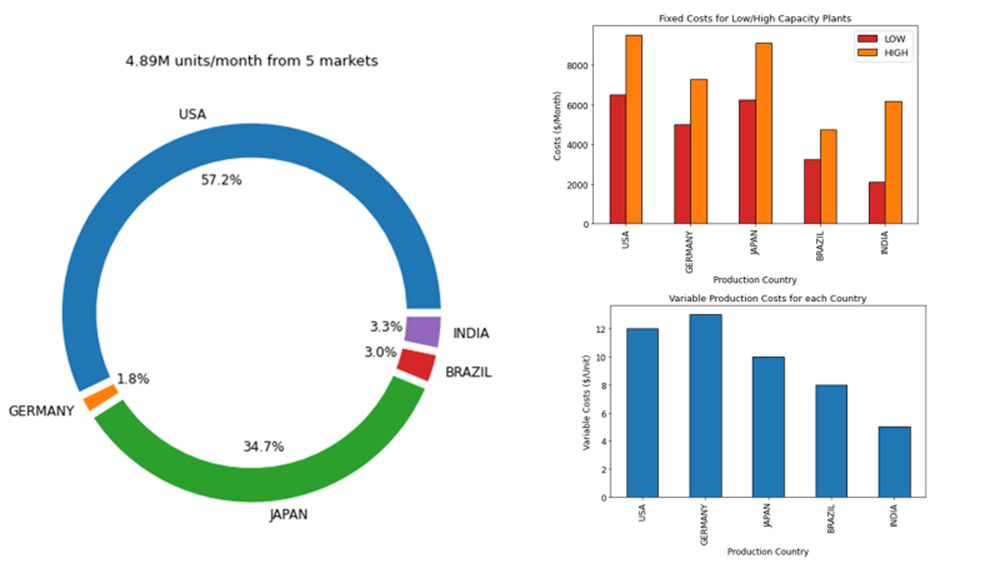
Their supply chain director expects you to tell them where to open factories to minimise the overall production cost.
These are the decision variables in your optimisation model that you can build using the Python library PuLP.
I faced many issues collecting input data and fixing the objective functions.
What are the challenges?
Indeed, most of the time, the problem is never stated fully and comprehensively.
For instance, in a project for a fashion retailer, it took us weeks to finalise the objective function.
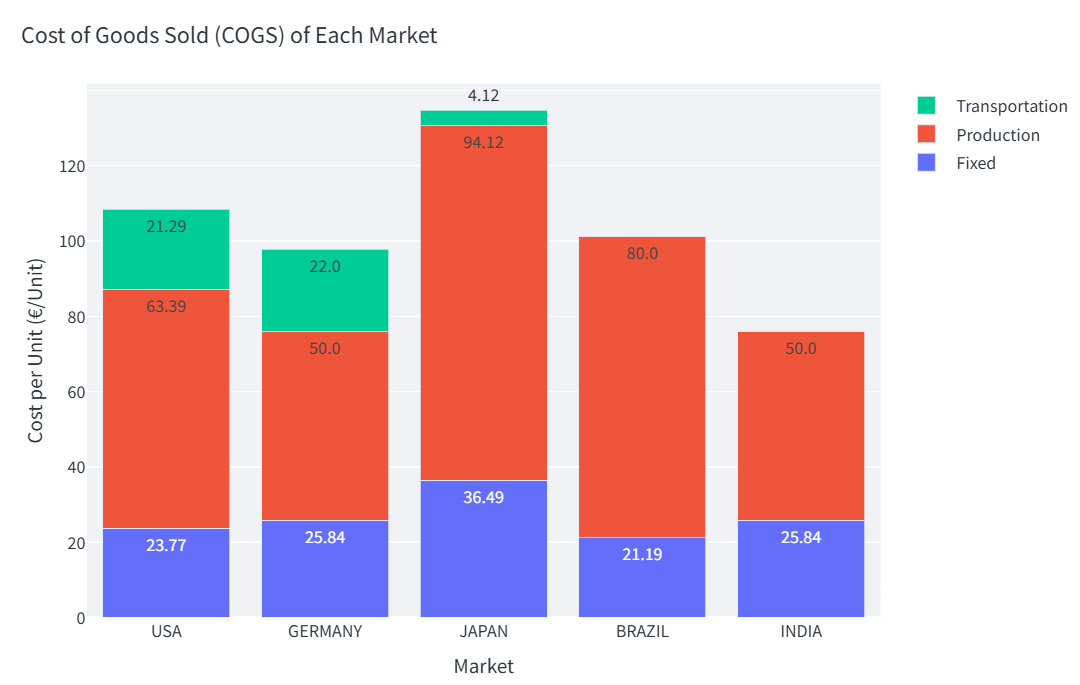
Indeed, after presenting the initial results, we noticed that the objective of reducing the overall production cost (across all countries combined) can affect markets through the Cost of Goods Sold (COGS).
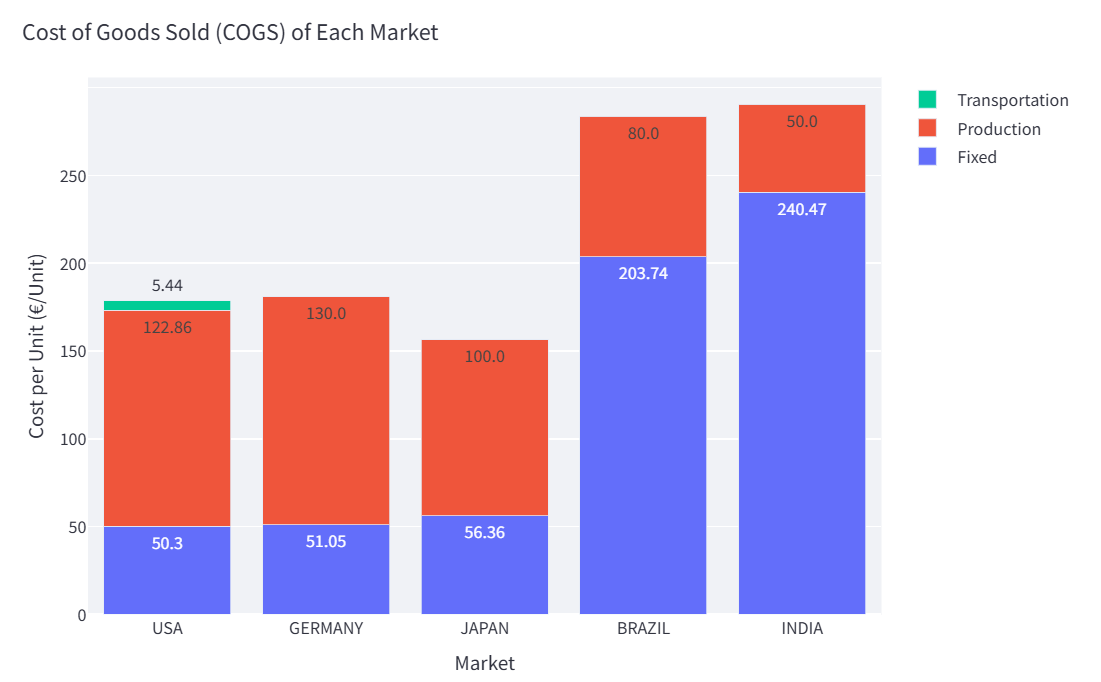
You cannot have scenarios in which it's more expensive to produce in India than in the USA.
This is where I had the opportunity to support the customer in adjusting their business and operational assumptions, drawing on my understanding of the model.
These kinds of strategic projects can help you shine with your skills as you directly deal with decision-makers on projects that impact profitability.
Our value-added here is not lines of code, but bridging the gap between business aspects and optimisation levers.
For more details, I explain in this video how I use AI with Claude connected to an MCP server to solve this issue:
To achieve this, you need a basic understanding of the operations coupled with your data science skills.
I have some content for that.
What do you need to start?
The biggest issue I saw when managing analysts and data scientists on analytics projects was their limited understanding of operations.
This creates a trust deficit.
Operations teams may see data scientists as people who've never set foot in a warehouse.
You need operational knowledge to succeed in supply chain analytics.
Not to become an expert. But enough understanding to communicate effectively, frame problems accurately, and design solutions that actually work in practice.
This means learning the basics: how warehouses and factories operate, how transportation networks function, how inventory flows through a supply chain.
Here's where to start.
Learn Supply Chain Processes with 5-min Explainer Videos.
In this playlist of 40+ short explainer videos, I share a condensed version of my 10 years of experience as a solution design manager and as a logistics performance manager.
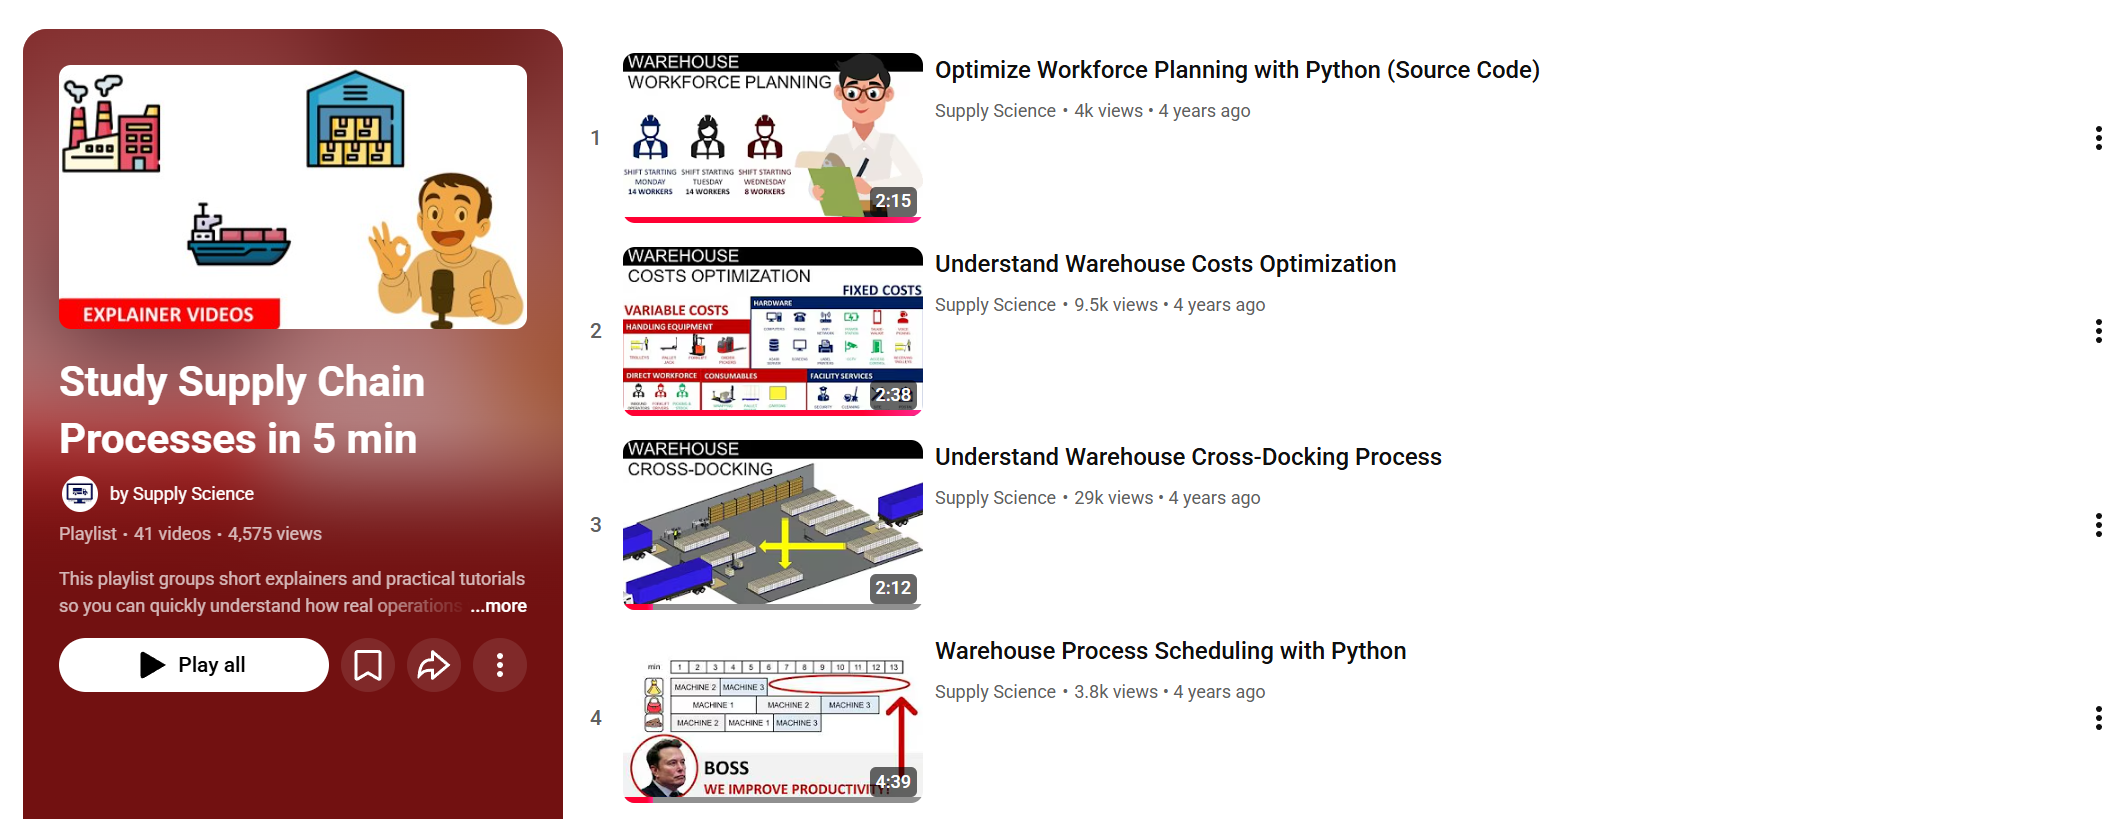
It starts with the basics of warehousing and transportation operations.
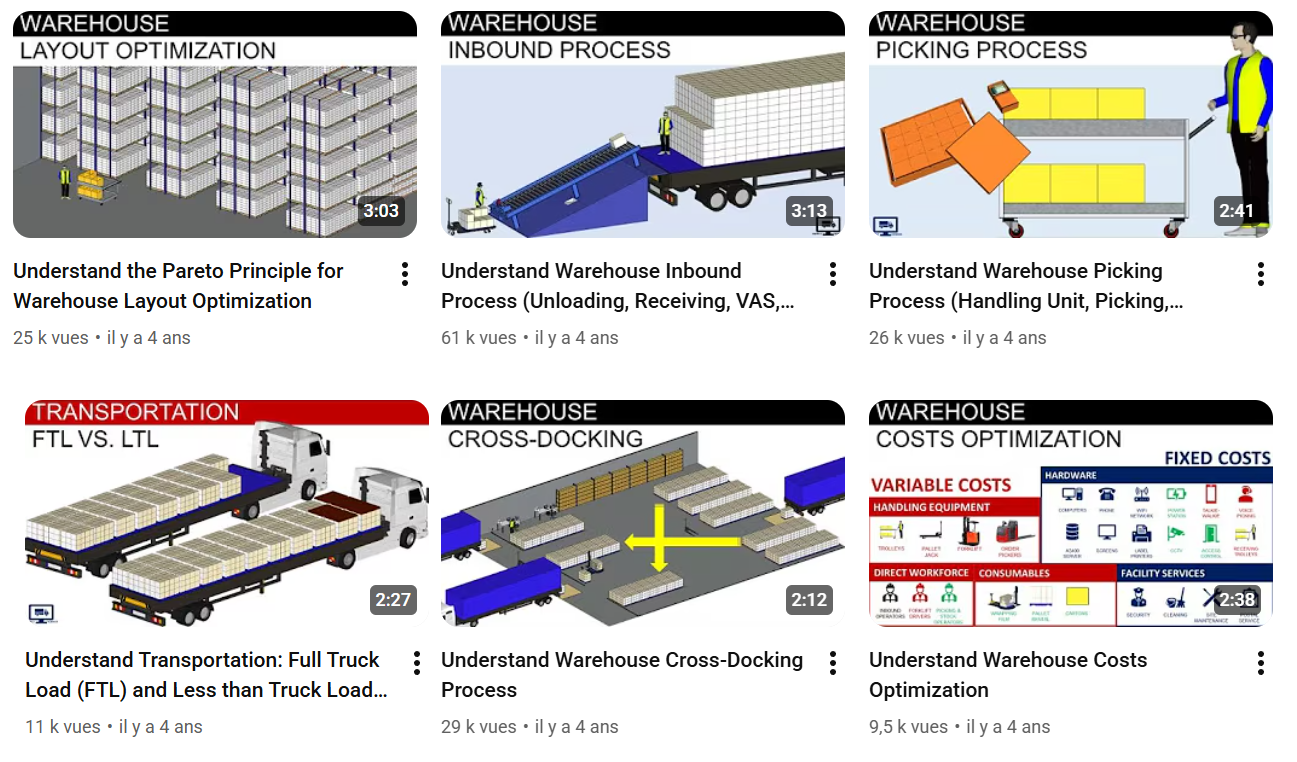
These videos will give the basics to understand:
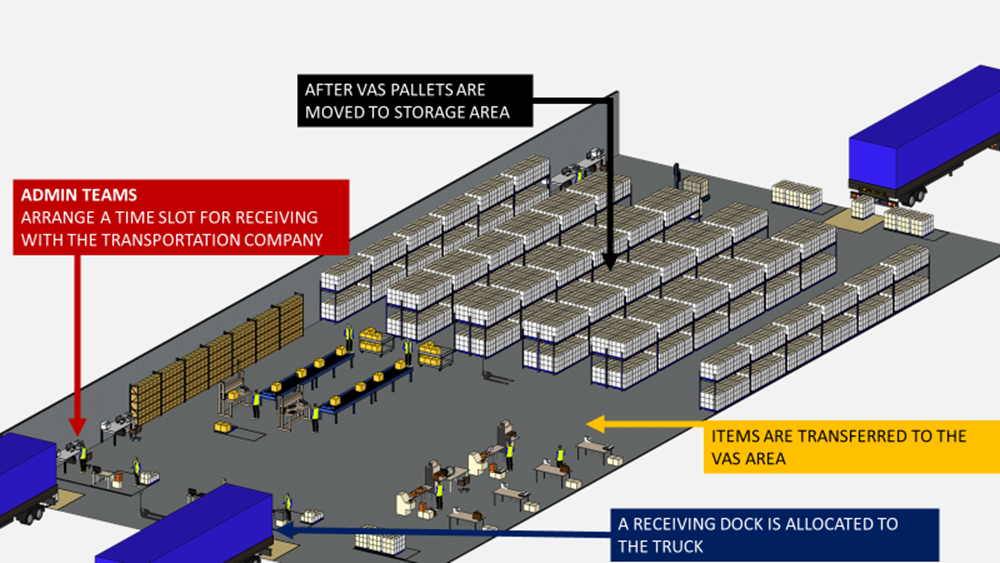
- Warehouse processes: receiving goods (inbound), storage of goods (inventory) and shipping of goods (outbound)
- Transportation Management: Full Truck Load vs. Less Than a Truck Load, performance indicators and cost structures
The focus is operational and financial, as this remains a key concern in logistics operations and is my primary expertise as a Supply Chain Solution Manager.
These videos will give you the basic knowledge to understand most of the logistics-related case studies presented in this blog.
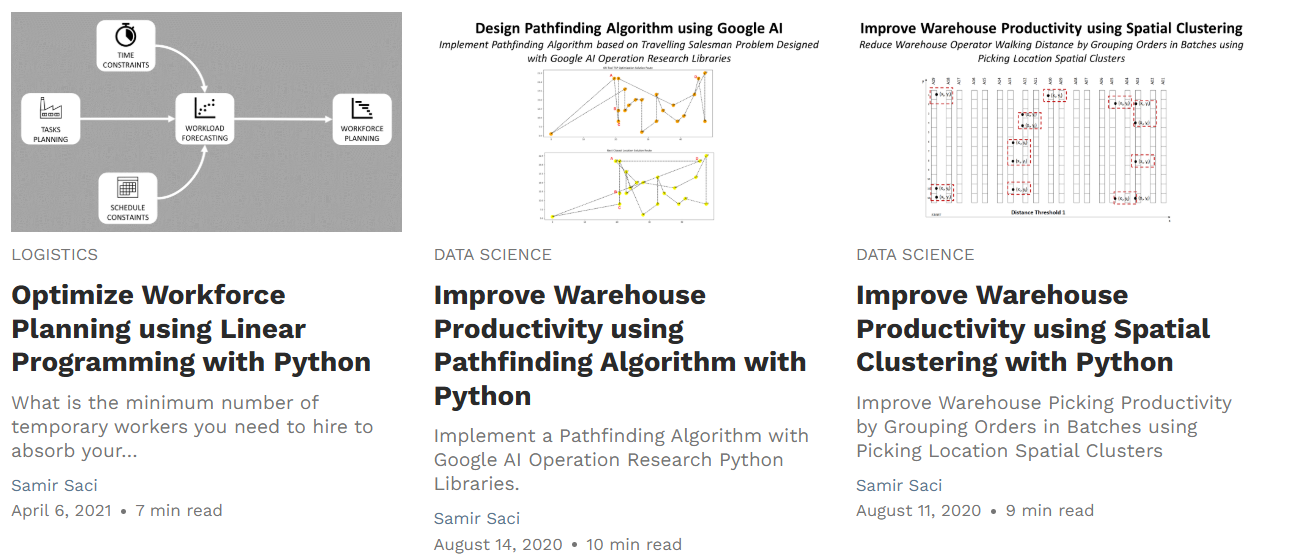
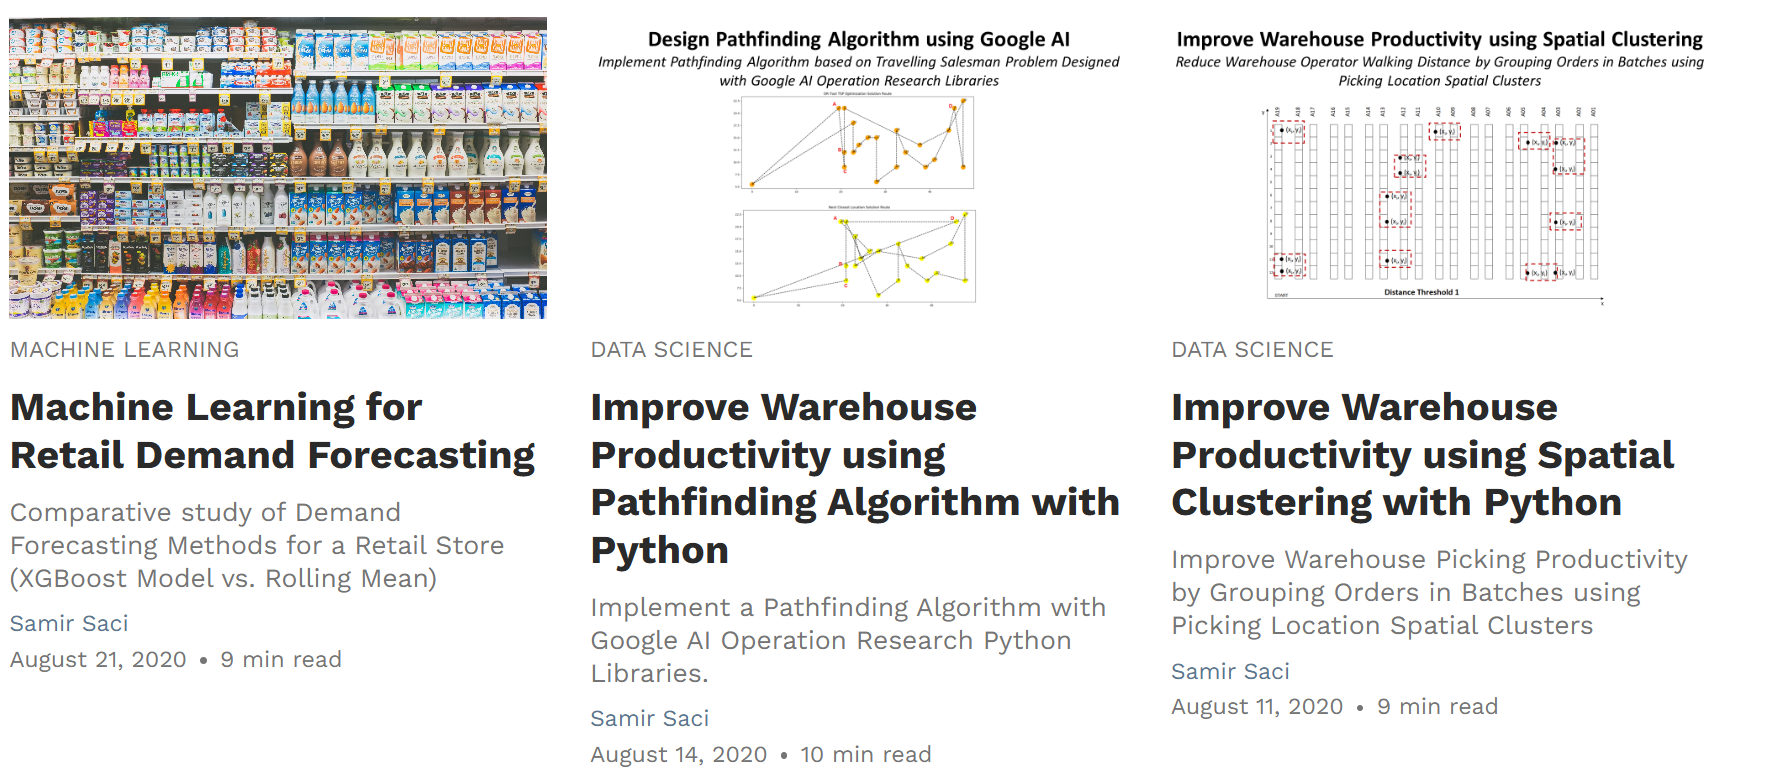
In each of these articles, you can find the solution's source code linked to a GitHub repository and an explainer video summarising the case study.
What can you do with that?
I usually advise playing with the input data, parameters, and scenarios to adapt the solution to your company's problem.
You can be imaginative or ask LLM to generate new scenarios and play around with them.
Do not forget that the objective is to develop your technical skills as well as your operational understanding.
Productise your solutions for better adoption.
In this blog, we want to build solutions that impact operations.
We need to ensure their adoption with a user-friendly deployment.
Therefore, I dedicated multiple tutorials and articles to the productisation of algorithms and visualisations.
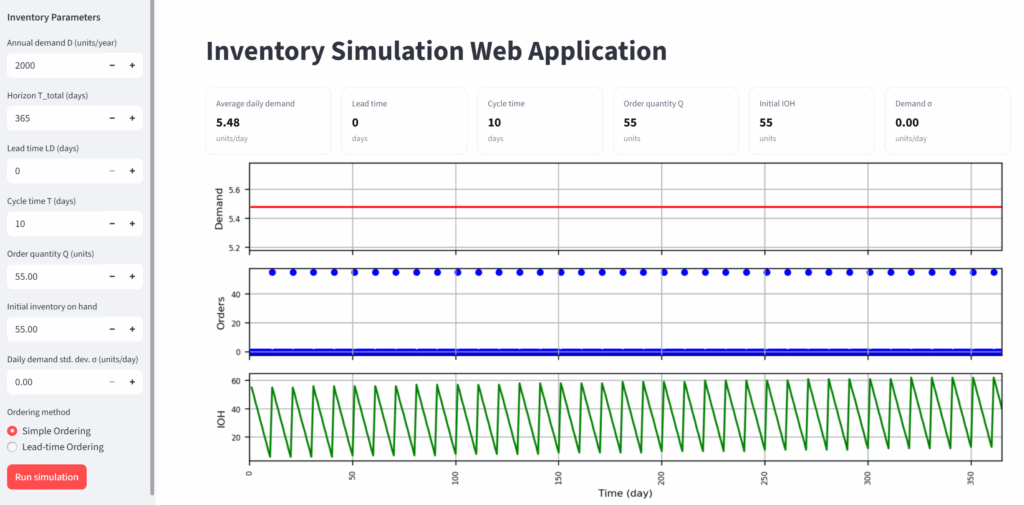
In my last article, I showed you step by step how to deploy an inventory simulation application using Python's Streamlit library.
This approach can be used for any of the 50+ analytics solutions shared in this blog.
I hope that you are now convinced that you have everything on hand to become a supply chain data scientist whose skills are valued for their impact on operations.
As someone who recently started my own company providing analytics products, I can confirm there is a need for these skills.
And we can have fun working on these kinds of projects!
About Me
Let’s connect on LinkedIn and Twitter. I am a Supply Chain Engineer who uses data analytics to improve logistics operations and reduce costs.
For consulting or advice on analytics and sustainable supply chain transformation, feel free to contact me via Logigreen Consulting.
If you are interested in Data Analytics and Supply Chain, look at my website.