Business Planning with Python — Inventory and Cash Flow Management
How can you use data analytics to help small businesses manage inventory, predict liquidity needs, and maximize profitability?
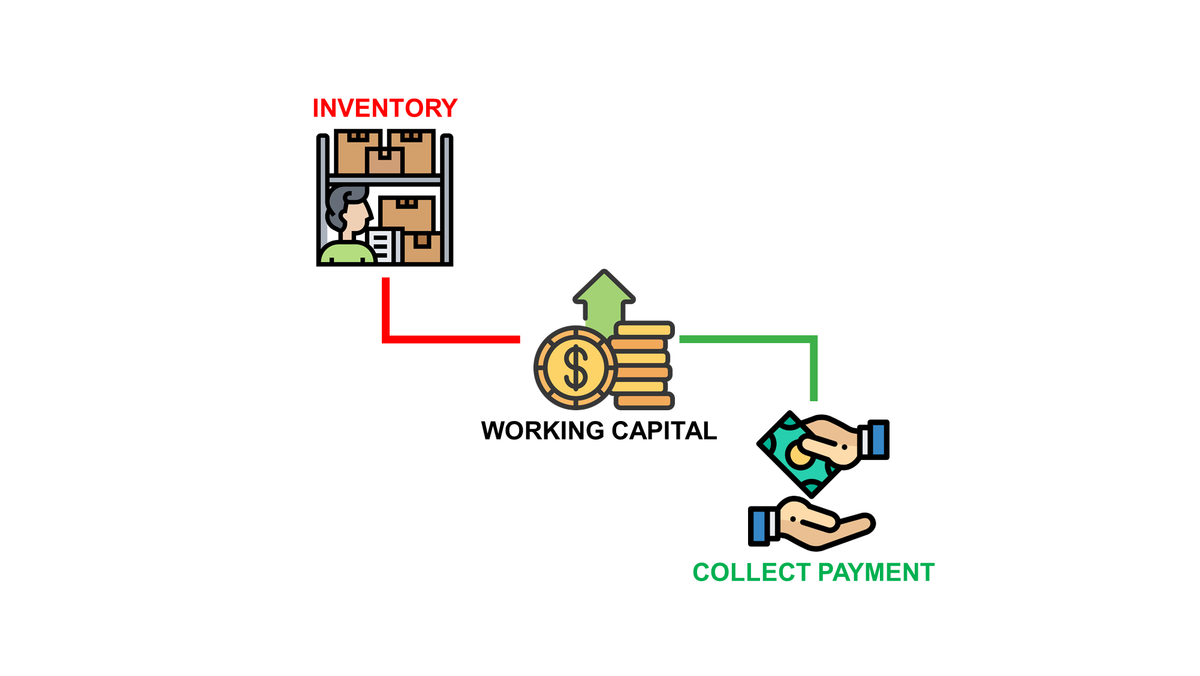
Cash flow management can be defined as the process of monitoring and optimizing the net amount of cash receipts minus cash expenses.
After talking with a friend who manages a medium-sized business, I discovered that cash may be the biggest bottleneck to growth.
“We have to refuse orders as we don’t have enough cash to pay suppliers for stock replenishment.”
As a supply chain data scientist, I quickly connected this problem to sourcing, inventory management and distribution planning.
Can we develop a python model to simulate financial and good flows to support business planning?
In this article, I will share the approach and the tools used to build a simple modelisation of this problem.

We will use my friend's small business as an example. They sell cups made from renewable materials to coffee shops and distributors.
I. Problem Statement: Business Planning
How to help a company selling renewable coffee cups?
1. Inventory Management Simulation
2. Financial Analysis: Costs & Revenue
3. Cash Flow Simulation
II. Business Planning Optimization
What can we do to solve liquidity and profitability issues?
1. Scenario 1: Order Quantity Optimization
2. Scenario 2: Air Freight for Inbound Logistics
3. Scenario 3: Sales Channel Optimization
4. The Optimal Scenario
III. Conclusion
Improve sustainability and profitability with advanced analytics solutions.
If you prefer to watch, have a look at my YouTube tutorial
Problem Statement: Business Planning
This part will briefly introduce the elements I’ve collected to understand my friend's business model.
These points cover
- Inventory Management: order, receive, store and deliver products
❓ When do we need to order to meet customers' demands? - Finance: costs and revenue flows
💡 Profit & Loss Analysis weekly analysis. - Commercial: sales channels, service level agreements and commissions
❔ How much profit do we make if we sell to XXX?
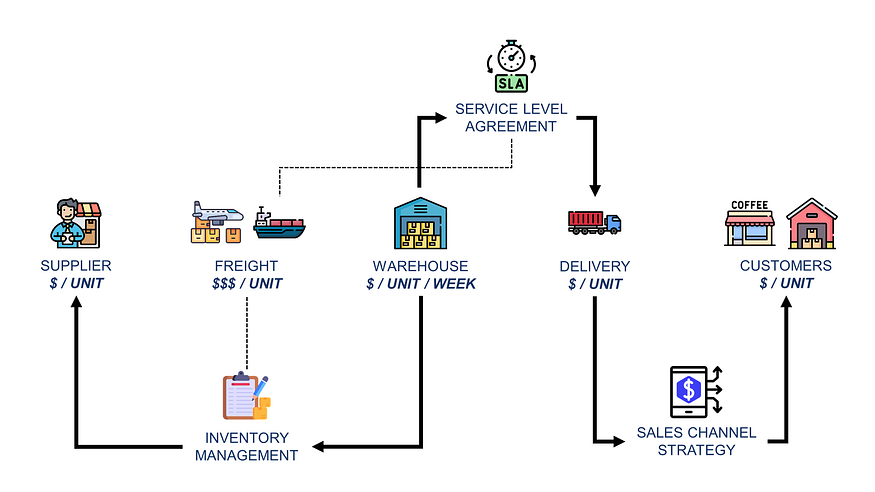
We will model each of these elements to understand how they interact with each other and to optimize the overall value chain.
Inventory Management Simulation
To start, we will implement an inventory management rule at the core of the model to meet customers’ demands at the lowest cost.
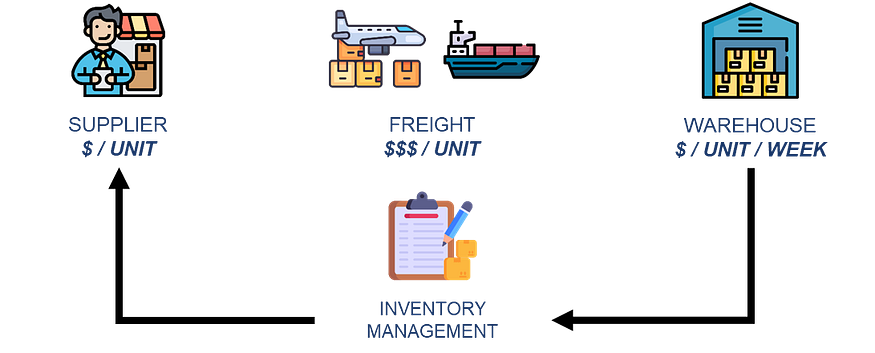
The inventory management rule is a cog in the machine as
- Inventory can become a bottleneck for commercial growth
You can’t ship items you don’t have on hand. - Replenishment capacity is limited by your financial situation
You need cash on hand to pay orders. - Strategic decisions influence the way you manage inventory.
For instance, freight (air or sea) lead time affects the safety of the stock.
This module generates replenishment orders based on customer demand, lead times, and safety stock parameters.
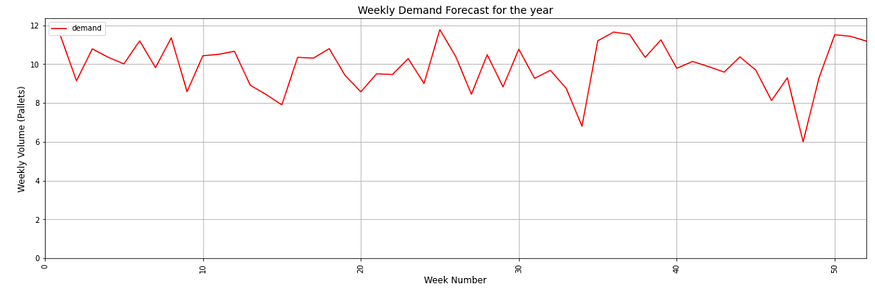
For this exercise, I used the historical sales from 2023 to simulate what would have been the optimal inventory management.
“We are continuously checking the inventory, and we want to cover at least 8 weeks of coverage for each order.”
To answer this request, let’s introduce a continuous review policy (s, Q)
- Continuous review means the inventory team checks inventory levels daily.
- (s, Q) means that if the inventory level is below a certain level s (Pallets), you must order Q (Pallets).

The reorder point is the inventory level you need to meet customers’ demands until you receive your shipment.
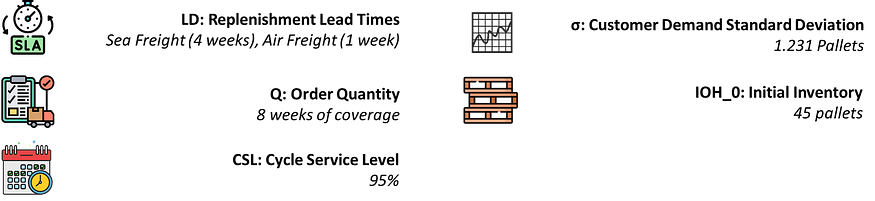
We define it using the replenishment lead time, a target cycle service level and the standard deviation of customers’ demand.
I won’t go into too much detail in this part, which isn't the focus of the article.
The results look like the chart below.
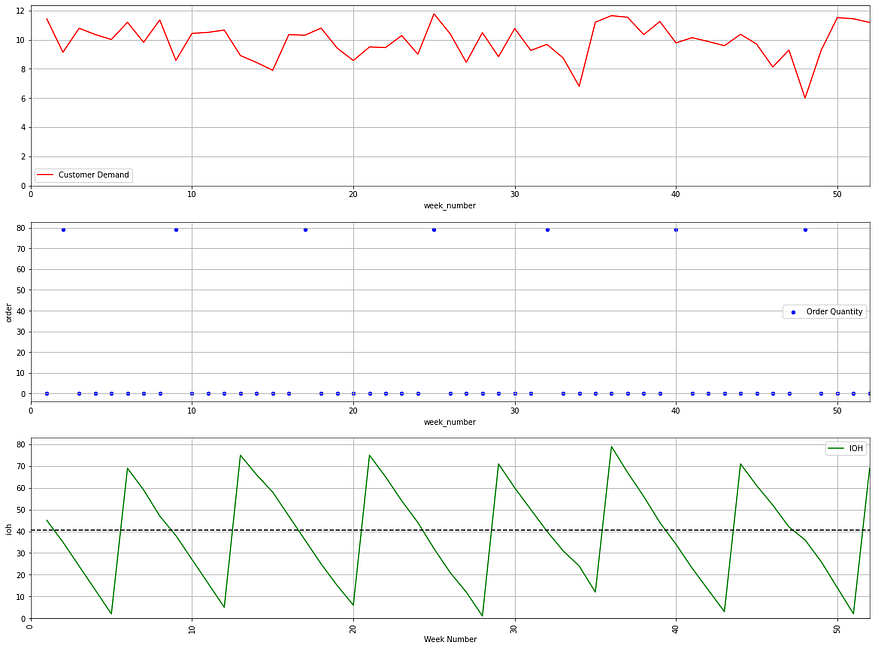
📈 Legend
- The scatter plot in blue represents the optimal order policy.
- The green plot is the inventory on hand (ioh), i.e. the number of pallets stored in the warehouse.
- The dotted line in the third chart represents the reorder point s.
You can observe that you have a replenishment order when the inventory on hand crosses the dotted line.
💡 Observations
- I am not sure that this policy is the most optimal.
We only translate my friend’s standard operating model into an algorithm. - We keep in mind that the order quantity and the replenishment lead time can be tuned to minimize the inventory.
Now that we know when to reorder, we can include financial flows to visualize the cash on hand.
Financial Analysis: Costs & Revenue
The previous section describes the business from a logistics perspective, without considering financial flows.
But my friend's main issue is the limited liquidity available to order goods to replenish the stock.
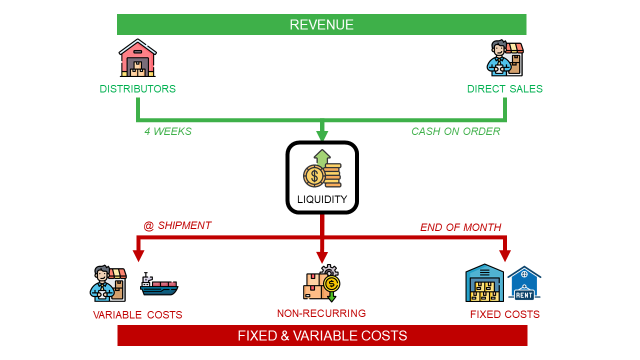
Therefore, we will map the financial flows to calculate the available cash on hand for each week.
Revenue
The historical sales are split by sales channel
- Distributors pay 4 weeks after shipment.
4 weeks after each sale, they are credited with the invoiced amount (Unit Price x Volume) - Coffee shops pay when they place the order.
At the end of each week, they are credited with the invoiced amount (Unit Price x Volume)
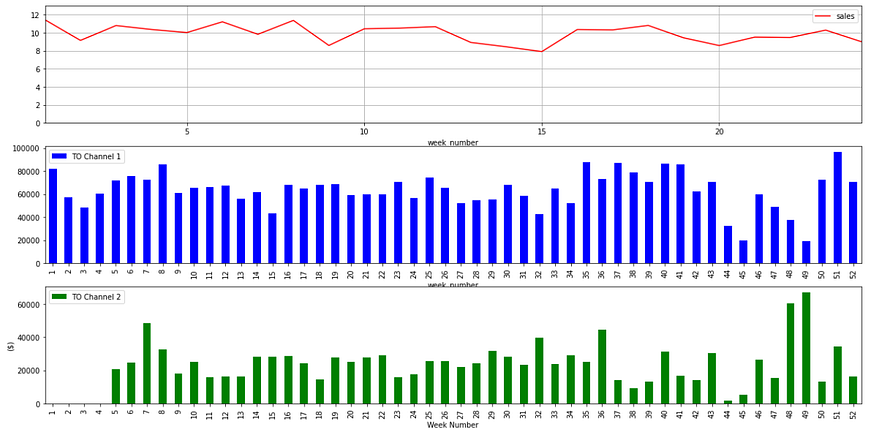
💡 Observations
Because we don’t consider the previous year's sales figures, it is normal for the distributor channel to see no revenue for the first four weeks.
Fixed & Variable Costs
- Sourcing & Inbound Logistics Costs
The suppliers and freight forwarders must be paid upon shipment leaving the factory.
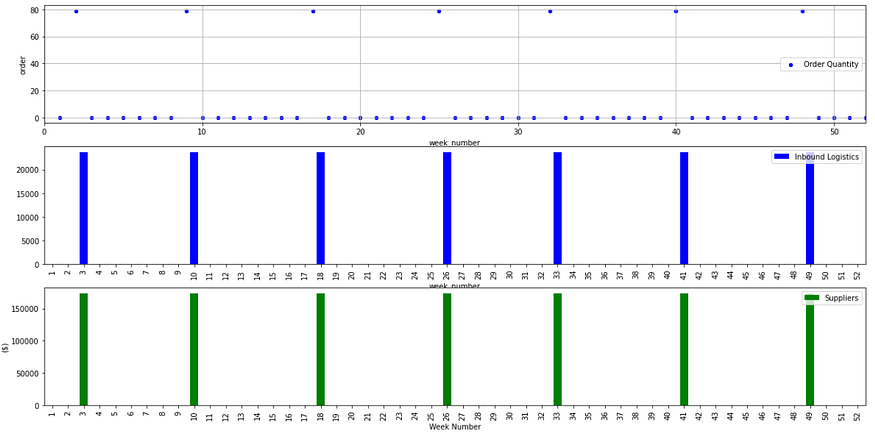
💡 Observations
Orders are ready to ship 1 week after they are created.
- Storage & Structure Costs
They include the storage of pallets (using a unit price in $/pallet/day) and other recurring costs, such as HR costs and equipment.
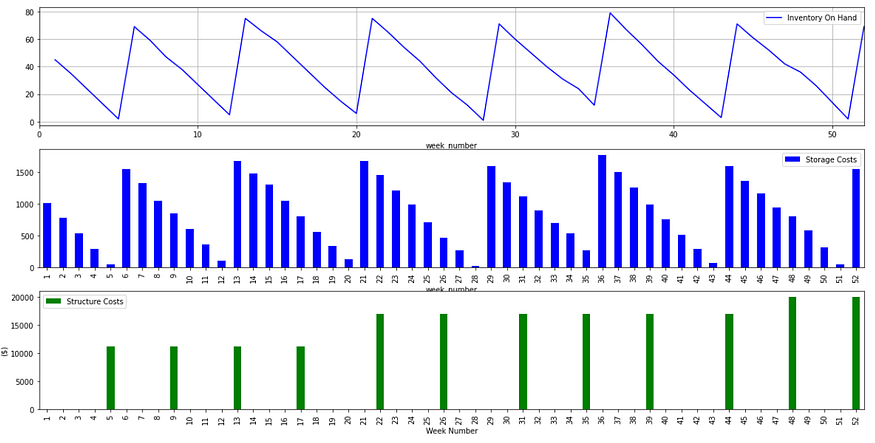
💡 Observations
My friend was lucky enough not to have to pay the minimum fees for storing his pallets in the warehouse.
- Non-recurring costs
These costs, paid in one shot, can include purchasing marketing material, special employee bonuses or distributor penalties. - Commissions Costs
My friend works with independent sales representatives who take a 30% commission on sales to coffee shops.
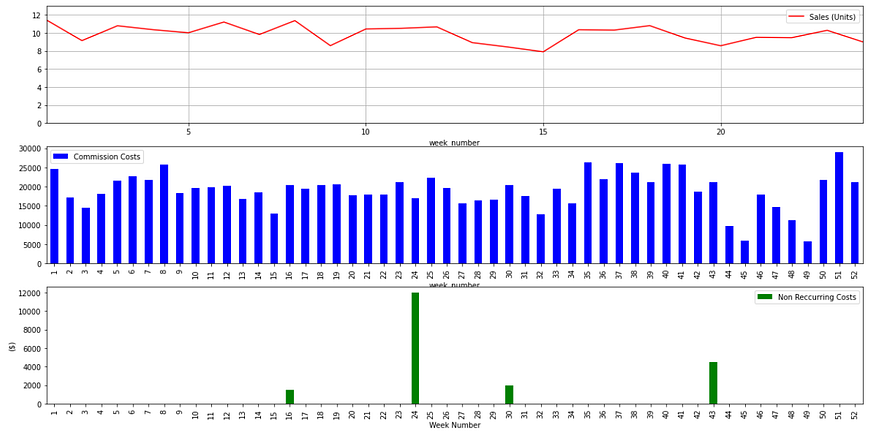
If we summarise, we have
- Revenue flows include the sales from two channels.
Turnover = (Turnover Distributors + Turnover Coffee Shops) - Total costs include fixed, variable, and non-recurring costs.
Total Costs = (Variable Costs + Fixed Costs + Non-Recurring Costs)
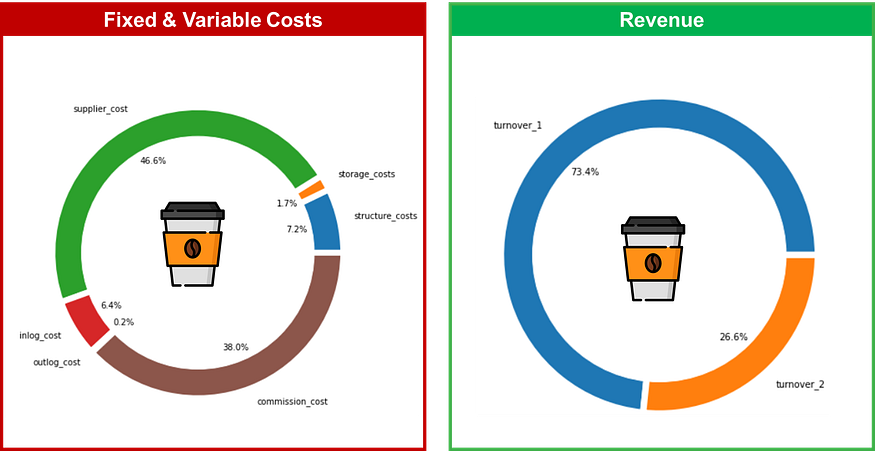
💡 Observations
- We have very low structural costs, with fixed costs below 10%.
- Commissions are the second-largest cost category.
Now that we have the visibility of the financial flows, lets have a look at the liquidity balance per week.
Cash Flow Simulation
Calculating weekly cash flow helps us understand how much cash is needed to sustain this activity through the end of the year.
- Cash Flow = Turnover — Costs
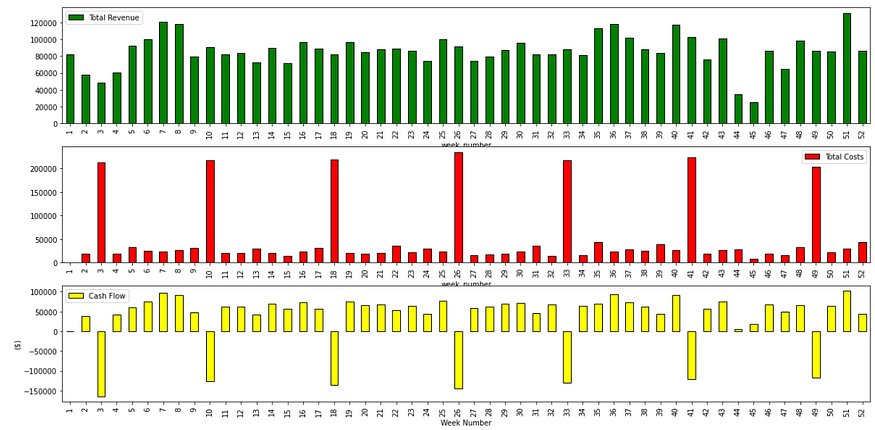
💡 Observations
- The cash flow is always positive, except when paying suppliers and freight forwarders.
How much cash do we have on hand?
If we assume that we start the year with no cash (bad idea),
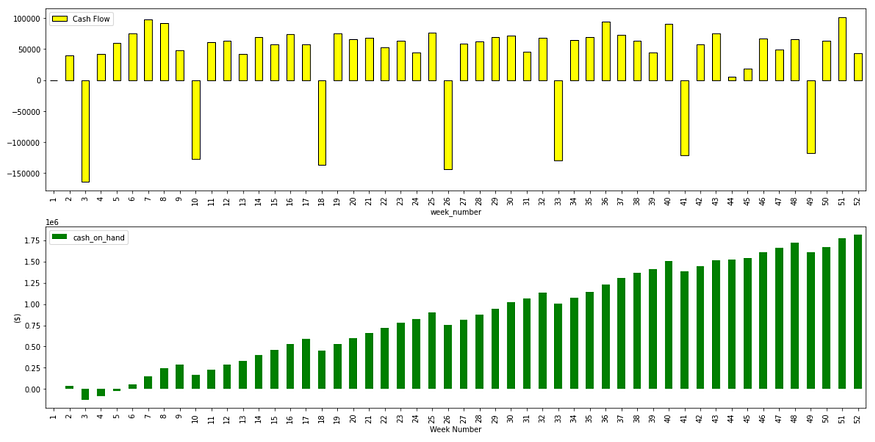
- The minimum amount of cash on hand is -124,733 $
- The cash on hand is negative in week 3 and week 4.
💡 Conclusion
They would need at least 125k $ at the beginning of the year to run the activity smoothly and pay suppliers on time.
The next section will define several performance indicators and simulate scenarios to provide data-driven business insights.
Business Planning Optimisation
Now that our model is in place, we can play with the parameters and simulate different scenarios.
Each scenario will be assessed using four indicators.
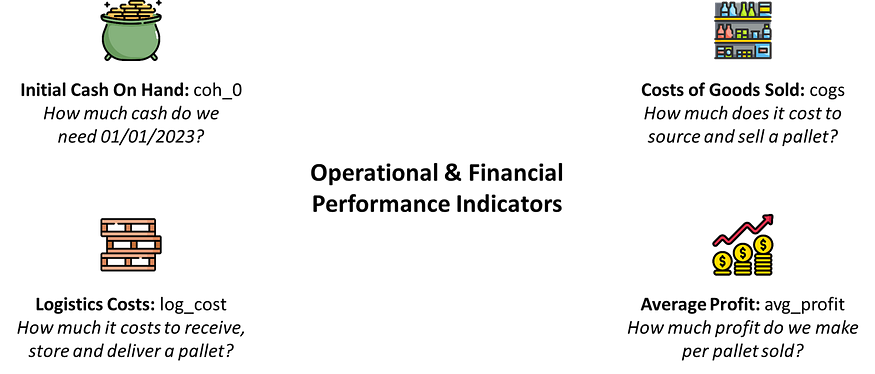
- Initial cash on hand needed at the beginning of the year: coh_0 ($)
Initial Scenario: coh_0 = 124,733 ($) - Average cost of goods sold (COGS): cogs ($/Pallet)
Initial Scenario: cogs = 5,057 ($/Pallet) - Average logistics costs per pallet: log_cost ($/Pallet)
Initial Scenario: log_cost= 417 ($/Pallet) - Average profitability per pallet: avg_profit ($/Year)
Initial Scenario: avg_profit = 3,686 ($/Year)
The idea is to measure the business and operational performance along the value chain versus the initial scenario.
Scenario 1: Order Quantity Optimisation
As a Supply Chain Engineer, I would start by examining the logistic flows and the inventory management rules.
What if we reduce the order quantity?
My first reaction when my friend explained his liquidity issues was to question the order quantity.
Do you need really need to order for 8 weeks of coverage?
Ordering 8 weeks on average is a way for him to secure enough inventory to avoid worrying about stock-outs (i.e. orders cancelled due to missing inventory).
Now that we have an optimal inventory management rule with a safety stock, we can try to reduce the order quantity to Q = 6 weeks of coverage.
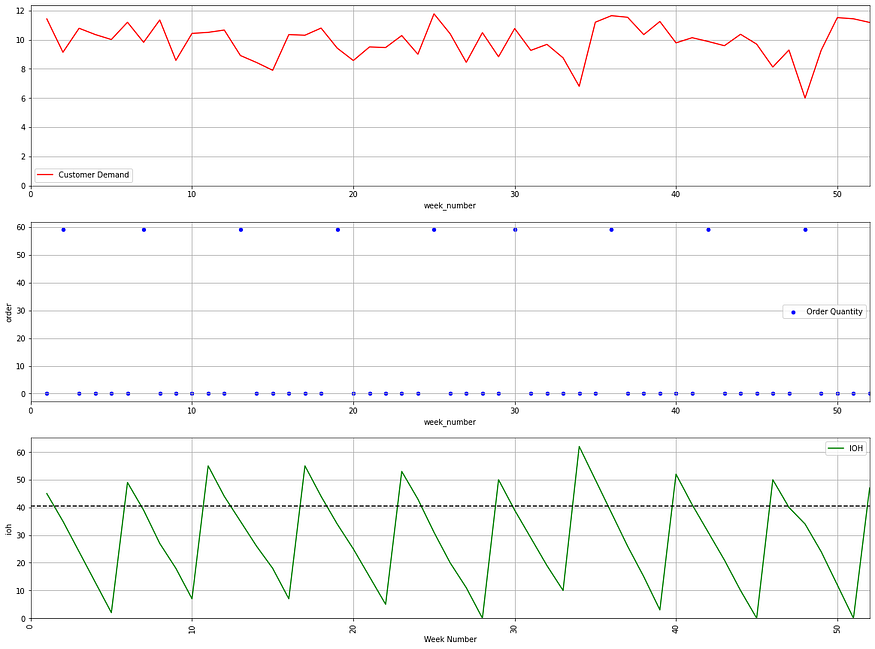
Looking at the projected inventory on hand, we closely avoid stock-outs, and the impact on the profitability is not negligible.
- You need less cash on hand at the beginning of the exercise.
Scenario 1: coh_0 = 74,733 ($) | -41 % - A large reduction in the Cost of Goods Sold (COGS).
Scenario 1: cogs = 4,928 ($/Pallet) | -2.6 % - A better profitability per pallet sold.
Scenario 1: avg_profit = 3,815 ($/Pallet) | +3 %
💡 Conclusion
This quick win provides a buffer for liquidity needs and generates additional profit.
This feedback triggered a deep reflection on the strategic vision of this business's value chain.
- 🙋♂️ Why not switch to air freight for inbound logistics?
Air freight is extremely expensive but offers greater flexibility, i.e., lower average inventory. - 🙋♀️ Should we only sell to distributors?
Distributors' payment terms are longer (4 weeks), but we don’t have to pay sales commissions, and we have lower outbound logistics costs.
These interrogations are legit, but answering them requires complex calculations that our model can fully automate.
Scenario 2: Air Freight for Inbound Logistics
In my experience, air freight is mainly used for high-value products that require fast delivery (mainly luxury items or automotive parts).
However, I proposed to my friend to do the exercise
- Air freight fares proposed by the forwarder are 3 times higher
- The delivery lead time goes from 4 weeks to 1 week.
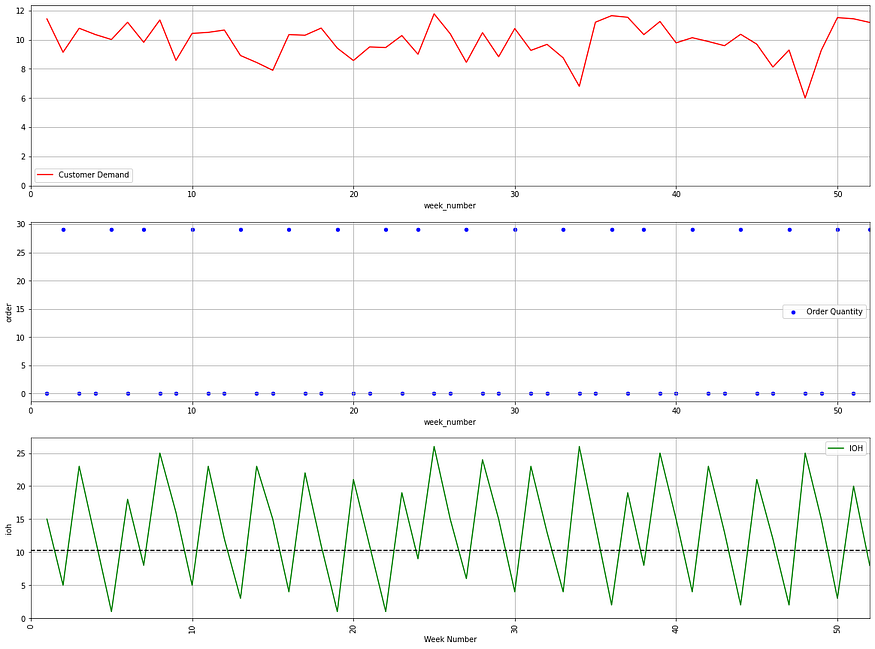
We can now reduce the order quantity from 8 weeks to 3 weeks of coverage.
💡 Observations
- The average inventory level is lower than previously, which can reduce storage costs.
- We are ordering more frequently and in a lower quantity.
Unfortunately, this does not compensate for the prohibitive air freight costs.
- This results in an increase in Cost of Goods Sold (COGS).
Scenario 2: cogs = 5,511 ($/Pallet) | +8 % - That results in a lower profitability per pallet sold.
Scenario 2: avg_profit = 3,232 ($/Pallet) | -12% - Fortunately, you need less cash on hand at the beginning of the year.
Scenario 2: coh_0 = 17,288 ($) | -86 %
To conclude, this is not a great idea as it reduces profitability in the long run.
Scenario 3: Sales Channel Optimisation
For this last scenario, we will focus on the sales channel strategy.
To whom and how do we sell our cups?
In the current scenario, we have a mix of direct sales to coffee shops and partnerships with distributors.
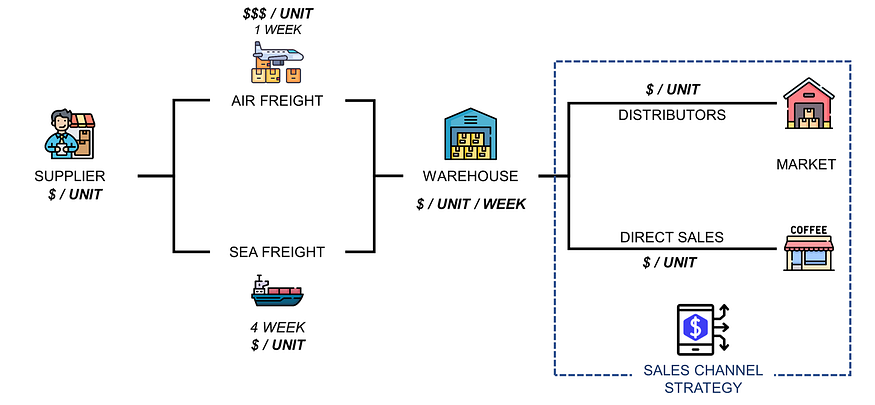
If we switch to distributors only,
- Payments are received 4 weeks after shipment
- We don’t have to pay commissions on sales.
0 % sales commission vs. 30 % for direct sales - We can optimise deliveries with combined shipments.
-50% in outbound logistics costs vs. direct sales
The first impact is that we have to wait 4 weeks to receive our first payments, which affects liquidity needs.
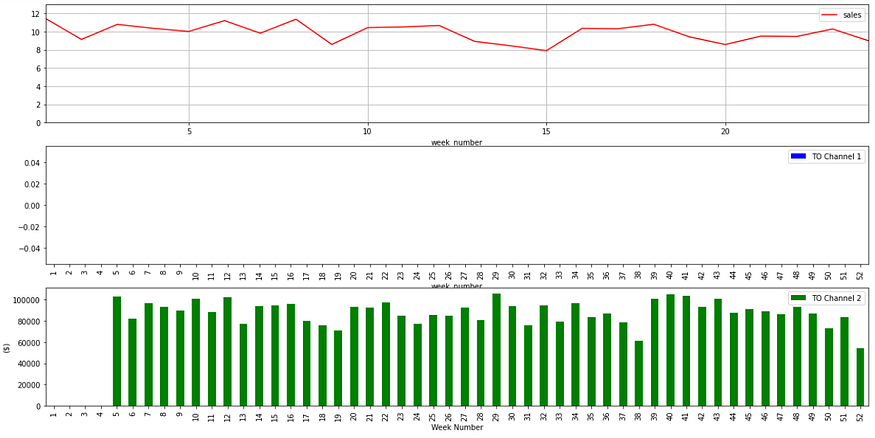
- You need more cash on hand at the beginning of the exercise.
Scenario 3: coh_0 = 197,602 ($) | -58 %
However, you are cutting the commission costs, which improves the profitability.
- Great impact on the Cost of Goods Sales (COGS).
New Scenario: cogs = 3,172 ($/Pallet) | -38 % - A better profitability per pallet sold.
New Scenario: avg_profit = 5,068 ($/Pallet) | +37 %
The Optimal Scenario
This little exercise provides better visibility and insights into maximising profitability without impacting the business.
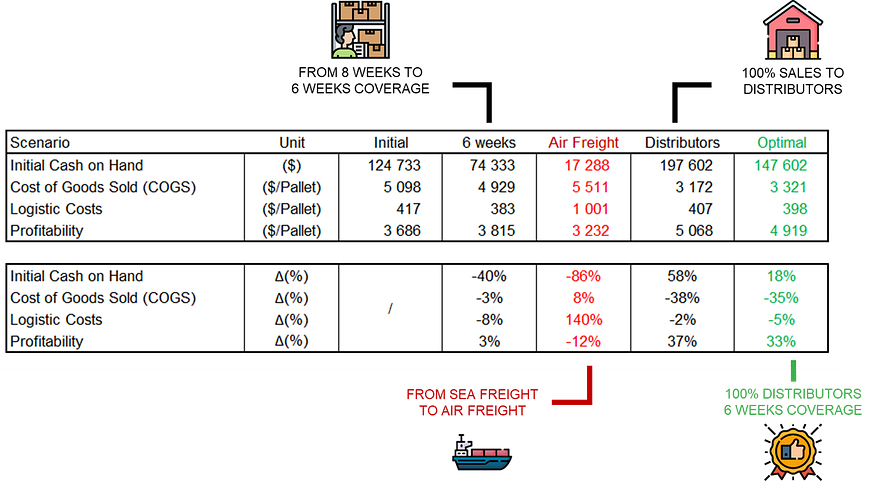
If my friend wants to maximise the profitability of his business, he needs
- To get more orders from distributors and stop direct sales.
- Switch to six weeks of coverage when ordering from suppliers.
If he follows this plan, the data suggests he may increase his profit by 33%.
Conclusion
This approach enables translating opaque operational procedures and business practices into a simple model.
This model enables us to understand how each component of the value chain interacts with the others.
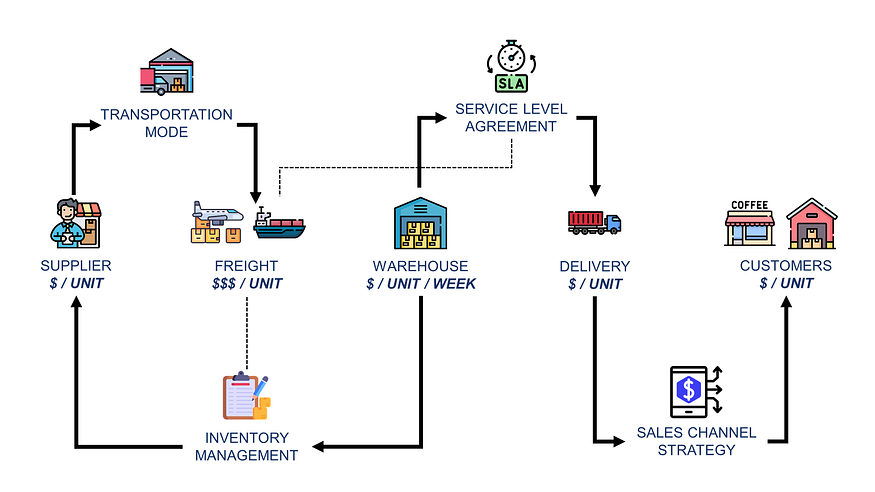
The idea was to provide, in one click, the answers to questions like:
- What if I switch from sea to air freight?
- What is the best sales channel?
- What is the impact of logistic costs on the overall profit?
What’s next? More granularity and additional cost structures.
Although this simple model already provides key strategic insights, it has limitations.
- Purchase cost structure should include MOQ and degressive pricing.
Based on this structure, you can find the optimal order quantity to minimise the cost of ordering and receiving your products.
More details in this article,
- Forwarders and transportation companies invoice based on volumes and service level agreements.
If we offer flexibility to logistics service providers, they will have more opportunities to optimise their routes and reduce their prices.
This was a frequent exercise for me when I was a Supply Chain Solution Manager; an example is in this article.
- Fixed costs must be detailed by category: CAPEX, HR, utilities, …
I have shared an example of the cost breakdown of warehousing operations on my YouTube Channel,
- Sales pricing can include reductions for shorter payment terms or degressive amounts based on ordered volumes.
- We can expand the scope to multiple items for sale and consider a mix of products to optimise costs and revenue.
We can use linear programming and Python to help my friend maximise profitability by selling the right items while considering liquidity, storage, and supplier capacity constraints.
You can learn more about this methodology in this article,
- We can optimise the supplier selection based on profitability or sustainability constraints.
This initial model is considering a single supplier for our coffee cups. However, my friend is working on diversifying his sourcing by qualifying suppliers in different parts of the world.
What about the environmental impact of this business?
After collecting data from these different suppliers, we can use a simple web application I developed to help us design the optimal supply chain network.
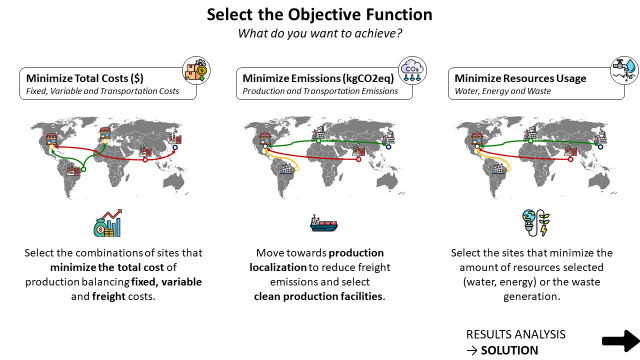
Based on an objective, minimising cost or a specific environmental metric, the algorithm automatically selects the best suppliers.
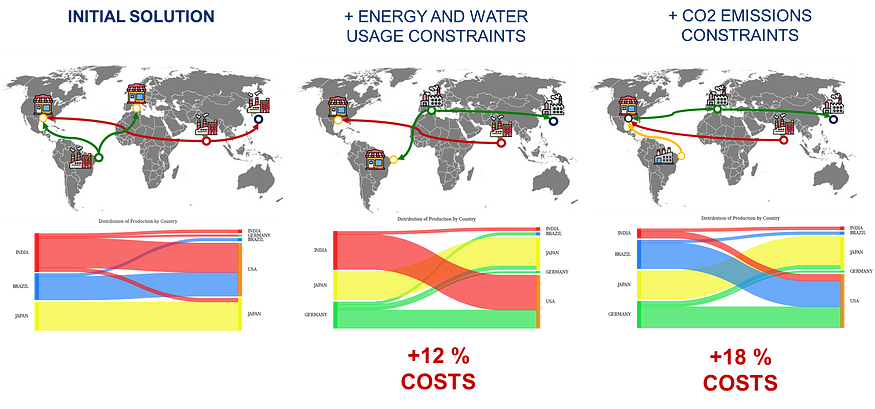
It creates the supply chain flows to produce and deliver goods to your customers.
For more details, check this video
What’s next?
The idea is to gather all the levers of improvement we can use to maximise profitability, reduce the environmental impact and avoid stress on liquidity.
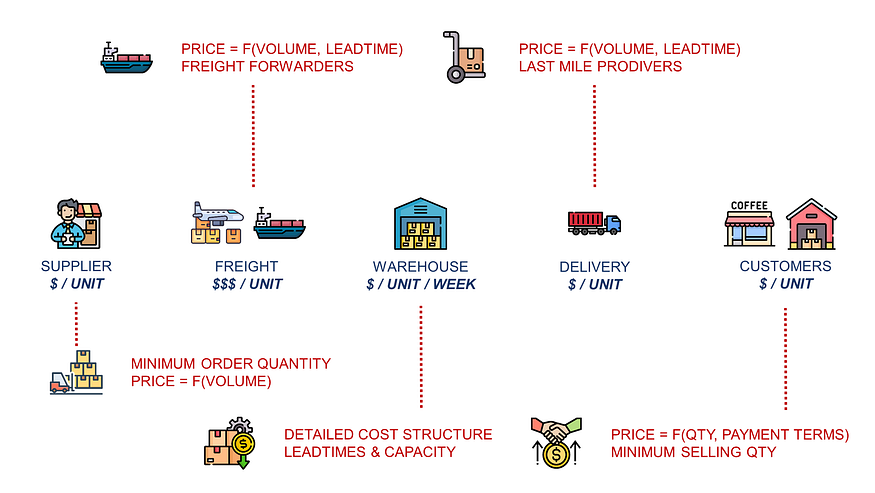
In the next article, I will share the changes my friend implemented in his business and updates on the modelling.
Where to go next
- Supply Chain Strategy: How to Turn One Sentence From the Owner Into a Model: A method for supply chain strategy that starts from what the owner says, finds the parameters inside it, connects them into one loop
- Business Planning with Python — Revenue Optimization: How can you use data analytics to help small businesses maximize their revenue while maintaining or improving profitability?
- Automate Accounting Tasks using Python: Build Solutions to Automate Repetitive Tasks for Financial Audits and Share them with Your Finance Colleagues to Improve their Productivity
About Me
Let’s connect on LinkedIn and Twitter. I am a Supply Chain Engineer using data analytics to improve logistics operations and reduce costs.