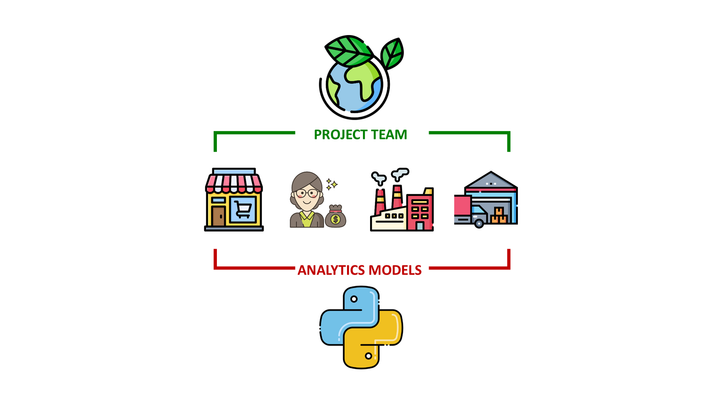
Automate Accounting Tasks using Python
Build Solutions to Automate Repetitive Tasks for Financial Audits and Share them with Your Finance Colleagues to Improve their Productivity

If you want to impact with solutions to automate repetitive tasks, go to your Finance Department.
Based on my experience, they are still relying on manual processing of complex and heavy Excel files.
In this article, I will share a solution based on my experience extracting data from highly unstructured Excel Files to support operational and financial audits.
💌 New articles straight to your inbox for free: Newsletter
Scenario
Problem Statement
You are working as a Data Analyst for a major Logistics Company,expenses and your colleagues from the Finance Team request your support to build a model to predict the P&L of Warehouse Operations.
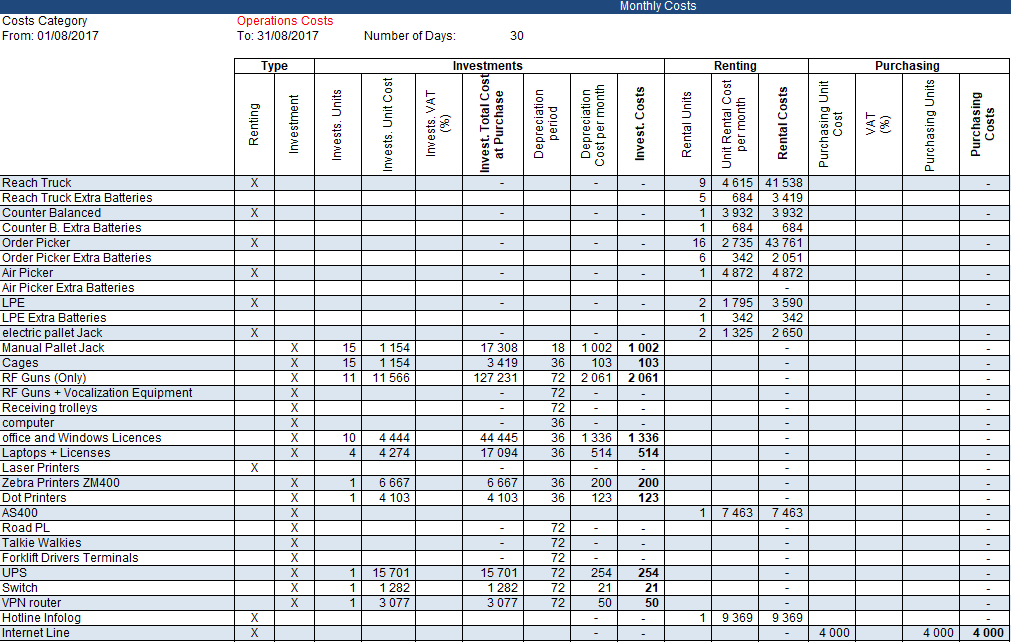
You need to extract information from monthly reports built by accounting teams, listing all the detailed costs by category
- 20 Warehouses included in your study
- Audit of the last 36 Months
- 720 Excel Files in Total
- 60 Item Costs to track
- 3 categories of expenses: Investments, Rental, Purchasing
Objective
Your objective is to build a tool that automatically extracts data from each of the 720 Excel files, formats it, and combines it into a single report.
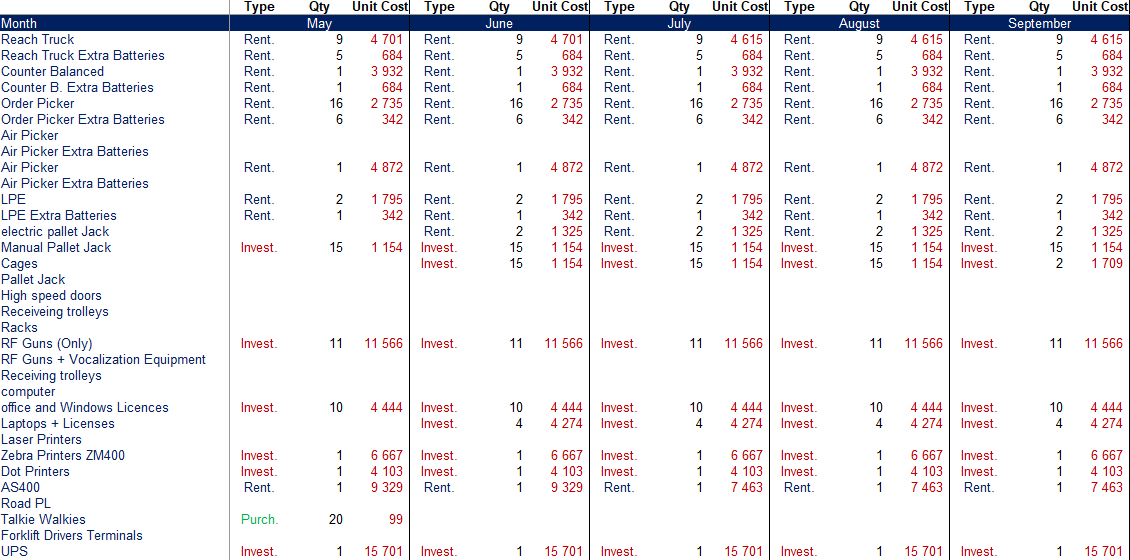
This report will be used by finance to analyse costs over the last 3 years and identify trends.
Your tool will help you gain visibility in a single report without requiring additional resources to manually produce it.
Your Solution
You will design a simple Python script that will perform:
- Open every Excel Report located in a folder
- Processing and cleaning data
- Build the monthly report following the format presented above
- Merge the monthly report with the global data frame
- Saving final results in an Excel file
Import Monthly Excel Reports and Process Data
A few important points here:
- Header parameters of pandas only take the 5th (very useful with Excel files)
- Fill nan with 0 to perform calculations on numeric values
- Trim column names: this report will be used by finance to analyse costs over the last 3 years and identify trends.
If you have admins doing manual input (‘Unit Cost’ and ‘Unit Cost ‘ look the same for your users).
Format columns and perform the calculations
This part is significantly linked to the report I processed.
You can find the code for reference here:

Share this tool
Now that you’ve built your tool, you would like to share it with Finance teams.
It used to take 2 weeks full-time (1 headcount) to perform these tasks at my previous company.
Could you imagine the impact you would have if you could implement this simple tool?
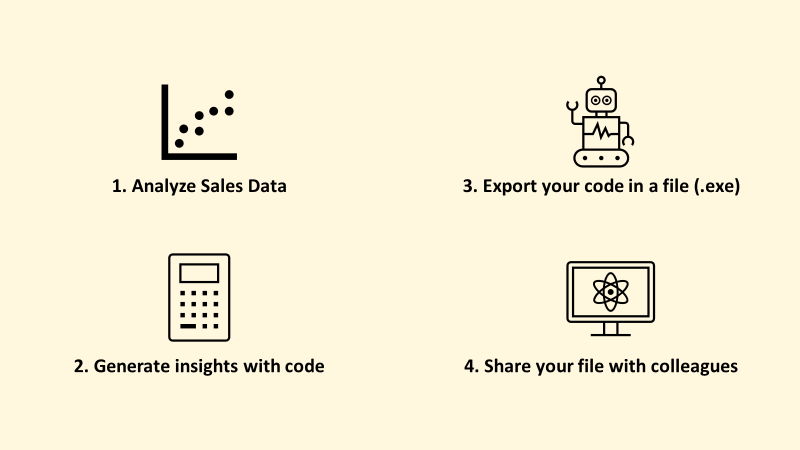
In this short article, I explain how to convert this simple script into an executable (.exe) that can be run without Python on the machine.
About Me
Let’s connect on LinkedIn and Twitter. I am a Supply Chain Engineer who is using data analytics to improve logistics operations and reduce costs.
If you’re looking for tailored consulting solutions to optimise your supply chain and meet sustainability goals, feel free to contact me.